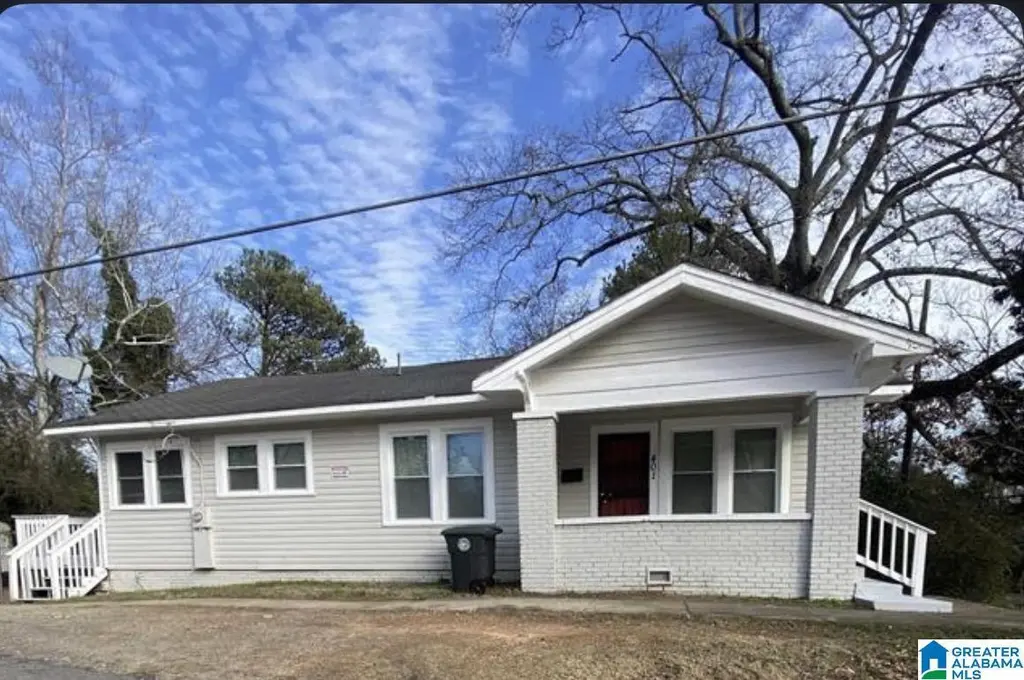
5401 Avenue M · Birmingham, AL
Flood risk 1/10 · Minimal
- FEMA flood zone
- X (unshaded)
- Chance of flooding over 30 yrs
- 0.0%
- Est. flood insurance / yr
- $507 – $1,088
Fire risk 1/10 · Minimal
- Est. fire insurance / yr
- $916 – $1,700
Heat risk 7/10 · Major
- Hot days now (above 108°F)
- 7 days/yr
- Hot days in 30 yrs
- 19 days/yr
Wind risk 6/10 · Moderate
- Chance of severe wind over 30 yrs
- 27.0%
Air-quality risk 4/10 · Minor
- Unhealthy air days now
- 5 days/yr
- Unhealthy air days in 30 yrs
- 5 days/yr
Risk factors via First Street. Map © Google.
Why this score? — see what drove the C- grade
The composite is a weighted blend of 9 inputs, each scored 0–100. Each bar is that input's sub-score; the figure is the points it added to the 100-point composite (weight × sub-score).
- Cash flow +25.9/30.0
- DSCR +8.7/10.0
- 1% rule +6.1/10.0
- Rent growth +4.3/5.0
- Livability +3.4/5.0
- Condition / age +2.5/5.0
- Schools +0.9/10.0
- ARV discount +0.0/15.0
- Appreciation +0.0/10.0
$105,000
🖨 Deal sheet 📄 Offer letter ✓ Due diligence
Listing remarks MLS
Please be respectful and DO NOT DISTURB THE TENANT or be on the premises without the owner's listing agent's, or property management's prior approval. Great investment opportunity! This 3-bedroom, 2-bath, 1200 sq. ft. home offers consistent monthly rental income. Ideal for investors looking to expand their portfolio with a cash-flowing property. New roof & water heater in 2024, A/C less than 10yrs. old per the seller. Hardwoods throughout, except for kitchen and bathrooms.
Key facts
- Water heater
- Hardwoods throughout
- New roof
Tags
Neighborhood map
What this means for you Summary
Snapshot
- This is a 3-bed/1.0-bath single-family listed at $105k.
Deal economics
- At list price, monthly cash flow is $257 ($3k/yr) — positive.
- The deal already cash-flows at list — no discount required.
- Meets the 1% rule at list price ($1k rent vs $105k).
- Recommended offer: $99k (6.0% below list) — sets the bar for market timing.
- Cap rate 9.2% vs local median 6.2% in Birmingham — top-decile yield for the area; either an underpriced asset or a hidden risk that comps aren't pricing in. Stress-test before assuming the spread holds.
Location & tenants
- Location reads 67/100 on livability (#78 in AL) — a middle-class / working-renter tenant base. Strengths: commute A+, cost of living A+, housing A+; Watch: amenities C-, schools F, crime F.
- Birmingham City (urban): math 4% / reading 20% proficiency, ranked #116 of 129 in AL (top 90%) — low school quality limits family demand, transient renter base, plan for 1-2y turnover; 82% free/reduced lunch — lower-income household profile, screen leases tightly.
- Market conditions: Rents rising fast (+7.2%/yr); 122 active listings in the ZIP; 40 comparable units currently listed for rent nearby; rentals lingering (median 44d on market — plan ~5-8 weeks vacancy on turnover, expect pricing pressure); 58% of comp listings sitting > 30 days — soft ceiling on asking rent; lower-income renter base — watch delinquency; 2,114 units permitted in Jefferson County in 2024 (556 in 5+ unit buildings).
- This rent runs 36% of the median local income ($39k/yr) — at the standard rent-burdened threshold; future hikes will face affordability resistance.
Forward outlook
- Local home prices are declining (-3.0%/yr); year-one equity from $726 of loan paydown is wiped out by about $3k of value loss. Plan a longer hold.
- Jefferson County population projected to shrink 4% by 2050 — rents likely to lag national; underwrite the cash flow, not the appreciation.
- At projected returns (-3.0% appreciation + 7.2% rent growth), your $29k cash investment doubles in ~8 years — after that, you're playing with house money.
Negotiation context
- It's been on market 62 days — a 6% lower offer ($99k) is reasonable based on typical stale-listing flexibility.
- 4 sale attempts since 10y ago with the ask held roughly flat each time — persistent listings suggest the price (not the market) is what's stuck; bring a comps-based counter.
- Current owner paid $55k; list at $105k implies a 91% gain — meaningful room to come down on a strong offer.
Risks & watch-outs
- Watch-outs: built in 1925 — expect roof / HVAC / electrical / plumbing capex.
- Climate carrying-cost: major wind risk, 27% chance of damaging wind over 30y; extreme-heat days projected 7→19/yr by 2055 (HVAC capex compounding) — expect insurance premiums to compound above CPI over the hold.
Questions for the listing agent
- It's been on market 62 days. Have you received any prior offers? Is the seller open to a 6% concession, seller financing, or rate buy-down credit?
- Built in 1925 — when were the roof, HVAC, electrical panel, plumbing, and water heater last replaced?
- Why hasn't it sold? Are there any deal-killer items the seller is aware of (foundation, flood, title, zoning, code violations)?
- Is there a deadline driving the sale (1031 exchange, divorce, estate, relocation)? That informs how much negotiation room exists.
- Schools are F-rated, which usually means shorter tenancies and higher turnover. Who's the typical renter profile here, and what's been the actual vacancy rate?
- Crime grade is F in this area — have there been break-ins, vandalism, or insurance claims at this property in the last 3 years? What carrier currently insures it and at what premium?
- What's the average days-on-market for RENTAL listings here right now (not sales)? A rising rental-DOM trend means longer vacancies and softer asking-rent achievability than the comps imply.
- What's the recent tenant-quality profile in this submarket — average credit score on applications, eviction rate, late-payment / NSF rate, and stable-employment percentage? A property-management company in the area should have these aggregated.
- How much new for-sale + rental construction is in the pipeline within 1–3 miles? Heavy new supply typically softens prices + rents 12–24 months out; constrained supply supports both.
Investment metrics
- 1% rule
- 1.11% ✓
- Cap rate
- 9.23%
- Cash-on-cash
- 10.49%
- DSCR
- 1.47
- GRM
- 7.5
CMA / ARV
- ARV (median comp)
- $77,347
- List price
- $105,000
- Delta
- 35.75%
- Verdict
- OVERPRICED
- Comps
- 20 within 1.0 mi
Show comp detail 12 sales within ~0.75 mi
| Address | Dist | Beds/Ba | Sqft | Sold | Price | $/sf | Match |
|---|---|---|---|---|---|---|---|
| 1508 W 51st St | 0.37mi | 3/1.5 | 1,264 (+5%) | 2mo | $30,000 | $24 | 70 |
| 5528 Avenue Q | 0.50mi | 3/1.0 | 1,252 (+4%) | 2mo | $52,900 | $42 | 68 |
| 1407 57th Pl W | 0.30mi | 3/1.0 | 1,084 (-10%) | 4mo | $79,000 | $73 | 67 |
| 5621 Avenue Q | 0.54mi | 3/1.0 | 1,136 (-5%) | 1mo | $72,000 | $63 | 65 |
| 1569 Meadow Ln | 0.68mi | 3/1.5 | 1,192 (-1%) | 2mo | $50,000 | $42 | 64 |
| 821 46th St | 0.65mi | 3/1.0 | 1,254 (+4%) | 0mo | $116,000 | $93 | 62 |
| 940 47th Street Ensley | 0.52mi | 3/1.0 | 1,100 (-8%) | 0mo | $49,000 | $45 | 62 |
| 5604 Terrace O | 0.34mi | 4/1.0 (+1) | 1,072 (-11%) | 2mo | $80,000 | $75 | 60 |
| 5625 Avenue Q | 0.54mi | 3/1.0 | 1,103 (-8%) | 3mo | $22,000 | $20 | 59 |
| 6144 Court M | 0.55mi | 3/1.0 | 1,066 (-11%) | 2mo | $76,000 | $71 | 54 |
| 5541 Court P | 0.48mi | 2/1.0 (-1) | 1,035 (-14%) | 1mo | $35,000 | $34 | 49 |
| 5800 Court Q | 0.61mi | 3/1.0 | 1,024 (-15%) | 2mo | $111,000 | $108 | 46 |
Match score weights: distance 35% · size 25% · config 20% · recency 20%. Top-matched comps best support the ARV.
Projected returns pro-forma
-3.0% appreciation · 7.24% rent growth · sell at horizon
- IRR
- 3.8%
- Equity multiple
- 1.15×
- Total profit
- $4,508
- Equity at exit
- $15,656
- IRR
- 16.8%
- Equity multiple
- 2.64×
- Total profit
- $48,107
- Equity at exit
- $9,078
Cash invested: $29,400 (down + closing). Projections, not guarantees.
Landlord ↔ Tenant lean methodology
- Overall (STATE)
- 90 Strongly Landlord-Friendly
- State Alabama
- 90 Strongly Landlord-Friendly · R+15
- County
- — inherits STATE
- City
- — inherits STATE
ZIP-level market 35208
- Home prices YoY
- -18.1%
- Rents YoY
- 7.2%
- Active inventory
- 122
- Price-to-rent
- 7.5×
Monthly cashflow live
- Estimated rent
- $1,164 high interval (Pro) →
- Mortgage (P&I)
- −$551
- Tax from tax record
- −$68 /mo · $821/yr
- Insurance
- −$44
- HOA
- −$0
- Vacancy / Maint / Mgmt
- −$244
- Net cashflow
- $257
Break-even live
UW: 25.0% down · 7.5% · 30yr · 1.5% tax · 5.0% vac · 8.0% maint · 8.0% mgmt
Financing live
Cash to close
- Down payment
- $26,250
- Closing costs
- $3,150
- Reserves months
- —
- Total cash needed
- —
Loan-product check · same deal, 3 products live
Conventional
25% down · 7.5% · 30yr
- Down + closing
- —
- Monthly P&I
- —
- Monthly cashflow
- —
- DSCR
- —
- Eligible?
- —
Personal DTI + credit; lowest rate.
DSCR
20% down · 8.5% · 30yr
- Down + closing
- —
- Monthly P&I
- —
- Monthly cashflow
- —
- DSCR
- —
- Eligible?
- —
No personal income docs; deal must DSCR.
Hard money
10% down · 12.0% · 12mo
- Down + closing
- —
- Monthly P&I
- —
- Monthly cashflow
- —
- DSCR
- —
- Eligible?
- —
Short-term bridge; refi at stabilization.
Rent comps 40 comps
| Address | Beds | Baths | Sqft | Rent | $/sqft | DOM | Units | Dist |
|---|---|---|---|---|---|---|---|---|
| 5710 Monte Sano Dr Birmingham, AL | 2.0 | 1.0 | 700 | $950 | $1.36 | 43d | 1 | 0.27mi |
| 5604 Terrace O Birmingham, AL | 4.0 | 1.0 | 1072 | $1,325 | $1.24 | 43d | 1 | 0.32mi |
| 5717 Avenue O Unit O Birmingham, AL | 3.0 | 2.0 | 1029 | $1,250 | $1.21 | 43d | 1 | 0.33mi |
| 4716 Court M Birmingham, AL | 4.0 | 1.0 | 932 | $1,200 | $1.29 | 43d | 1 | 0.34mi |
| 5725 Avenue O Unit O Birmingham, AL | 3.0 | 1.0 | 957 | $1,073 | $1.12 | 23d | 1 | 0.34mi |
| 5712 Monte Sano Rd Birmingham, AL | 2.0 | 1.0 | 700 | $900 | $1.29 | 43d | 1 | 0.35mi |
| 5516 Avenue P Birmingham, AL | 2.0 | 1.0 | 888 | $1,000 | $1.13 | 43d | 1 | 0.36mi |
| 5316 Court I Birmingham, AL | 3.0 | 2.0 | 1284 | $1,200 | $0.93 | 43d | 1 | 0.37mi |
| 5808 Court O Birmingham, AL | 3.0 | 1.5 | 1227 | $1,100 | $0.90 | 43d | 1 | 0.41mi |
| 1429 47th Street Ensley Unit ENSLEY Birmingham, AL | 2.0 | 1.0 | 768 | $750 | $0.98 | 43d | 1 | 0.42mi |
| 1112 47th St W Birmingham, AL | 2.0 | 1.0 | 1166 | $975 | $0.84 | 43d | 1 | 0.42mi |
| 5713 Avenue P Unit P Birmingham, AL | 3.0 | 1.0 | 1300 | $1,100 | $0.85 | 19d | 1 | 0.43mi |
| 1037 47th Street Ensley Unit ENSLEY Birmingham, AL | 3.0 | 2.0 | 1299 | $1,000 | $0.77 | 43d | 1 | 0.43mi |
| 5300 Avenue I Birmingham, AL | 4.0 | 2.0 | 1360 | $1,500 | $1.10 | 1d | 1 | 0.43mi |
| 1340 Pineview Rd Birmingham, AL | 3.0 | 2.0 | 1116 | $1,075 | $0.96 | 43d | 1 | 0.44mi |
| 829 51st Street Ensley Birmingham, AL | 3.0 | 1.0 | 1203 | $1,340 | $1.11 | 3d | 1 | 0.46mi |
| 1341 Pineview Rd Birmingham, AL | 4.0 | 2.0 | 1409 | $1,300 | $0.92 | 43d | 1 | 0.47mi |
| 1632 51st Street Ensley Unit ENSLEY Birmingham, AL | 3.0 | 1.0 | 1337 | $1,100 | $0.82 | 43d | 1 | 0.47mi |
| 1632 51st St W Birmingham, AL | 3.0 | 1.0 | 1337 | $1,000 | $0.75 | 1d | 1 | 0.47mi |
| 1556 Burgin Ave Birmingham, AL | 4.0 | 1.0 | 1168 | $1,100 | $0.94 | 19d | 1 | 0.48mi |
| 1556 Burgin Ave Birmingham, AL | 3.0 | 1.0 | 1168 | $1,100 | $0.94 | 21d | 1 | 0.48mi |
| 1410 46th Street Ensley Unit ENSLEY Birmingham, AL | 3.0 | 1.0 | 1200 | $1,000 | $0.83 | 43d | 1 | 0.49mi |
| 5709 Court H Birmingham, AL | 4.0 | 1.5 | 1455 | $1,400 | $0.96 | 1d | 1 | 0.49mi |
| 1606 49th Street Ensley Unit ENSLEY Birmingham, AL | 3.0 | 2.0 | 1136 | $1,100 | $0.97 | 43d | 1 | 0.53mi |
| 1515 45th Street Ensley Unit ENSLEY Birmingham, AL | 3.0 | 1.0 | 1440 | $875 | $0.61 | 3d | 1 | 0.56mi |
| 5219 Court Q Birmingham, AL | 3.0 | 2.0 | 1082 | $1,200 | $1.11 | 19d | 1 | 0.56mi |
| 920 47th Street Ensley Birmingham, AL | 3.0 | 1.0 | 1070 | $895 | $0.84 | 3d | 1 | 0.58mi |
| 5219 Court G Unit G Fairfield, AL | 3.0 | 1.0 | 1140 | $950 | $0.83 | 23d | 1 | 0.58mi |
| 1272 Meadow Ln Birmingham, AL | 2.0 | 1.0 | 744 | $800 | $1.08 | 43d | 1 | 0.59mi |
| 5832 Court Q Birmingham, AL | 3.0 | 1.0 | 912 | $950 | $1.04 | 44d | 1 | 0.60mi |
| 5820 Court Q Birmingham, AL | 3.0 | 1.0 | 902 | $1,200 | $1.33 | 43d | 1 | 0.60mi |
| 5320 Ter Q Unit Q Birmingham, AL | 3.0 | 2.0 | 1116 | $1,250 | $1.12 | 43d | 1 | 0.60mi |
| 5406 Court G Unit G Fairfield, AL | 3.0 | 2.0 | 1449 | $1,199 | $0.83 | 11d | 1 | 0.60mi |
| 1509 44th Street Ensley Unit ENSLEY Birmingham, AL | 3.0 | 1.5 | 1260 | $1,123 | $0.89 | 11d | 1 | 0.62mi |
| 5211 Ter Q Unit Q Birmingham, AL | 2.0 | 1.0 | 756 | $775 | $1.03 | 43d | 1 | 0.63mi |
| 5503 Myron Massey Blvd Fairfield, AL | 3.0 | 2.0 | 1119 | $1,200 | $1.07 | 43d | 1 | 0.63mi |
| 1436 44th Street Ensley Unit ENSLEY Birmingham, AL | 4.0 | 2.0 | 1435 | $1,495 | $1.04 | 1d | 1 | 0.63mi |
| 813 46th St Fairfield, AL | 2.0 | 1.0 | 1100 | $825 | $0.75 | 10d | 1 | 0.68mi |
| 4619 Terrace Q Birmingham, AL | 3.0 | 2.0 | 1198 | $900 | $0.75 | 43d | 1 | 0.70mi |
| 1604 44th Street Ensley Unit ENSLEY Birmingham, AL | 3.0 | 1.0 | 1100 | $1,200 | $1.09 | 23d | 1 | 0.70mi |
Listing history 31 events
-
2026-06-18days on market $105,000 Active 62 DOM
-
2026-06-17days on market $105,000 Active 61 DOM
-
2026-06-16days on market $105,000 Active 60 DOM
-
2026-06-15days on market $105,000 Active 59 DOM
-
2026-06-13days on market $105,000 Active 57 DOM
-
2026-06-10days on market $105,000 Active 54 DOM
-
2026-06-09days on market $105,000 Active 53 DOM
-
2026-06-08days on market $105,000 Active 52 DOM
-
2026-06-07pricedays on market $105,000 Active 51 DOM
-
2026-06-03days on market $110,000 Active 47 DOM
-
2026-06-02days on market $110,000 Active 46 DOM
-
2026-06-01days on market $110,000 Active 45 DOM
-
2026-05-31days on market $110,000 Active 44 DOM
-
2026-04-17$110,000 Active 483-char remark
Show marketing remark (483 chars)
Please be respectful and DO NOT DISTURB THE TENANT or be on the premises without the owner's listing agent's, or property management's prior approval. Great investment opportunity! This 3-bedroom, 2-bath, 1200 sq. ft. home offers consistent monthly rental income. Ideal for investors looking to expand their portfolio with a cash-flowing property. New roof & water heater in 2024, A/C less than 10yrs. old per the seller. Hardwoods throughout, except for kitchen and bathrooms.
-
2025-09-05historical $1,095
-
2025-08-14price $1,095
-
2025-05-01price $1,195
-
2025-04-09price $1,200
-
2025-03-26price $1,250
-
2025-02-19price $1,275
-
2025-01-15$1,300
-
2023-03-17soldstatus $55,000 Sold 130-char remark
Show marketing remark (130 chars)
3 Bedroom 2 Bath home sits on corner lot, has tons of potential. Needs Rehab. Will be sold "as-is. " List date 2/14/2023
-
2023-03-17soldstatus $59,000
Show marketing remark (130 chars)
3 Bedroom 2 Bath home sits on corner lot, has tons of potential. Needs Rehab. Will be sold "as-is. " List date 2/14/2023
-
2023-02-21historical Contingent 130-char remark
Show marketing remark (130 chars)
3 Bedroom 2 Bath home sits on corner lot, has tons of potential. Needs Rehab. Will be sold "as-is. " List date 2/14/2023
-
2022-02-14$64,000 Active 130-char remark
Show marketing remark (130 chars)
3 Bedroom 2 Bath home sits on corner lot, has tons of potential. Needs Rehab. Will be sold "as-is. " List date 2/14/2023
-
2022-02-03price $835
-
2016-04-26soldstatus $54,000
-
2016-03-04soldstatus $13,000 Sold
-
2016-02-02status Pending
-
2016-01-15$24,900 Active
-
2001-07-24soldstatus $68,500
ⓘ Source: listings_history table (triggers on properties + properties_extension) + one-shot
backfill from property_details.listing_events for pre-trigger history.
Tax reassessment forecast AL · Resets to sale price
- Current annual tax
- $821 · $68/mo
- Projected year-2 tax
- $821 · $68/mo
- Expected delta
- $0/yr ($0/mo · 0.0%)
ⓘ Screening estimate from a state-policy table — verify with the county assessor before closing.
Climate risk First Street
- Flood 1/10 Low FEMA zone X (unshaded) · 0% chance over 30 yrs
- Wildfire 1/10 Low
- Heat 7/10 Severe 7 d/yr ≥108°F today · 19 d/yr by 30 yrs out
- Wind 6/10 Major 27% chance of damaging wind over 30 yrs
- Air quality 4/10 Moderate 5 unhealthy d/yr today · 5 by 30 yrs out
Nearby sold comps map
Loading sold comps map…
Walkable amenities ~0.75 mi
Loading nearby amenities…
Taxation est. · year 1
- Rental income
- $13,970
- − Mortgage interest
- −$5,882
- − Property taxes
- −$821
- − Insurance
- −$525
- − Repairs & maintenance
- −$1,118
- − Management
- −$1,118
- − Depreciation
- −$3,055
- Taxable income
- $1,453
- Est. tax owed @ 24.0%
- −$349
- After-tax cash flow
- $2,735/yr
For passive investors: Depreciation is non-cash, so a rental often shows a tax loss while cash-flowing — sheltering income. Rental losses are passive: they offset passive income freely, and up to $25,000/yr can offset ordinary (W-2) income if you actively participate and your MAGI is under $100k (phasing out to $0 by $150k); unused losses carry forward. On sale, claimed depreciation is recaptured at up to 25%, and gains may owe capital-gains tax (a 1031 exchange can defer both). Figures are a year-1 estimate at your 24.0% rate — not tax advice; consult a CPA.
Schools (NCES district)
- District
- Birmingham City
- NCES district ID
- 0100390
- Math proficiency
- 4% ▼ -17.00%
- Reading proficiency
- 20% ▼ -4.00%
- Median HH income
- $31,988
- Composite
- 9.49/100
- National rank
- #9850
- State rank
- #116 of 129 in AL
Livability — Birmingham
- Score
- 67/100
- State rank
- #78
- US rank
- #10412
Category grades
Schools grade is shown separately in the Schools card above.
Census & demographics
- Census place
- Birmingham, AL
- County
- Jefferson County · 527,445 people
- City population
- 210,422
- Metro
- Birmingham-Hoover, AL
- Population (ZIP)
- 13,412
- Household income
- $38,561
- Rent vs Own
- Severe rent burden
- 573.0
Population outlook (Jefferson County) Hauer SSP2
- Today (2025)
- 669,185 people
- By 2030
- 669,694 · +0.1%
- By 2040
- 661,388 · -1.2%
- By 2050
- 643,086 · -3.9%
- By 2075
- 577,267 · -13.7%
- By 2100
- 474,758 · -29.1%
Race, ethnicity, and origin ACS 2023
- Neighborhood character
- Predominantly Black (94%)
- Race & ethnicity
- Black 94% White 4% Hispanic / Latino 2% Two or more races 1%
- Foreign-born
- 3% · Canada
- Languages at home
- 96% English-only · Spanish 2%
Political lean MEDSL · Jefferson
- 2024 margin
- D (+10.4) · D 54.6% · R 44.2% · Other 1.2%
- 2008→2024 swing
- +5.4pp toward D · 2008: 5.1pp · 2024: 10.4pp
- All cycles
- 2024: D+10.4 2020: D+13.2 2016: D+7.2 2012: D+6.0 2008: D+5.1
Not yet ingested
- Civics
- —
Market trends
- HPI YoY
- ▼ -33.99%
- Current HPI
- 153.414
- Rent YoY
- ▲ 7.24%
- Metro
- Birmingham-Hoover, AL
- State GDP YoY
- ▲ 2.94%
- F500 in state
- 4
Industry mix (Fortune 500 HQ in AL)
| Industry | F500 HQs | Revenue |
|---|---|---|
| Financial Services | 1 | $8B |
|
||
| Healthcare | 1 | $5B |
|
||
Price history
+60.6% since first listed18 events — show timeline
- 2026-04-17 Listed $110,000 Greater Alabama MLS
- 2025-09-05 Rental Removed $1,095 GALMLS
- 2025-08-14 Price Changed $1,095 GALMLS
- 2025-05-01 Price Changed $1,195 GALMLS
- 2025-04-09 Price Changed $1,200 GALMLS
- 2025-03-26 Price Changed $1,250 GALMLS
- 2025-02-19 Price Changed $1,275 GALMLS
- 2025-01-15 Listed for Rent $1,300 GALMLS
- 2023-03-17 Sold (Public Records) $59,000 Public Records
- 2023-03-17 Sold (MLS) $55,000 Greater Alabama MLS
- 2023-02-21 Contingent — Greater Alabama MLS
- 2022-02-14 Listed $64,000 Greater Alabama MLS
- 2022-02-03 Price Changed $835 RENT.
- 2016-04-26 Sold (Public Records) $54,000 Public Records
- 2016-03-04 Sold (MLS) $13,000 Greater Alabama MLS
- 2016-02-02 Pending — Greater Alabama MLS
- 2016-01-15 Listed $24,900 Greater Alabama MLS
- 2001-07-24 Sold (Public Records) $68,500 Public Records
Property tax history
-0.3%/yrLatest (2025): $821 · +0.0% YoY. Source: county tax records.
Cash-flow waterfall
monthlySold comps — $/sqft
last 12 mo · ≤1 miLoading sold comps…