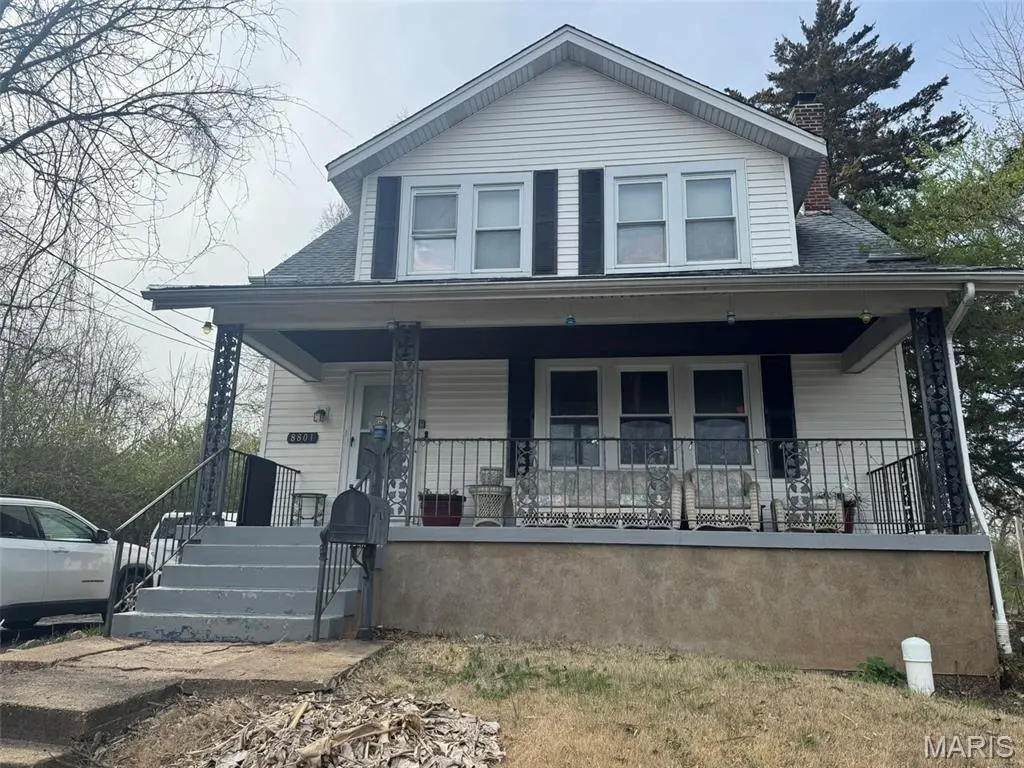
8801 Blewett Ave · Jennings, MO
Flood risk 1/10 · Minimal
- FEMA flood zone
- X (unshaded)
- Chance of flooding over 30 yrs
- 0.0%
- Est. flood insurance / yr
- $473 – $860
Fire risk 1/10 · Minimal
- Est. fire insurance / yr
- $1,054 – $1,958
Heat risk 5/10 · Moderate
- Hot days now (above 107°F)
- 7 days/yr
- Hot days in 30 yrs
- 20 days/yr
Wind risk 2/10 · Minimal
- Chance of severe wind over 30 yrs
- 1.0%
Air-quality risk 4/10 · Minor
- Unhealthy air days now
- 4 days/yr
- Unhealthy air days in 30 yrs
- 5 days/yr
Risk factors via First Street. Map © Google.
Why this score? — see what drove the B grade
The composite is a weighted blend of 9 inputs, each scored 0–100. Each bar is that input's sub-score; the figure is the points it added to the 100-point composite (weight × sub-score).
- Cash flow +28.3/30.0
- DSCR +10.0/10.0
- 1% rule +7.4/10.0
- Appreciation +6.9/10.0
- ARV discount +6.8/15.0
- Rent growth +3.7/5.0
- Livability +3.4/5.0
- Condition / age +2.5/5.0
- Schools +1.1/10.0
$105,000
🖨 Deal sheet (PDF) 📄 Offer letter ✓ Due diligence
Listing remarks MLS
Ideal investment opportunity! Beautifully renovated 3-Bed, 2-Bath home with major updates to keep maintenance costs low. Wood floors throughout main level, separate dining adjoins a modern kitchen adding to the appeal of this home. Home showcases a full basement with plenty of storage, covered patio and spacious backyard. Centrally located near major highways, shopping and local amenities. Main Features: Exterior: New Driveway, Painting of porch, railings, window trims, exterior door. Interior: New paint throughout, new blinds, outlets replaced beautiful wood floors refurbished. Kitchen: New tiles for island countertop, new fridge. Mechanical: New HVAC, new HWT, minor electrical work and new water supply lines.
Key facts
- 6,098 sq ft lot
- Built 1927
- Listed 81 days
Neighborhood map
What this means for you Summary
Snapshot
- This is a 3-bed/1.0-bath single-family listed at $105k.
Deal economics
- At list price, monthly cash flow is $335 ($4k/yr) — positive.
- The deal already cash-flows at list — no discount required.
- Meets the 1% rule at list price ($1k rent vs $105k).
- Recommended offer: $99k (6.0% below list) — sets the bar for market timing.
Location & tenants
- Location reads 67/100 on livability (#208 in MO) — a middle-class / working-renter tenant base. Strengths: cost of living A+, commute A-, housing A-; Watch: crime F, amenities F, employment F.
- Jennings (suburban): math 8% / reading 20% proficiency, ranked #315 of 324 in MO (top 97%) — low school quality limits family demand, transient renter base, plan for 1-2y turnover; 86% free/reduced lunch — lower-income household profile, screen leases tightly.
- Zoned schools: Woodland Elem. (math 5% / reading 15%, grade F, #1,027 of 1,115 statewide, top 93%, 256 students, 100% FRL); Rose Johnson Jennings Jr. High (math 10% / reading 23%, grade F, #357 of 391 statewide, top 91%, 361 students, 100% FRL); Jennings High (math 8% / reading 17%, grade F, #497 of 521 statewide, top 96%, 691 students, 100% FRL).
- Market conditions: Rents rising fast (+5.0%/yr); 376 active listings in the ZIP; 40 comparable units currently listed for rent nearby; rentals at typical pace (median 26d on market — plan ~3-4 weeks tenant-placement turnaround); lower-income renter base — watch delinquency; 920 units permitted in St. Louis County in 2024 (250 in 5+ unit buildings).
- This rent runs 38% of the median local income ($41k/yr) — at the standard rent-burdened threshold; future hikes will face affordability resistance.
Forward outlook
- In year one you build about $5k of equity ($726 loan paydown + $4k appreciation (3.8% local appreciation)).
- At projected returns (3.8% appreciation + 5.0% rent growth), your $29k cash investment doubles in ~4 years — after that, you're playing with house money.
- By year 8, paydown + projected appreciation supports a ~$35k cash-out refi (75% LTV) — recoverable capital for the next deal without selling this one.
Negotiation context
- It's been on market 81 days — a 6% lower offer ($99k) is reasonable based on typical stale-listing flexibility.
Risks & watch-outs
- Watch-outs: built in 1927 — expect roof / HVAC / electrical / plumbing capex.
- Climate carrying-cost: extreme-heat days projected 7→20/yr by 2055 (HVAC capex compounding) — expect insurance premiums to compound above CPI over the hold.
Questions for the listing agent
- It's been on market 81 days. Have you received any prior offers? Is the seller open to a 6% concession, seller financing, or rate buy-down credit?
- Built in 1927 — when were the roof, HVAC, electrical panel, plumbing, and water heater last replaced?
- Why hasn't it sold? Are there any deal-killer items the seller is aware of (foundation, flood, title, zoning, code violations)?
- Is there a deadline driving the sale (1031 exchange, divorce, estate, relocation)? That informs how much negotiation room exists.
- Schools are D-rated, which usually means shorter tenancies and higher turnover. Who's the typical renter profile here, and what's been the actual vacancy rate?
- Crime grade is F in this area — have there been break-ins, vandalism, or insurance claims at this property in the last 3 years? What carrier currently insures it and at what premium?
- What's the average days-on-market for RENTAL listings here right now (not sales)? A rising rental-DOM trend means longer vacancies and softer asking-rent achievability than the comps imply.
- What's the recent tenant-quality profile in this submarket — average credit score on applications, eviction rate, late-payment / NSF rate, and stable-employment percentage? A property-management company in the area should have these aggregated.
- How much new for-sale + rental construction is in the pipeline within 1–3 miles? Heavy new supply typically softens prices + rents 12–24 months out; constrained supply supports both.
Investment metrics
- 1% rule
- 1.24% ✓
- Cap rate
- 10.13%
- Cash-on-cash
- 13.69%
- DSCR
- 1.61
- GRM
- 6.7
CMA / ARV
- ARV (median comp)
- $103,481
- List price
- $105,000
- Delta
- 1.47%
- Verdict
- FAIR
- Comps
- 20 within 1.0 mi
Show comp detail 12 sales within ~0.75 mi
| Address | Dist | Beds/Ba | Sqft | Sold | Price | $/sf | Match |
|---|---|---|---|---|---|---|---|
| 2434 Mary Ave | 0.16mi | 3/1.5 | 1,417 (-1%) | 5mo | $107,000 | $76 | 85 |
| 8721 College Ave | 0.15mi | 2/1.0 (-1) | 1,336 (-6%) | 8mo | $129,900 | $97 | 71 |
| 2506 Shannonaire Dr | 0.57mi | 3/2.0 | 1,450 (+2%) | 2mo | $160,000 | $110 | 65 |
| 8824 Huiskamp Ave | 0.33mi | 4/1.0 (+1) | 1,548 (+9%) | 1mo | $39,500 | $26 | 64 |
| 2508 Main St | 0.43mi | 3/1.0 | 1,298 (-9%) | 8mo | $60,000 | $46 | 59 |
| 2418 Petrova Ave | 0.41mi | 3/1.5 | 1,288 (-10%) | 7mo | $60,000 | $47 | 57 |
| 8898 Darnell Pl | 0.54mi | 3/2.0 | 1,352 (-5%) | 8mo | $185,000 | $137 | 56 |
| 5 Jendale Ct | 0.36mi | 4/1.0 (+1) | 1,267 (-11%) | 7mo | $69,995 | $55 | 54 |
| 9305 Scottdale Ave | 0.58mi | 3/2.0 | 1,280 (-10%) | 3mo | $60,000 | $47 | 49 |
| 8871 Boyce Pl | 0.51mi | 3/2.0 | 1,250 (-12%) | 4mo | $149,900 | $120 | 49 |
| 2429 Mary Ave | 0.21mi | 2/2.5 (-1) | 1,215 (-15%) | 9mo | $95,000 | $78 | 47 |
| 2528 Shannonaire Dr | 0.57mi | 3/1.5 | 1,220 (-14%) | 8mo | $120,000 | $98 | 41 |
Match score weights: distance 35% · size 25% · config 20% · recency 20%. Top-matched comps best support the ARV.
Projected returns pro-forma
3.79% appreciation · 4.97% rent growth · sell at horizon
- IRR
- 23.3%
- Equity multiple
- 2.40×
- Total profit
- $41,100
- Equity at exit
- $51,953
- IRR
- 24.6%
- Equity multiple
- 4.92×
- Total profit
- $115,221
- Equity at exit
- $83,965
Cash invested: $29,400 (down + closing). Projections, not guarantees.
Landlord ↔ Tenant lean methodology
- Overall (STATE)
- 81 Strongly Landlord-Friendly
- State Missouri
- 81 Strongly Landlord-Friendly · R+10
- County
- — inherits STATE
- City
- — inherits STATE
ZIP-level market 63136
- Home prices YoY
- 0.9%
- Rents YoY
- 5.0%
- Active inventory
- 376
- Price-to-rent
- 6.7×
Monthly cashflow live
- Estimated rent
- $1,302 high interval (Pro) →
- Mortgage (P&I)
- −$551
- Tax from tax record
- −$99 /mo · $1,184/yr
- Insurance
- −$44
- HOA
- −$0
- Vacancy / Maint / Mgmt
- −$273
- Net cashflow
- $335
Break-even live
Sensitivity live
| Price | -10% $395 | -5% $365 | +0% $335 | +5% $306 | +10% $276 |
|---|---|---|---|---|---|
| Rent | -10% $233 | -5% $284 | +0% $335 | +5% $387 | +10% $438 |
| Rate | -1.0pp $388 | -0.5pp $362 | base $335 | +0.5pp $308 | +1.0pp $281 |
UW: 25.0% down · 7.5% · 30yr · 1.5% tax · 5.0% vac · 8.0% maint · 8.0% mgmt
Financing live
Cash to close
- Down payment
- $26,250
- Closing costs
- $3,150
- Reserves months
- —
- Total cash needed
- —
Loan-product check · same deal, 3 products live
Conventional
25% down · 7.5% · 30yr
- Down + closing
- —
- Monthly P&I
- —
- Monthly cashflow
- —
- DSCR
- —
- Eligible?
- —
Personal DTI + credit; lowest rate.
DSCR
20% down · 8.5% · 30yr
- Down + closing
- —
- Monthly P&I
- —
- Monthly cashflow
- —
- DSCR
- —
- Eligible?
- —
No personal income docs; deal must DSCR.
Hard money
10% down · 12.0% · 12mo
- Down + closing
- —
- Monthly P&I
- —
- Monthly cashflow
- —
- DSCR
- —
- Eligible?
- —
Short-term bridge; refi at stabilization.
Rent comps 40 comps
| Address | Beds | Baths | Sqft | Rent | $/sqft | DOM | Units | Dist |
|---|---|---|---|---|---|---|---|---|
| 7 Lamar Dr Saint Louis, MO | 3.0 | 1.0 | 894 | $1,200 | $1.34 | 19d | 1 | 0.26mi |
| 2527 Switzer Ave Saint Louis, MO | 3.0 | 1.0 | 888 | $1,135 | $1.28 | 18d | 1 | 0.30mi |
| 2415 Shirley Ave Saint Louis, MO | 3.0 | 1.0 | 990 | $1,450 | $1.46 | 25d | 1 | 0.32mi |
| 8824 Huiskamp Ave Saint Louis, MO | 4.0 | 1.0 | 1548 | $1,200 | $0.78 | 25d | 1 | 0.32mi |
| 2546 Main St Saint Louis, MO | 4.0 | 1.0 | 984 | $1,269 | $1.29 | 45d | 1 | 0.33mi |
| 2427 Switzer Ave Saint Louis, MO | 3.0 | 1.0 | 1008 | $1,300 | $1.29 | 45d | 1 | 0.34mi |
| 2646 Terrace Ln Saint Louis, MO | 3.0 | 2.0 | 1565 | $1,275 | $0.81 | 25d | 1 | 0.35mi |
| 2623 Avie Dr Saint Louis, MO | 3.0 | 2.0 | 921 | $1,350 | $1.47 | 45d | 1 | 0.38mi |
| 44 Jendale Ct Saint Louis, MO | 2.0 | 2.0 | 1820 | $1,350 | $0.74 | 25d | 1 | 0.38mi |
| 8883 Saint Cyr Dr Saint Louis, MO | 2.0 | 1.0 | 1632 | $1,200 | $0.74 | 0d | 1 | 0.50mi |
| 8883 Saint Cyr Dr Saint Louis, MO | 2.0 | 1.0 | 1632 | $1,200 | $0.74 | 45d | 1 | 0.50mi |
| 8817 Shady Grove Ave Saint Louis, MO | 2.0 | 1.0 | 1085 | $1,075 | $0.99 | 25d | 1 | 0.50mi |
| 7441 Calvin Ave Saint Louis, MO | 3.0 | 1.0 | 1068 | $1,350 | $1.26 | 14d | 1 | 0.69mi |
| 7426 Calvin Ave Saint Louis, MO | 2.0 | 1.0 | 1100 | $1,125 | $1.02 | 19d | 1 | 0.71mi |
| 2022 McLaran Ave Saint Louis, MO | 3.0 | 2.0 | 1181 | $1,543 | $1.31 | 0d | 1 | 0.77mi |
| 9547 Glen Owen Dr Saint Louis, MO | 2.0 | 1.0 | 923 | $985 | $1.07 | 25d | 1 | 0.80mi |
| 8527 Dianthus Ln Saint Louis, MO | 3.0 | 1.0 | 976 | $1,295 | $1.33 | 45d | 1 | 0.80mi |
| 5640 Sapphire Ave Saint Louis, MO | 2.0 | 1.0 | 900 | $1,100 | $1.22 | 45d | 1 | 0.80mi |
| 8502 Dianthus Ln Saint Louis, MO | 2.0 | 1.0 | 1072 | $1,175 | $1.10 | 25d | 1 | 0.85mi |
| 1942 Damato Ct Saint Louis, MO | 2.0 | 1.0 | 905 | $1,100 | $1.22 | 45d | 1 | 0.88mi |
| 1942 Damato Ct Saint Louis, MO | 2.0 | 1.0 | 905 | $1,100 | $1.22 | 0d | 1 | 0.88mi |
| 7120 Greenhaven Dr Saint Louis, MO | 3.0 | 2.0 | 1131 | $1,050 | $0.93 | 0d | 1 | 0.92mi |
| 7120 Greenhaven Dr Saint Louis, MO | 3.0 | 2.0 | 1131 | $1,050 | $0.93 | 25d | 1 | 0.92mi |
| 7420 Pleaseway Dr Saint Louis, MO | 2.0 | 1.0 | 952 | $1,250 | $1.31 | 24d | 1 | 0.95mi |
| 7315 Albright Ave Saint Louis, MO | 3.0 | 1.0 | 888 | $1,150 | $1.30 | 45d | 1 | 0.96mi |
| 2056 Coleridge Dr Saint Louis, MO | 3.0 | 1.0 | 949 | $1,195 | $1.26 | 25d | 1 | 0.97mi |
| 2056 Coleridge Dr Saint Louis, MO | 3.0 | 1.0 | 949 | $1,195 | $1.26 | 0d | 1 | 0.97mi |
| 7218 Albright Ave Saint Louis, MO | 2.0 | 1.0 | 1100 | $980 | $0.89 | 25d | 1 | 0.99mi |
| 1550 Northwinds Estates Dr St. Louis, MO | 1.0–2.0 | 1.0–1.5 | 877 | $1,050 | $1.20 | 45d | 1 | 1.01mi |
| 5637 Jennings Station Rd Saint Louis, MO | 3.0 | 1.0 | 1116 | $895 | $0.80 | 45d | 1 | 1.02mi |
| 9709 Balboa Dr Saint Louis, MO | 3.0 | 1.0 | 1000 | $1,600 | $1.60 | 45d | 1 | 1.06mi |
| 2152 Nemnich Rd Saint Louis, MO | 2.0 | 1.5 | 1030 | $1,100 | $1.07 | 45d | 1 | 1.06mi |
| 5516 Fairridge Ct Saint Louis, MO | 2.0 | 1.0 | 1110 | $995 | $0.90 | 25d | 1 | 1.06mi |
| 9717 Dennis Dr Saint Louis, MO | 3.0 | 1.0 | 1056 | $1,323 | $1.25 | 45d | 1 | 1.12mi |
| 5664 Hamilton Ave Saint Louis, MO | 2.0 | 2.0 | 1700 | $1,600 | $0.94 | 45d | 1 | 1.14mi |
| 9418 Pattonwood Dr Saint Louis, MO | 2.0 | 2.0 | 982 | $1,500 | $1.53 | 25d | 1 | 1.15mi |
| 9725 Medford Dr Saint Louis, MO | 3.0 | 1.0 | 912 | $1,485 | $1.63 | 45d | 1 | 1.15mi |
| 5955 Floy Ave Saint Louis, MO | 2.0 | 1.0 | 1032 | $1,050 | $1.02 | 5d | 1 | 1.15mi |
| 9812 Balboa Dr Saint Louis, MO | 4.0 | 2.0 | 1500 | $1,495 | $1.00 | 24d | 1 | 1.17mi |
| 5612 Hodiamont Ave Saint Louis, MO | 3.0 | 1.5 | 1200 | $1,150 | $0.96 | 0d | 1 | 1.19mi |
Listing history 20 events
-
2026-06-21days on market $105,000 Active 81 DOM
-
2026-06-18days on market $105,000 Active 78 DOM
-
2026-06-17days on market $105,000 Active 77 DOM
-
2026-06-16days on market $105,000 Active 76 DOM
-
2026-06-15days on market $105,000 Active 75 DOM
-
2026-06-13days on market $105,000 Active 73 DOM
-
2026-06-09days on market $105,000 Active 69 DOM
-
2026-06-08days on market $105,000 Active 68 DOM
-
2026-06-07days on market $105,000 Active 67 DOM
-
2026-06-03days on market $105,000 Active 63 DOM
-
2026-06-02days on market $105,000 Active 62 DOM
-
2026-06-01days on market $105,000 Active 61 DOM
-
2026-05-31days on market $105,000 Active 60 DOM
-
2026-04-20price $105,000 733-char remark
Show marketing remark (733 chars)
Ideal investment opportunity! Beautifully renovated 3-Bed, 2-Bath home with major updates to keep maintenance costs low. Wood floors throughout main level, separate dining adjoins a modern kitchen adding to the appeal of this home. Home showcases a full basement with plenty of storage, covered patio and spacious backyard. Centrally located near major highways, shopping and local amenities. Main Features: Exterior: New Driveway, Painting of porch, railings, window trims, exterior door. Interior: New paint throughout, new blinds, outlets replaced beautiful wood floors refurbished. Kitchen: New tiles for island countertop, new fridge. Mechanical: New HVAC, new HWT, minor electrical work and new water supply lines.
-
2026-04-01$110,000 Active 733-char remark
Show marketing remark (733 chars)
Ideal investment opportunity! Beautifully renovated 3-Bed, 2-Bath home with major updates to keep maintenance costs low. Wood floors throughout main level, separate dining adjoins a modern kitchen adding to the appeal of this home. Home showcases a full basement with plenty of storage, covered patio and spacious backyard. Centrally located near major highways, shopping and local amenities. Main Features: Exterior: New Driveway, Painting of porch, railings, window trims, exterior door. Interior: New paint throughout, new blinds, outlets replaced beautiful wood floors refurbished. Kitchen: New tiles for island countertop, new fridge. Mechanical: New HVAC, new HWT, minor electrical work and new water supply lines.
-
2026-03-31historical $110,000 733-char remark
Show marketing remark (733 chars)
Ideal investment opportunity! Beautifully renovated 3-Bed, 2-Bath home with major updates to keep maintenance costs low. Wood floors throughout main level, separate dining adjoins a modern kitchen adding to the appeal of this home. Home showcases a full basement with plenty of storage, covered patio and spacious backyard. Centrally located near major highways, shopping and local amenities. Main Features: Exterior: New Driveway, Painting of porch, railings, window trims, exterior door. Interior: New paint throughout, new blinds, outlets replaced beautiful wood floors refurbished. Kitchen: New tiles for island countertop, new fridge. Mechanical: New HVAC, new HWT, minor electrical work and new water supply lines.
-
2022-11-07soldstatus $110,000
-
2021-01-08soldstatus
-
2008-11-20soldstatus $50,000
-
1991-02-26soldstatus $60,000
ⓘ Source: listings_history table (triggers on properties + properties_extension) + one-shot
backfill from property_details.listing_events for pre-trigger history.
Tax reassessment forecast MO · Resets to sale price
- Current annual tax
- $1,184 · $99/mo
- Projected year-2 tax
- $1,184 · $99/mo
- Expected delta
- $0/yr ($0/mo · 0.0%)
ⓘ Screening estimate from a state-policy table — verify with the county assessor before closing.
Climate risk First Street
- Flood 1/10 Low FEMA zone X (unshaded) · 0% chance over 30 yrs
- Wildfire 1/10 Low
- Heat 5/10 Major 7 d/yr ≥107°F today · 20 d/yr by 30 yrs out
- Wind 2/10 Low 100% chance of damaging wind over 30 yrs
- Air quality 4/10 Moderate 4 unhealthy d/yr today · 5 by 30 yrs out
Nearby sold comps map
Loading sold comps map…
Walkable amenities ~0.75 mi
Loading nearby amenities…
Taxation est. · year 1
- Rental income
- $15,623
- − Mortgage interest
- −$5,882
- − Property taxes
- −$1,184
- − Insurance
- −$525
- − Repairs & maintenance
- −$1,250
- − Management
- −$1,250
- − Depreciation
- −$3,055
- Taxable income
- $2,478
- Est. tax owed @ 24.0%
- −$595
- After-tax cash flow
- $3,431/yr
For passive investors: Depreciation is non-cash, so a rental often shows a tax loss while cash-flowing — sheltering income. Rental losses are passive: they offset passive income freely, and up to $25,000/yr can offset ordinary (W-2) income if you actively participate and your MAGI is under $100k (phasing out to $0 by $150k); unused losses carry forward. On sale, claimed depreciation is recaptured at up to 25%, and gains may owe capital-gains tax (a 1031 exchange can defer both). Figures are a year-1 estimate at your 24.0% rate — not tax advice; consult a CPA.
Schools (NCES district)
- District
- Jennings
- NCES district ID
- 2916290
- Math proficiency
- 8% ▼ -16.00%
- Reading proficiency
- 20% ▼ -4.00%
- Median HH income
- $30,595
- Composite
- 11.04/100
- National rank
- #9739
- State rank
- #315 of 324 in MO
Livability — Jennings
- Score
- 67/100
- State rank
- #208
- US rank
- #10499
Category grades
Schools grade is shown separately in the Schools card above.
Census & demographics
- Census place
- Jennings, MO
- County
- Saint Louis County · 888,823 people
- Metro
- St. Louis, MO-IL
- Population (ZIP)
- 40,929
- Household income
- $41,154
- Rent vs Own
- Severe rent burden
- 3085.0
Population outlook (St. Louis County) Hauer SSP2
- Today (2025)
- 1,025,227 people
- By 2030
- 1,028,023 · +0.3%
- By 2040
- 1,020,940 · -0.4%
- By 2050
- 1,007,280 · -1.8%
- By 2075
- 987,277 · -3.7%
- By 2100
- 921,984 · -10.1%
Race, ethnicity, and origin ACS 2023
- Neighborhood character
- Predominantly Black (90%)
- Race & ethnicity
- Black 90% White 5% Two or more races 3%
- Foreign-born
- 1% · Canada
Political lean MEDSL · St. Louis
- 2024 margin
- Strong D (+23.4) · D 60.8% · R 37.4% · Other 1.7%
- 2008→2024 swing
- +3.5pp toward D · 2008: 19.9pp · 2024: 23.4pp
- All cycles
- 2024: D+23.4 2020: D+24.0 2016: D+16.2 2012: D+13.7 2008: D+19.9
Not yet ingested
- Civics
- —
Market trends
- HPI YoY
- ▲ 3.79%
- Current HPI
- 420.28
- Rent YoY
- ▲ 4.97%
- Metro
- St. Louis, MO-IL
- State GDP YoY
- ▲ 1.84%
- F500 in state
- 20
Industry mix (Fortune 500 HQ in MO)
| Industry | F500 HQs | Revenue |
|---|---|---|
| Healthcare | 1 | $163B |
|
||
| Insurance | 1 | $21B |
|
||
| Industrial Technology | 1 | $17B |
|
||
| Retail | 1 | $16B |
|
||
| Industrial Distribution | 1 | $10B |
|
||
| Utilities | 1 | $9B |
|
||
Price history
+75.0% since first listed7 events — show timeline
- 2026-04-20 Price Changed $105,000 MARIS as Distributed by MLS Grid
- 2026-04-01 Listed $110,000 MARIS as Distributed by MLS Grid
- 2026-03-31 Coming Soon $110,000 MARIS as Distributed by MLS Grid
- 2022-11-07 Sold (Public Records) $110,000 Public Records
- 2021-01-08 Sold (Public Records) — Public Records
- 2008-11-20 Sold (Public Records) $50,000 Public Records
- 1991-02-26 Sold (Public Records) $60,000 Public Records
Property tax history
+1.3%/yrLatest (2022): $1,184 · +1.5% YoY. Source: county tax records.
Cash-flow waterfall
monthlySold comps — $/sqft
last 12 mo · ≤1 miLoading sold comps…