 🏗️ New Construction
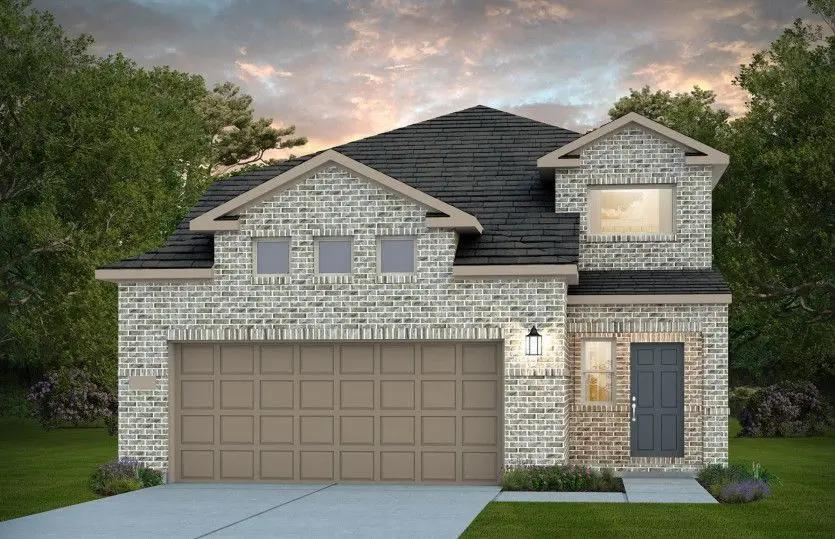
Fentress Plan · Grangerland, TX
Flood risk No data
- FEMA flood zone
- —
- Chance of flooding over 30 yrs
- —
- Est. flood insurance / yr
- —
Fire risk No data
- Est. fire insurance / yr
- —
Heat risk No data
- Hot days now (above threshold)
- —
- Hot days in 30 yrs
- —
Wind risk No data
- Chance of severe wind over 30 yrs
- —
Air-quality risk No data
- Unhealthy air days now
- —
- Unhealthy air days in 30 yrs
- —
Risk factors via First Street. Map © Google.
Why this score? — see what drove the D grade
The composite is a weighted blend of 9 inputs, each scored 0–100. Each bar is that input's sub-score; the figure is the points it added to the 100-point composite (weight × sub-score).
- Cash flow +11.8/30.0
- ARV discount +7.5/15.0
- Schools +5.1/10.0
- Condition / age +5.0/5.0
- DSCR +3.5/10.0
- 1% rule +3.4/10.0
- Rent growth +3.3/5.0
- Livability +2.5/5.0
- Appreciation +0.0/10.0
$285,990
🖨 Deal sheet (PDF) 📄 Offer letter ✓ Due diligence
Listing remarks MLS
A two-story foyer greets you as you enter the dual-level Fentress, and flows seamlessly through to the kitchen with an island, café, and expansive gathering room. Retreat to the private owner's suite on the first floor featuring an oversized walk-in closet. Three secondary bedrooms plus loft space provide plenty of space to relax and unwind and complete this home.
Key facts
- Two-story foyer
- Loft space
- 2 garage spots
Tags
Neighborhood map
What this means for you Summary
Snapshot
- This is a 4-bed/2.5-bath single-family listed at $286k. Condition is rated excellent.
Deal economics
- At list price, monthly cash flow is $-81 ($-977/yr) — negative.
- To cash-flow at today's rent, offer at most $284k (0.8% below list).
- To meet the 1% rule (rent ≥ 1% of price), the offer needs to be $248k (13.2% below list).
- Recommended offer: $248k (13.2% below list) — sets the bar for 1% rule.
Location & tenants
- Location reads: area grade D — affects rentability + tenant quality, not the cash-flow math above.
- Conroe ISD (other): math 57% / reading 57% proficiency, ranked #69 of 826 in TX (top 8%) — acceptable for families but not a draw, mixed tenant base, ~2y average lease.
- Zoned schools: San Jacinto El (math 35% / reading 37%, grade F, #1,921 of 4,322 statewide, top 45%, 547 students, 81% FRL); Moorhead J H (math 35% / reading 42%, grade F, #704 of 1,662 statewide, top 43%, 1,391 students, 82% FRL); Conroe H S (math 32% / reading 51%, grade F, #767 of 1,632 statewide, top 47%, 4,915 students, 61% FRL) — zoned schools average 75% FRL vs 34% district-wide (40 pts higher); higher-poverty schools than district average — tighter screening recommended.
- Zoned-school proficiency averages 39% at this address vs 57% district-wide (-18 pts) — the specific schools serving this property underperform the Conroe ISD average; the district grade overstates school quality for this exact location.
- Market conditions: Rents rising (+3.3%/yr); 1117 active listings in the ZIP; 3 comparable units currently listed for rent nearby; rentals lingering (median 46d on market — plan ~5-8 weeks vacancy on turnover, expect pricing pressure); 67% of comp listings sitting > 30 days — soft ceiling on asking rent; solid renter incomes; 13,259 units permitted in Montgomery County in 2024 (1,402 in 5+ unit buildings).
- This rent runs 35% of the median local income ($85k/yr) — at the standard rent-burdened threshold; future hikes will face affordability resistance.
Forward outlook
- Local home prices are declining (-3.0%/yr); year-one equity from $2k of loan paydown is wiped out by about $9k of value loss. Plan a longer hold.
- Montgomery County population projected at +65% by 2050 — long-run rental-demand tailwind backs the buy-and-hold thesis.
Negotiation context
- It's been on market 473 days — a 12% lower offer ($252k) is reasonable based on typical stale-listing flexibility.
Questions for the listing agent
- What do current leases actually rent for vs. the listed asking? Can we see a recent rent roll and the last 12 months of T-12 income?
- It's been on market 473 days. Have you received any prior offers? Is the seller open to a 13% concession, seller financing, or rate buy-down credit?
- Why hasn't it sold? Are there any deal-killer items the seller is aware of (foundation, flood, title, zoning, code violations)?
- Is there a deadline driving the sale (1031 exchange, divorce, estate, relocation)? That informs how much negotiation room exists.
- The area grade is low — what's the realistic commute time and amenity access for the typical tenant pool here? Any planned neighborhood developments (good or bad) we should know about?
- What's the average days-on-market for RENTAL listings here right now (not sales)? A rising rental-DOM trend means longer vacancies and softer asking-rent achievability than the comps imply.
- What's the recent tenant-quality profile in this submarket — average credit score on applications, eviction rate, late-payment / NSF rate, and stable-employment percentage? A property-management company in the area should have these aggregated.
- How much new for-sale + rental construction is in the pipeline within 1–3 miles? Heavy new supply typically softens prices + rents 12–24 months out; constrained supply supports both.
Investment metrics
- 1% rule
- 0.84% ✗
- Cap rate
- 5.96%
- Cash-on-cash
- -1.18%
- DSCR
- 0.95
- GRM
- 9.9
CMA / ARV
- ARV (median comp)
- $295,479
- List price
- $285,990
- Delta
- -3.21%
- Verdict
- FAIR
- Comps
- 20 within 1.0 mi
Show comp detail 12 sales within ~0.75 mi
| Address | Dist | Beds/Ba | Sqft | Sold | Price | $/sf | Match |
|---|---|---|---|---|---|---|---|
| 16156 Sepia Manor St | 0.00mi | 4/2.5 | 2,218 (0%) | 2mo | $289,250 | $130 | 99 |
| 15026 English Rose Rd | 0.00mi | 4/2.5 | 2,218 (0%) | 2mo | $305,440 | $138 | 98 |
| 16177 Sepia Manor St | 0.00mi | 4/2.5 | 2,218 (0%) | 2mo | $294,410 | $133 | 98 |
| 16124 Sepia Manor St | 0.00mi | 4/3.0 | 2,036 (-8%) | 3mo | $297,470 | $146 | 82 |
| 14463 Cardinal Forest Dr | 0.35mi | 4/3.0 | 2,150 (-3%) | 7mo | $299,000 | $139 | 71 |
| 17114 Mystic River Ln | 0.65mi | 4/3.0 | 2,267 (+2%) | 3mo | $309,000 | $136 | 62 |
| 16022 Tangled Vine Ln | 0.54mi | 4/3.0 | 2,360 (+6%) | 0mo | $345,000 | $146 | 62 |
| 15632 Boulder Lake Ln | 0.62mi | 4/3.0 | 2,028 (-9%) | 2mo | $338,180 | $167 | 53 |
| 14574 Clementine Hall Dr | 0.56mi | 4/3.5 | 2,392 (+8%) | 4mo | $358,330 | $150 | 53 |
| 15835 Dove Hollow Dr | 0.35mi | 3/2.0 (-1) | 1,940 (-12%) | 4mo | $335,000 | $173 | 52 |
| 14948 Scarlet Branch Dr | 0.71mi | 4/2.5 | 2,350 (+6%) | 6mo | $350,000 | $149 | 52 |
| 14601 Clementine Hall Dr | 0.62mi | 4/3.5 | 2,392 (+8%) | 6mo | $349,990 | $146 | 49 |
Match score weights: distance 35% · size 25% · config 20% · recency 20%. Top-matched comps best support the ARV.
Projected returns pro-forma
-3.0% appreciation · 3.3% rent growth · sell at horizon
- IRR
- -17.9%
- Equity multiple
- 0.37×
- Total profit
- $-52,275
- Equity at exit
- $44,057
- IRR
- -9.5%
- Equity multiple
- 0.41×
- Total profit
- $-48,941
- Equity at exit
- $25,548
Cash invested: $82,734 (down + closing). Projections, not guarantees.
Landlord ↔ Tenant lean methodology
- Overall (STATE)
- 87 Strongly Landlord-Friendly
- State Texas
- 87 Strongly Landlord-Friendly · R+5
- County
- — inherits STATE
- City
- — inherits STATE
ZIP-level market 77302
- Rents YoY
- 3.3%
- Active inventory
- 1117
- Price-to-rent
- 9.6×
Monthly cashflow live
- Estimated rent
- $2,482 medium interval (Pro) →
- Mortgage (P&I)
- −$1,550
- Tax est. 1.5%
- −$369 /mo · $4,432/yr
- Insurance
- −$123
- HOA
- −$0
- Vacancy / Maint / Mgmt
- −$521
- Net cashflow
- $-81
Break-even live
Sensitivity live
| Price | -10% $123 | -5% $21 | +0% $-81 | +5% $-183 | +10% $-286 |
|---|---|---|---|---|---|
| Rent | -10% $-277 | -5% $-179 | +0% $-81 | +5% $17 | +10% $115 |
| Rate | -1.0pp $67 | -0.5pp $-6 | base $-81 | +0.5pp $-158 | +1.0pp $-236 |
UW: 25.0% down · 7.5% · 30yr · 1.5% tax · 5.0% vac · 8.0% maint · 8.0% mgmt
Financing live
Cash to close
- Down payment
- $73,870
- Closing costs
- $8,864
- Reserves months
- —
- Total cash needed
- —
Loan-product check · same deal, 3 products live
Conventional
25% down · 7.5% · 30yr
- Down + closing
- —
- Monthly P&I
- —
- Monthly cashflow
- —
- DSCR
- —
- Eligible?
- —
Personal DTI + credit; lowest rate.
DSCR
20% down · 8.5% · 30yr
- Down + closing
- —
- Monthly P&I
- —
- Monthly cashflow
- —
- DSCR
- —
- Eligible?
- —
No personal income docs; deal must DSCR.
Hard money
10% down · 12.0% · 12mo
- Down + closing
- —
- Monthly P&I
- —
- Monthly cashflow
- —
- DSCR
- —
- Eligible?
- —
Short-term bridge; refi at stabilization.
Rent comps 3 comps
| Address | Beds | Baths | Sqft | Rent | $/sqft | DOM | Units | Dist |
|---|---|---|---|---|---|---|---|---|
| 16350 Many Trees Ln Conroe, TX | 3.0 | 2.0 | 1550 | $1,500 | $0.97 | 26d | 1 | 1.07mi |
| 15447 Dapple Bluff Ln Conroe, TX | 4.0 | 2.5 | 2265 | $2,900 | $1.28 | 46d | 1 | 1.11mi |
| 16393 Many Trees Ln Conroe, TX | 3.0 | 2.0 | 1540 | $1,795 | $1.17 | 46d | 1 | 1.18mi |
Listing history 15 events
-
2026-06-21days on market $285,990 Active 473 DOM
-
2026-06-18days on market $285,990 Active 470 DOM
-
2026-06-17days on market $285,990 Active 469 DOM
-
2026-06-16days on market $285,990 Active 468 DOM
-
2026-06-15days on market $285,990 Active 467 DOM
-
2026-06-13days on market $285,990 Active 465 DOM
-
2026-06-09days on market $285,990 Active 461 DOM
-
2026-06-08days on market $285,990 Active 460 DOM
-
2026-06-07days on market $285,990 Active 459 DOM
-
2026-06-04days on market $285,990 Active 456 DOM
-
2026-06-03days on market $285,990 Active 455 DOM
-
2026-06-02days on market $285,990 Active 454 DOM
-
2026-06-01days on market $285,990 Active 453 DOM
-
2026-05-31days on market $285,990 Active 452 DOM
-
2025-03-06$285,990 Active 373-char remark
Show marketing remark (373 chars)
A two-story foyer greets you as you enter the dual-level Fentress, and flows seamlessly through to the kitchen with an island, café, and expansive gathering room. Retreat to the private owner's suite on the first floor featuring an oversized walk-in closet. Three secondary bedrooms plus loft space provide plenty of space to relax and unwind and complete this home.
ⓘ Source: listings_history table (triggers on properties + properties_extension) + one-shot
backfill from property_details.listing_events for pre-trigger history.
Nearby sold comps map
Loading sold comps map…
Walkable amenities ~0.75 mi
Loading nearby amenities…
Taxation est. · year 1
- Rental income
- $29,781
- − Mortgage interest
- −$16,551
- − Property taxes
- −$4,432
- − Insurance
- −$1,477
- − Repairs & maintenance
- −$2,382
- − Management
- −$2,382
- − Depreciation
- −$8,596
- Taxable loss
- −$6,041
- Est. tax savings @ 24.0%
- +$1,450
- After-tax cash flow
- $473/yr
For passive investors: Depreciation is non-cash, so a rental often shows a tax loss while cash-flowing — sheltering income. Rental losses are passive: they offset passive income freely, and up to $25,000/yr can offset ordinary (W-2) income if you actively participate and your MAGI is under $100k (phasing out to $0 by $150k); unused losses carry forward. On sale, claimed depreciation is recaptured at up to 25%, and gains may owe capital-gains tax (a 1031 exchange can defer both). Figures are a year-1 estimate at your 24.0% rate — not tax advice; consult a CPA.
Condition & rehab AI · 12 photos
This home is in excellent condition with no visible repairs needed. It offers a modern and well-maintained interior with a spacious kitchen and bathrooms. The exterior is in good condition, and the home is move-in ready with a high curb appeal.
Value-add opportunities
- Both Painting exterior and interior walls — Fresh paint enhances curb appeal and interior aesthetics
- Both Replace light fixtures with energy-efficient LED lights — Energy-efficient lighting reduces utility costs and enhances home's appeal
- Both Install smart home automation system — Smart home technology improves convenience and energy efficiency
Renovation cost estimate screening
Value-add ROI direction
- Both Painting exterior and interior walls — Fresh paint enhances curb appeal and interior aesthetics ↑
- Both Replace light fixtures with energy-efficient LED lights — Energy-efficient lighting reduces utility costs and enhances home's appeal ↑
- Both Install smart home automation system — Smart home technology improves convenience and energy efficiency ↑
ⓘ Cost ranges are severity-bucket heuristics (US national rule-of-thumb). Get contractor quotes + a written scope before underwriting a rehab budget.
Schools (NCES district)
- District
- Conroe ISD
- NCES district ID
- 4815000
- Math proficiency
- 57% ▼ -6.00%
- Reading proficiency
- 57% ▼ -1.00%
- Median HH income
- $71,541
- Composite
- 50.65/100
- National rank
- #1833
- State rank
- #69 of 826 in TX
Livability — Grangerland
No livability data for this city. (Only ~50 U.S. cities are tracked.)
Census & demographics
- County
- Montgomery County · 663,713 people
- City population
- 205,417
- Metro
- Houston-The Woodlands-Sugar Land, TX
- Population (ZIP)
- 21,546
- Household income
- $84,673
- Rent vs Own
- Severe rent burden
- 205.0
Population outlook (Montgomery County) Hauer SSP2
- Today (2025)
- 713,896 people
- By 2030
- 805,263 · +12.8%
- By 2040
- 992,708 · +39.1%
- By 2050
- 1,179,590 · +65.2%
- By 2075
- 1,628,084 · +128.1%
- By 2100
- 1,937,880 · +171.5%
Race, ethnicity, and origin ACS 2023
- Neighborhood character
- Majority White (63%)
- Race & ethnicity
- White 63% Hispanic / Latino 29% Two or more races 19% Black 3% Asian 1%
- Hispanic origin (detail)
- Mexican 26% Puerto Rican 1%
- Common ancestry
- Lithuanian 3% Italian 2% Slovak 2%
- Foreign-born
- 13% · Canada, Vietnam, China
- Languages at home
- 78% English-only · Spanish 20% Russian/Polish/Slavic 1% Other Indo-European 0%
Political lean MEDSL · Montgomery
- 2024 margin
- Solid R (+45.5) · D 26.8% · R 72.3%
- 2008→2024 swing
- +7.2pp toward D · 2008: -52.7pp · 2024: -45.5pp
- All cycles
- 2024: R+45.5 2020: R+43.8 2016: R+51.4 2012: R+60.7 2008: R+52.7
Not yet ingested
- Civics
- —
Market trends
- HPI YoY
- ▼ -187.56%
- Current HPI
- 262.1879
- Rent YoY
- ▲ 3.30%
- Metro
- Houston-The Woodlands-Sugar Land, TX
- State GDP YoY
- ▲ 3.95%
- F500 in state
- 110
Industry mix (Fortune 500 HQ in TX)
| Industry | F500 HQs | Revenue |
|---|---|---|
| Energy | 16 | $1,198B |
|
||
| Technology | 5 | $198B |
|
||
| Engineering / Construction | 4 | $72B |
|
||
| Energy Services | 3 | $60B |
|
||
| Utilities | 3 | $41B |
|
||
| Healthcare | 2 | $330B |
|
||
Price history
1 event — show timeline
- 2025-03-06 Listed $285,990 Zillow
Cash-flow waterfall
monthlySold comps — $/sqft
last 12 mo · ≤1 miLoading sold comps…