 🏢 Co-op
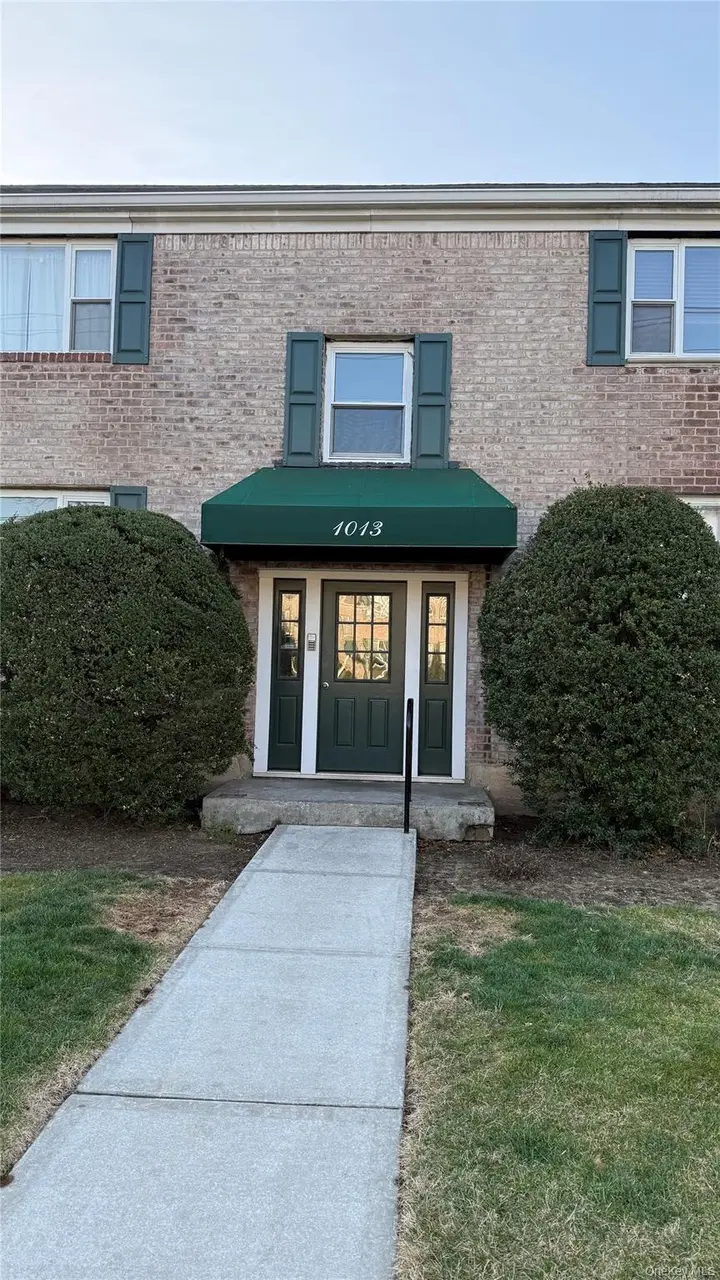
1013 Rottkamp St #1 · North Valley Stream, NY
Flood risk 7/10 · Major
- FEMA flood zone
- X (unshaded)
- Chance of flooding over 30 yrs
- 0.78%
- Est. flood insurance / yr
- $473 – $860
Fire risk 1/10 · Minimal
- Est. fire insurance / yr
- $691 – $1,283
Heat risk 6/10 · Moderate
- Hot days now (above 97°F)
- 7 days/yr
- Hot days in 30 yrs
- 16 days/yr
Wind risk 6/10 · Moderate
- Chance of severe wind over 30 yrs
- 54.0%
Air-quality risk 3/10 · Minor
- Unhealthy air days now
- 4 days/yr
- Unhealthy air days in 30 yrs
- 4 days/yr
Risk factors via First Street. Map © Google.
Why this score? — see what drove the D grade
The composite is a weighted blend of 9 inputs, each scored 0–100. Each bar is that input's sub-score; the figure is the points it added to the 100-point composite (weight × sub-score).
- Cash flow +11.5/30.0
- ARV discount +7.5/15.0
- Schools +7.2/10.0
- Livability +4.0/5.0
- DSCR +3.4/10.0
- 1% rule +3.3/10.0
- Rent growth +3.0/5.0
- Condition / age +2.2/5.0
- Appreciation +0.0/10.0
$264,900
🖨 Deal sheet 📄 Offer letter ✓ Due diligence
Listing remarks
Pristine Valley Park Estates -- 18 acres of tree-lined park-like settings. 2 on-site laundry rooms. Lower one bedroom, Nestled on Treeline block. Close To Schools, Parkways, and Shopping. Co-op Board requires: minimum 20% down, credit score 700, Income requirement—Maint. & Mortgage not exceed 35% Pet-Friendly Property--1 dog under 35lbs permitted. Monthly maintenance includes heat, hot water, real estate taxes, and common area upkeep.
Key facts
- Close to schools
- Garage
- Built 1959
Tags
Property features AI
Finance
- HOA & community: Association: Valley Park Estates Owners Corp.; Additional board purchase/application fee: $1,000
Exterior
- Parking: Garage; Off-street parking; Parking lot; Private parking; Waitlist for parking
- Utilities: Public sewer; Cable available; Natural gas available and connected
- Home design: Stock cooperative; One-level unit (entry level 1); Two-story building
- Construction: Brick construction
- Exterior features: Brick exterior; Not on waterfront; Measured living area
Interior
- Kitchen: Dishwasher; Gas range; Microwave; Refrigerator
- Bedrooms: Includes a first-floor bedroom
- Flooring: Hardwood floors
- Bathrooms: One full bathroom
- Heating & cooling: Hot water heating; Wall/window air conditioning units
- Interior features: First-floor bedroom; First-floor full bath; No basement; No attic; 3 total rooms; 2 stories (unit occupies one level); Entry level: 1; Pets allowed with size limit
- Laundry & utility: Washer; Common area laundry
Neighborhood map
What this means for you Summary
Snapshot
- This is a 1-bed/1.0-bath condo listed at $265k. Condition is rated fair.
Deal economics
- At list price, monthly cash flow is $-142 ($-2k/yr) — negative.
- To cash-flow at today's rent, offer at most $244k (7.8% below list).
- To meet the 1% rule (rent ≥ 1% of price), the offer needs to be $221k (16.7% below list).
- Recommended offer: $221k (16.7% below list) — sets the bar for 1% rule.
- Cap rate 5.9% vs local median 2.5% in North Valley Stream — top-decile yield for the area; either an underpriced asset or a hidden risk that comps aren't pricing in. Stress-test before assuming the spread holds.
Location & tenants
- Location reads 80/100 on livability (#120 in NY, #1,949 nationally) — a professional / high-income tenant draw. Strengths: commute A+, employment A+, housing A+; Watch: amenities F, cost of living F.
- Sewanhaka Central High School District (suburban): math 76% / reading 83% proficiency, ranked #43 of 590 in NY (top 7%) — strong family-tenant draw, lease renewals of 3-5y typical; only 19% free/reduced lunch — higher-income household profile.
- Zoned schools: Elmont Memorial High School (math 81% / reading 83%, grade A, #452 of 1,100 statewide, top 44%, 1,501 students, 48% FRL) — zoned schools average 48% FRL vs 19% district-wide (29 pts higher); higher-poverty schools than district average — tighter screening recommended.
- Market conditions: Rents rising (+1.9%/yr); 172 active listings in the ZIP; 1 comparable units currently listed for rent nearby; high-income renter base; 824 units permitted in Nassau County in 2024 (153 in 5+ unit buildings).
Forward outlook
- Local home prices are declining (-3.0%/yr); year-one equity from $2k of loan paydown is wiped out by about $8k of value loss. Plan a longer hold.
- Nassau County population projected at +7% by 2050 — modest demand growth; plan on rents tracking national, not racing it.
Negotiation context
- It's been on market 64 days — a 6% lower offer ($249k) is reasonable based on typical stale-listing flexibility.
- 2 sale attempts with the ask held roughly flat each time — persistent listings suggest the price (not the market) is what's stuck; bring a comps-based counter.
Risks & watch-outs
- Watch-outs: flood insurance adds $56/mo; built in 1959 — expect roof / HVAC / electrical / plumbing capex.
- Climate carrying-cost: major flood risk; major wind risk, 54% chance of damaging wind over 30y; extreme-heat days projected 7→16/yr by 2055 (HVAC capex compounding) — expect insurance premiums to compound above CPI over the hold.
Questions for the listing agent
- What do current leases actually rent for vs. the listed asking? Can we see a recent rent roll and the last 12 months of T-12 income?
- It's been on market 64 days. Have you received any prior offers? Is the seller open to a 17% concession, seller financing, or rate buy-down credit?
- Have any recent inspections been done? Can we get a copy of the seller's disclosures and any deferred-maintenance estimates?
- Built in 1959 — when were the roof, HVAC, electrical panel, plumbing, and water heater last replaced?
- What's the actual annual flood-insurance premium (NFIP or private), and is the property in a SFHA with mandatory coverage?
- Any open or pending special assessments — roof, HVAC, plumbing, elevator, façade? What's the per-unit balance and payoff schedule, and is the seller paying it off at close or rolling it to the buyer?
- Why hasn't it sold? Are there any deal-killer items the seller is aware of (foundation, flood, title, zoning, code violations)?
- Is there a deadline driving the sale (1031 exchange, divorce, estate, relocation)? That informs how much negotiation room exists.
- Schools are B-rated — typically a magnet for longer-tenancy family renters. What's the average tenant stay here, and is there a school-zone premium baked into asking?
- The area grade is low — what's the realistic commute time and amenity access for the typical tenant pool here? Any planned neighborhood developments (good or bad) we should know about?
- What's the average days-on-market for RENTAL listings here right now (not sales)? A rising rental-DOM trend means longer vacancies and softer asking-rent achievability than the comps imply.
- What's the recent tenant-quality profile in this submarket — average credit score on applications, eviction rate, late-payment / NSF rate, and stable-employment percentage? A property-management company in the area should have these aggregated.
- How much new apartment / multifamily construction is in the pipeline within 1–3 miles? Heavy new supply (>2% of stock underway) typically softens rents 12–24 months out; light construction supports rent growth.
Investment metrics
- 1% rule
- 0.83% ✗
- Cap rate
- 5.90%
- Cash-on-cash
- -1.41%
- DSCR
- 0.94
- GRM
- 10.0
CMA / ARV
No comps found within radius.
Projected returns pro-forma
-3.0% appreciation · 1.86% rent growth · sell at horizon
- IRR
- -21.4%
- Equity multiple
- 0.27×
- Total profit
- $-54,436
- Equity at exit
- $39,497
- IRR
- -18.0%
- Equity multiple
- 0.07×
- Total profit
- $-68,853
- Equity at exit
- $22,904
Cash invested: $74,172 (down + closing). Projections, not guarantees.
Landlord ↔ Tenant lean methodology
- Overall (STATE)
- 15 Strongly Tenant-Friendly
- State New York
- 15 Strongly Tenant-Friendly · D+10
- County
- — inherits STATE
- City
- — inherits STATE
ZIP-level market 11580
- Rents YoY
- 1.9%
- Active inventory
- 172
- Price-to-rent
- 10.0×
Monthly cashflow live
- Estimated rent
- $2,207 medium interval (Pro) →
- Mortgage (P&I)
- −$1,389
- Tax est. 1.5%
- −$331 /mo · $3,974/yr
- Insurance
- −$110
- Flood insurance flood zone
- −$56 /mo · $666/yr
- HOA
- −$0
- Vacancy / Maint / Mgmt
- −$464
- Net cashflow
- $-142
Break-even live
UW: 25.0% down · 7.5% · 30yr · 1.5% tax · 5.0% vac · 8.0% maint · 8.0% mgmt
Financing live
Cash to close
- Down payment
- $66,225
- Closing costs
- $7,947
- Reserves months
- —
- Total cash needed
- —
Loan-product check · same deal, 3 products live
Conventional
25% down · 7.5% · 30yr
- Down + closing
- —
- Monthly P&I
- —
- Monthly cashflow
- —
- DSCR
- —
- Eligible?
- —
Personal DTI + credit; lowest rate.
DSCR
20% down · 8.5% · 30yr
- Down + closing
- —
- Monthly P&I
- —
- Monthly cashflow
- —
- DSCR
- —
- Eligible?
- —
No personal income docs; deal must DSCR.
Hard money
10% down · 12.0% · 12mo
- Down + closing
- —
- Monthly P&I
- —
- Monthly cashflow
- —
- DSCR
- —
- Eligible?
- —
Short-term bridge; refi at stabilization.
Rent comps 1 comps
| Address | Beds | Baths | Sqft | Rent | $/sqft | DOM | Units | Dist |
|---|---|---|---|---|---|---|---|---|
| 1003 Rottkamp St #1 Valley Stream, NY | 1.0 | 1.0 | 550 | $2,400 | $4.36 | 1d | 1 | 0.06mi |
HOA detail condo
- Monthly dues
- $0 · $0/yr
- Likely covers
- water
- Assessments
- None detected in remarks — confirm with the listing agent.
Listing history 14 events
-
2026-06-18days on market $264,900 Active 64 DOM
-
2026-06-17days on market $264,900 Active 63 DOM
-
2026-06-16days on market $264,900 Active 62 DOM
-
2026-06-15days on market $264,900 Active 61 DOM
-
2026-06-13days on market $264,900 Active 59 DOM
-
2026-06-13days on market $264,900 Active 58 DOM
-
2026-06-09days on market $264,900 Active 55 DOM
-
2026-06-08days on market $264,900 Active 54 DOM
-
2026-06-07days on market $264,900 Active 53 DOM
-
2026-06-04days on market $264,900 Active 50 DOM
-
2026-06-03days on market $264,900 Active 49 DOM
-
2026-06-02days on market $264,900 Active 48 DOM
-
2026-06-01days on market $264,900 Active 47 DOM
-
2026-05-31days on market $264,900 Active 46 DOM
ⓘ Source: listings_history table (triggers on properties + properties_extension) + one-shot
backfill from property_details.listing_events for pre-trigger history.
Climate risk First Street
- Flood 7/10 Severe FEMA zone X (unshaded) · 78% chance over 30 yrs
- Wildfire 1/10 Low
- Heat 6/10 Major 7 d/yr ≥97°F today · 16 d/yr by 30 yrs out
- Wind 6/10 Major 54% chance of damaging wind over 30 yrs
- Air quality 3/10 Moderate 4 unhealthy d/yr today · 4 by 30 yrs out
Nearby sold comps map
Loading sold comps map…
Walkable amenities ~0.75 mi
Loading nearby amenities…
Taxation est. · year 1
- Rental income
- $26,487
- − Mortgage interest
- −$14,839
- − Property taxes
- −$3,974
- − Insurance
- −$1,991
- − Repairs & maintenance
- −$2,119
- − Management
- −$2,119
- − Depreciation
- −$7,706
- Taxable loss
- −$6,260
- Est. tax savings @ 24.0%
- +$1,502
- After-tax cash flow
- $-207/yr
For passive investors: Depreciation is non-cash, so a rental often shows a tax loss while cash-flowing — sheltering income. Rental losses are passive: they offset passive income freely, and up to $25,000/yr can offset ordinary (W-2) income if you actively participate and your MAGI is under $100k (phasing out to $0 by $150k); unused losses carry forward. On sale, claimed depreciation is recaptured at up to 25%, and gains may owe capital-gains tax (a 1031 exchange can defer both). Figures are a year-1 estimate at your 24.0% rate — not tax advice; consult a CPA.
Condition & rehab AI · 5 photos
This condo presents as a good investment opportunity with cosmetic updates needed to enhance its curb appeal and interior aesthetics.
Repairs flagged
- Minor kitchen cabinets — Worn and dated appearance
- Minor kitchen countertops — Standard, possibly dated material
Value-add opportunities
- Both Paint interior walls — Fresh paint enhances curb appeal and interior aesthetics
- Both Replace kitchen cabinets and countertops — Modernizing the kitchen boosts both resale and rental value
Renovation cost estimate screening
| Repair item | Severity | Est. cost |
|---|---|---|
| kitchen cabinets · Worn and dated appearance | Minor | $500–3,000 |
| kitchen countertops · Standard, possibly dated material | Minor | $500–3,000 |
| Total estimated repair cost · 2 items | $1,000–6,000 |
Value-add ROI direction
- Both Paint interior walls — Fresh paint enhances curb appeal and interior aesthetics ↑
- Both Replace kitchen cabinets and countertops — Modernizing the kitchen boosts both resale and rental value ↑
ⓘ Cost ranges are severity-bucket heuristics (US national rule-of-thumb). Get contractor quotes + a written scope before underwriting a rehab budget.
Schools (NCES district)
- District
- Sewanhaka Central High School District
- NCES district ID
- 3626520
- Math proficiency
- 76% ▬ 0.00%
- Reading proficiency
- 83% ▲ 9.00%
- Median HH income
- $95,771
- Composite
- 71.6/100
- National rank
- #220
- State rank
- #43 of 590 in NY
Livability — North Valley Stream
- Score
- 80/100
- State rank
- #120
- US rank
- #1949
Category grades
Schools grade is shown separately in the Schools card above.
Census & demographics
- Census place
- North Valley Stream, NY
- County
- Nassau County · 653,051 people
- Metro
- New York-Newark-Jersey City, NY-NJ-PA
- Population (ZIP)
- 43,092
- Household income
- $137,402
- Rent vs Own
- Severe rent burden
- 644.0
Population outlook (Nassau County) Hauer SSP2
- Today (2025)
- 1,409,302 people
- By 2030
- 1,431,482 · +1.6%
- By 2040
- 1,471,607 · +4.4%
- By 2050
- 1,502,845 · +6.6%
- By 2075
- 1,575,403 · +11.8%
- By 2100
- 1,554,356 · +10.3%
Race, ethnicity, and origin ACS 2023
- Neighborhood character
- Highly diverse neighborhood (Simpson 0.78)
- Race & ethnicity
- Black 28% Hispanic / Latino 27% White 20% Asian 17% Two or more races 14%
- Hispanic origin (detail)
- Puerto Rican 4% Dominican 4%
- Common ancestry
- Hispanic 6% Romanian 1% Scotch-Irish 1%
- Foreign-born
- 37% · Canada, Jamaica, China
- Languages at home
- 57% English-only · Spanish 19% Other Indo-European 9% French/Haitian/Cajun 6%
Political lean MEDSL · Nassau
- 2024 margin
- Toss-up / Even · D 47.9% · R 52.1%
- 2008→2024 swing
- -12.6pp toward R · 2008: 8.4pp · 2024: -4.2pp
- All cycles
- 2024: R+4.2 2020: D+9.5 2016: D+5.3 2012: D+6.7 2008: D+8.4
Not yet ingested
- Civics
- —
Market trends
- HPI YoY
- ▼ -713.98%
- Current HPI
- 315.4096
- Rent YoY
- ▲ 1.86%
- Metro
- New York-Newark-Jersey City, NY-NJ-PA
- State GDP YoY
- ▲ 2.60%
- F500 in state
- 92
Industry mix (Fortune 500 HQ in NY)
| Industry | F500 HQs | Revenue |
|---|---|---|
| Financial Services | 10 | $950B |
|
||
| Consumer Goods | 9 | $162B |
|
||
| Insurance | 4 | $225B |
|
||
| Telecommunications | 2 | $144B |
|
||
| Pharmaceuticals | 2 | $112B |
|
||
| Media / Entertainment | 2 | $69B |
|
||
Price history
-1.9% since first listed3 events — show timeline
- 2026-05-25 Price Changed $264,900 OneKey® MLS as Distributed by MLS Grid
- 2026-05-25 Relisted — OneKey® MLS as Distributed by MLS Grid
- 2026-04-09 Listed $269,900 OneKey® MLS as Distributed by MLS Grid
Cash-flow waterfall
monthlySold comps — $/sqft
last 12 mo · ≤1 miLoading sold comps…