 Multi-family
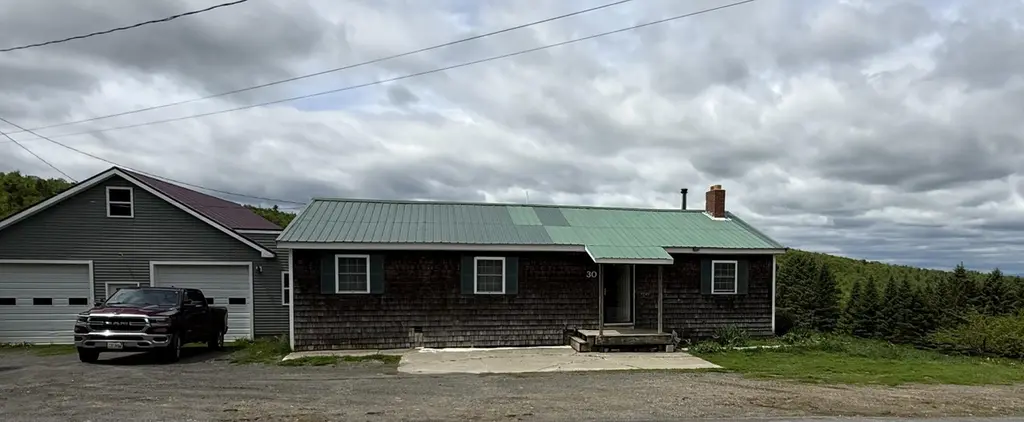
30 Moosehead Trl · Dixmont, ME
Flood risk No data
- FEMA flood zone
- —
- Chance of flooding over 30 yrs
- —
- Est. flood insurance / yr
- —
Fire risk No data
- Est. fire insurance / yr
- —
Heat risk No data
- Hot days now (above threshold)
- —
- Hot days in 30 yrs
- —
Wind risk No data
- Chance of severe wind over 30 yrs
- —
Air-quality risk No data
- Unhealthy air days now
- —
- Unhealthy air days in 30 yrs
- —
Risk factors via First Street. Map © Google.
Why this score? — see what drove the C+ grade
The composite is a weighted blend of 9 inputs, each scored 0–100. Each bar is that input's sub-score; the figure is the points it added to the 100-point composite (weight × sub-score).
- Cash flow +22.1/30.0
- ARV discount +7.5/15.0
- Appreciation +7.2/10.0
- DSCR +7.1/10.0
- Schools +6.4/10.0
- 1% rule +5.2/10.0
- Rent growth +2.5/5.0
- Livability +2.5/5.0
- Condition / age +2.5/5.0
$275,000
🖨 Deal sheet (PDF) 📄 Offer letter ✓ Due diligence
Multi-family units
County records classify this as Multi-Family (2-4 Unit). Listing-text estimate: 1 unit. estimate disagrees with records
Listing remarks
Priced to Sell !! This spacious Ranch 3 bedroom, 1 bathroom home with a full basement sits on 8+ acres with gorgeous views of fields, woods, enjoy your own plum trees, a pear tree and lots of wild apple trees. The westerly view from the 11 x 33 enclosed porch is fantastic and makes a nice room to watch the sunset. The 30x40 two bay garage is nearly new and has plenty of room for all your toys and equipment with extra storage upstairs. Whether you just want to escape suburbia or start a homestead, this is a great property for anyone. Some cosmetics are needed for your finishing touches. Home is being sold as is- As the Seller is disabled and cannot do any repairs.
Key facts
- Full basement
- Enclosed porch
- Two bay garage
Tags
Property features AI
Finance
- HOA & community: No pet restrictions
Exterior
- Parking: Attached 2-car garage; Gravel parking with 1–4 spaces
- Utilities: Private well water; Private sewer (septic tank); Electric service with circuit breakers; Electric water heater
- Home design: Single family residence; Built in 1985
- Construction: Wood frame construction with shingle and vinyl siding; Metal roof; Full unfinished walk-out basement with interior entry
- Exterior features: Glassed-in porch; Rural, level, wooded lot; Paved road access
Interior
- Kitchen: Kitchen on the first floor
- Bedrooms: Bedroom 1 on the first floor; Bedroom 2 on the first floor; Bedroom 3 on the first floor
- Flooring: Carpet; Laminate; Wood
- Bathrooms: One full bathroom
- Heating & cooling: Forced air heating
- Interior features: Six total rooms; 1st-floor bedroom; Unfurnished
- Laundry & utility: Laundry located on the main level
Neighborhood map
What this means for you Summary
Snapshot
- This is a 3-bed/1.0-bath multifamily listed at $275k.
Deal economics
- At list price, monthly cash flow is $442 ($5k/yr) — positive.
- The deal already cash-flows at list — no discount required.
- Meets the 1% rule at list price ($3k rent vs $275k).
- Recommended offer: $271k (1.5% below list) — sets the bar for market timing.
Location & tenants
- Location reads: area grade C — affects rentability + tenant quality, not the cash-flow math above.
- RSU 19 (rural): math 73% / reading 81% proficiency, ranked #96 of 112 in ME (top 86%) — strong family-tenant draw, lease renewals of 3-5y typical.
- Zoned schools: Nokomis Regional Middle School (math 68% / reading 79%, grade A, #79 of 85 statewide, top 95%, 544 students, 45% FRL); Nokomis Regional High School (math 87% / reading 92%, grade A+, #56 of 108 statewide, top 60%, 634 students, 41% FRL).
- Market conditions: 11 active listings in the ZIP; 440 units permitted in Penobscot County in 2024 (40 in 5+ unit buildings).
Forward outlook
- In year one you build about $14k of equity ($2k loan paydown + $12k appreciation (4.5% local appreciation)).
- Penobscot County population projected at -17% by 2050 — secular population decline; favor cash flow + early exit over multi-decade hold.
- At projected returns (4.5% appreciation + 3.0% rent growth), your $77k cash investment doubles in ~4 years — after that, you're playing with house money.
- By year 3, paydown + projected appreciation supports a ~$35k cash-out refi (75% LTV) — recoverable capital for the next deal without selling this one.
Negotiation context
- It's been on market 20 days — a 2% lower offer ($271k) is reasonable based on typical stale-listing flexibility.
- 2 sale attempts since 4y ago with the ask held roughly flat each time — persistent listings suggest the price (not the market) is what's stuck; bring a comps-based counter.
Questions for the listing agent
- Is there a deadline driving the sale (1031 exchange, divorce, estate, relocation)? That informs how much negotiation room exists.
- What's the average days-on-market for RENTAL listings here right now (not sales)? A rising rental-DOM trend means longer vacancies and softer asking-rent achievability than the comps imply.
- What's the recent tenant-quality profile in this submarket — average credit score on applications, eviction rate, late-payment / NSF rate, and stable-employment percentage? A property-management company in the area should have these aggregated.
- How much new apartment / multifamily construction is in the pipeline within 1–3 miles? Heavy new supply (>2% of stock underway) typically softens rents 12–24 months out; light construction supports rent growth.
Investment metrics
- 1% rule
- 1.02% ✓
- Cap rate
- 8.22%
- Cash-on-cash
- 6.89%
- DSCR
- 1.31
- GRM
- 8.2
CMA / ARV
No comps found within radius.
Projected returns pro-forma
4.48% appreciation · 3.0% rent growth · sell at horizon
- IRR
- 17.6%
- Equity multiple
- 2.08×
- Total profit
- $83,467
- Equity at exit
- $147,273
- IRR
- 18.0%
- Equity multiple
- 4.01×
- Total profit
- $231,983
- Equity at exit
- $247,358
Cash invested: $77,000 (down + closing). Projections, not guarantees.
Landlord ↔ Tenant lean methodology
- Overall (STATE)
- 41 Moderately Tenant-Leaning
- State Maine
- 41 Moderately Tenant-Leaning · D+2
- County
- — inherits STATE
- City
- — inherits STATE
ZIP-level market 04932
- Home prices YoY
- 3.1%
- Active inventory
- 11
- Price-to-rent
- 16.4×
Monthly cashflow live
- Estimated rent
- $2,798 medium interval (Pro) →
- Mortgage (P&I)
- −$1,442
- Tax from tax record
- −$211 /mo · $2,536/yr
- Insurance
- −$115
- HOA
- −$0
- Vacancy / Maint / Mgmt
- −$588
- Net cashflow
- $442
Break-even live
Sensitivity live
| Price | -10% $598 | -5% $520 | +0% $442 | +5% $365 | +10% $287 |
|---|---|---|---|---|---|
| Rent | -10% $221 | -5% $332 | +0% $442 | +5% $553 | +10% $663 |
| Rate | -1.0pp $581 | -0.5pp $512 | base $442 | +0.5pp $371 | +1.0pp $299 |
2-unit breakdown (identical units grouped — click to expand)
| Units | Beds | Baths | Est. rent |
|---|---|---|---|
| 2× units | 3 | 1 | $2,798 |
| #1 | 3 | 1 | $1,399 |
| #2 | 3 | 1 | $1,399 |
| Total (2 units) | $2,798 | ||
UW: 25.0% down · 7.5% · 30yr · 1.5% tax · 5.0% vac · 8.0% maint · 8.0% mgmt
Financing live
Cash to close
- Down payment
- $68,750
- Closing costs
- $8,250
- Reserves months
- —
- Total cash needed
- —
Loan-product check · same deal, 3 products live
Conventional
25% down · 7.5% · 30yr
- Down + closing
- —
- Monthly P&I
- —
- Monthly cashflow
- —
- DSCR
- —
- Eligible?
- —
Personal DTI + credit; lowest rate.
DSCR
20% down · 8.5% · 30yr
- Down + closing
- —
- Monthly P&I
- —
- Monthly cashflow
- —
- DSCR
- —
- Eligible?
- —
No personal income docs; deal must DSCR.
Hard money
10% down · 12.0% · 12mo
- Down + closing
- —
- Monthly P&I
- —
- Monthly cashflow
- —
- DSCR
- —
- Eligible?
- —
Short-term bridge; refi at stabilization.
Listing history 15 events
-
2026-06-21days on market $275,000 Active 20 DOM
-
2026-06-18days on market $275,000 Active 17 DOM
-
2026-06-17days on market $275,000 Active 16 DOM
-
2026-06-16days on market $275,000 Active 15 DOM
-
2026-06-15days on market $275,000 Active 14 DOM
-
2026-06-14days on market $275,000 Active 12 DOM
-
2026-06-13days on market $275,000 Active 11 DOM
-
2026-06-10days on market $275,000 Active 9 DOM
-
2026-06-09days on market $275,000 Active 8 DOM
-
2026-06-08days on market $275,000 Active 7 DOM
-
2026-06-07days on market $275,000 Active 6 DOM
-
2026-06-05days on market $275,000 Active 3 DOM
-
2026-06-03days on market $275,000 Active 2 DOM
-
2026-06-01remarks 671-char remark
-
2026-06-01$275,000 Active 1 DOM
ⓘ Source: listings_history table (triggers on properties + properties_extension) + one-shot
backfill from property_details.listing_events for pre-trigger history.
Tax reassessment forecast ME · Partial reset (capped growth)
- Current annual tax
- $2,536 · $211/mo
- Projected year-2 tax
- $3,138 · $262/mo
- Expected delta
- +$602/yr (+$50/mo · 23.7%)
ⓘ Screening estimate from a state-policy table — verify with the county assessor before closing.
Nearby sold comps map
Loading sold comps map…
Walkable amenities ~0.75 mi
Loading nearby amenities…
Taxation est. · year 1
- Rental income
- $33,576
- − Mortgage interest
- −$15,404
- − Property taxes
- −$2,536
- − Insurance
- −$1,375
- − Repairs & maintenance
- −$2,686
- − Management
- −$2,686
- − Depreciation
- −$8,000
- Taxable income
- $889
- Est. tax owed @ 24.0%
- −$213
- After-tax cash flow
- $5,095/yr
For passive investors: Depreciation is non-cash, so a rental often shows a tax loss while cash-flowing — sheltering income. Rental losses are passive: they offset passive income freely, and up to $25,000/yr can offset ordinary (W-2) income if you actively participate and your MAGI is under $100k (phasing out to $0 by $150k); unused losses carry forward. On sale, claimed depreciation is recaptured at up to 25%, and gains may owe capital-gains tax (a 1031 exchange can defer both). Figures are a year-1 estimate at your 24.0% rate — not tax advice; consult a CPA.
Schools (NCES district)
- District
- RSU 19
- NCES district ID
- 2314785
- Math proficiency
- 73% ▲ 53.00%
- Reading proficiency
- 81% ▲ 39.00%
- Median HH income
- $41,866
- Composite
- 64.37/100
- National rank
- #548
- State rank
- #96 of 112 in ME
Livability — Dixmont
No livability data for this city. (Only ~50 U.S. cities are tracked.)
Census & demographics
- Population (ZIP)
- 1,241
Population outlook (Penobscot County) Hauer SSP2
- Today (2025)
- 149,928 people
- By 2030
- 146,386 · -2.4%
- By 2040
- 135,952 · -9.3%
- By 2050
- 123,864 · -17.4%
- By 2075
- 97,825 · -34.8%
- By 2100
- 77,196 · -48.5%
Race, ethnicity, and origin ACS 2023
- Neighborhood character
- Predominantly White (95%)
- Race & ethnicity
- White 95% Two or more races 3%
- Common ancestry
- Lithuanian 14% Russian 5% Slovak 4%
- Foreign-born
- 3% · Canada
Political lean MEDSL · Penobscot
- 2024 margin
- R (+10.9) · D 43.6% · R 54.5% · Other 1.9%
- 2008→2024 swing
- -15.9pp toward R · 2008: 5.0pp · 2024: -10.9pp
- All cycles
- 2024: R+10.9 2020: R+8.3 2016: R+10.9 2012: D+2.9 2008: D+5.0
Not yet ingested
- Civics
- —
Market trends
- HPI YoY
- ▲ 4.48%
- Current HPI
- 151.1096
- Rent YoY
- —
- Metro
- —
- State GDP YoY
- —
- F500 in state
- 0
Price history
+5.8% since first listed3 events — show timeline
- 2026-06-01 Listed $275,000 MREIS
- 2022-03-28 Delisted — MREIS
- 2022-02-17 Listed $260,000 MREIS
Property tax history
+8.8%/yrLatest (2025): $2,536 · +2.8% YoY. Source: county tax records.
Cash-flow waterfall
monthlySold comps — $/sqft
last 12 mo · ≤1 miLoading sold comps…