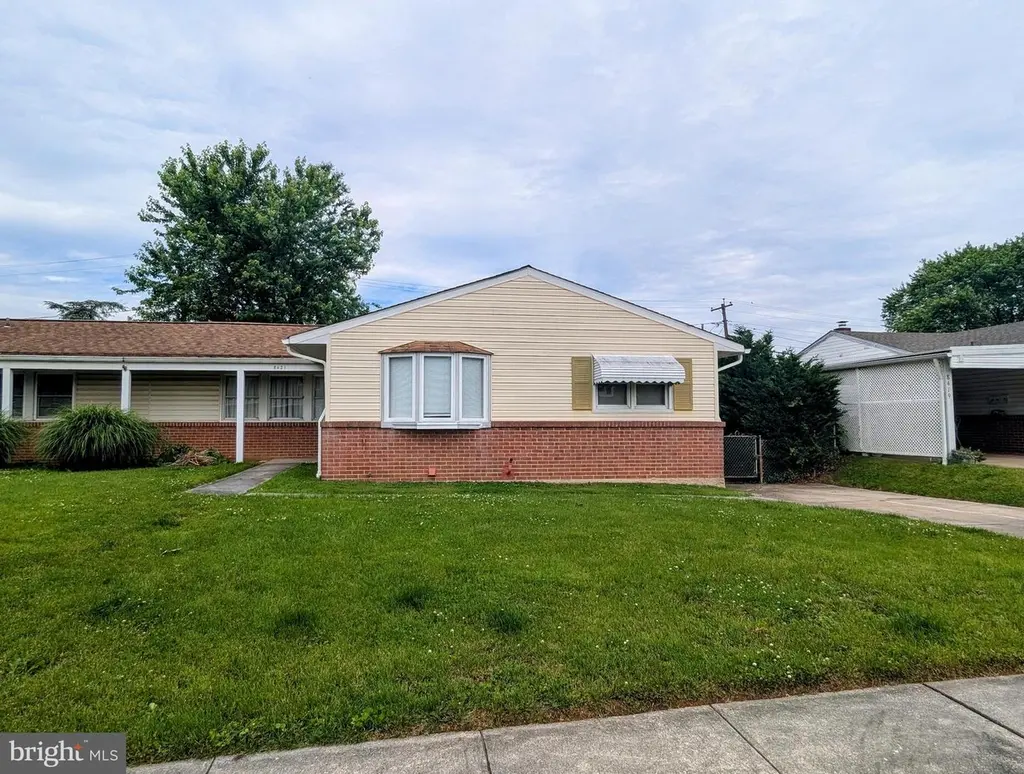
8421 Hallmark Cir · Overlea, MD
Flood risk 1/10 · Minimal
- FEMA flood zone
- X (unshaded)
- Chance of flooding over 30 yrs
- 0.0%
- Est. flood insurance / yr
- $473 – $860
Fire risk 1/10 · Minimal
- Est. fire insurance / yr
- $755 – $1,403
Heat risk 7/10 · Major
- Hot days now (above 104°F)
- 7 days/yr
- Hot days in 30 yrs
- 15 days/yr
Wind risk 6/10 · Moderate
- Chance of severe wind over 30 yrs
- 27.0%
Air-quality risk 4/10 · Minor
- Unhealthy air days now
- 5 days/yr
- Unhealthy air days in 30 yrs
- 7 days/yr
Risk factors via First Street. Map © Google.
Why this score? — see what drove the D+ grade
The composite is a weighted blend of 9 inputs, each scored 0–100. Each bar is that input's sub-score; the figure is the points it added to the 100-point composite (weight × sub-score).
- Cash flow +13.5/30.0
- ARV discount +10.7/15.0
- Rent growth +4.2/5.0
- DSCR +4.1/10.0
- Livability +4.0/5.0
- 1% rule +3.7/10.0
- Condition / age +2.5/5.0
- Schools +2.3/10.0
- Appreciation +0.0/10.0
$250,000
🖨 Deal sheet (PDF) 📄 Offer letter ✓ Due diligence
Listing remarks
SHORT SALE Investor or Handy Home-Owner Opportunity - Spacious semi-detached home in Parkville. Full Basement with potential to add much more finished living space. Final sale price is subject to 3rd party approval. See agent remarks for more details or contact the listing agent with questions. Easy to show!
Key facts
- Full basement
- Semi-detached home
- 2 parking spots
Tags
Property features AI
Exterior
- Parking: Driveway parking (2 spaces); On-street parking; Total of 2 garage/parking spaces
- Utilities: Public water; Public sewer; Electric cooling; Natural gas for heating and hot water
- Home design: Semi-detached; Entry level information not specified; Property listed as fee simple ownership; Condition described as below average
- Construction: Block construction; Block foundation; Above-grade and below-grade structures; Full, partially daylight basement
- Exterior features: Exterior lighting
Interior
- Bedrooms: 3 bedrooms on the main level
- Flooring: Hardwood; Carpet
- Bathrooms: 1 full bathroom; 1 half bathroom
- Heating & cooling: Central heating (forced air); Natural gas heating; Central A/C (electric); Natural gas hot water
- Interior features: Exterior lighting; Entry slope less than 1'
- Laundry & utility: Laundry area on lower floor
Neighborhood map
What this means for you Summary
Snapshot
- This is a 3-bed/1.5-bath townhouse listed at $250k.
Deal economics
- At list price, monthly cash flow is $10 ($125/yr) — positive.
- The deal already cash-flows at list — no discount required.
- To meet the 1% rule (rent ≥ 1% of price), the offer needs to be $218k (13.0% below list).
- Recommended offer: $218k (13.0% below list) — sets the bar for 1% rule.
Location & tenants
- Location reads 81/100 on livability (#38 in MD, #1,418 nationally) — a professional / high-income tenant draw. Strengths: amenities A+, commute A+, housing A+; Watch: crime F.
- Baltimore County Public Schools (suburban): math 15% / reading 34% proficiency, ranked #11 of 24 in MD (top 46%) — low school quality limits family demand, transient renter base, plan for 1-2y turnover.
- Market conditions: Rents rising fast (+6.7%/yr); 225 active listings in the ZIP; 27 comparable units currently listed for rent nearby; rentals lingering (median 44d on market — plan ~5-8 weeks vacancy on turnover, expect pricing pressure); 56% of comp listings sitting > 30 days — soft ceiling on asking rent; solid renter incomes; 1,511 units permitted in Baltimore County in 2024 (643 in 5+ unit buildings).
- This rent runs 31% of the median local income ($84k/yr) — at the standard rent-burdened threshold; future hikes will face affordability resistance.
Forward outlook
- Local home prices are declining (-3.0%/yr); year-one equity from $2k of loan paydown is wiped out by about $8k of value loss. Plan a longer hold.
- Baltimore County population projected at +12% by 2050 — modest demand growth; plan on rents tracking national, not racing it.
Negotiation context
- Only 14 days on market — expect competitive offers; lowballing is unlikely to land.
- Current owner paid $50k; list at $250k implies a 400% gain — meaningful room to come down on a strong offer.
Risks & watch-outs
- Climate carrying-cost: major wind risk, 27% chance of damaging wind over 30y; extreme-heat days projected 7→15/yr by 2055 (HVAC capex compounding) — expect insurance premiums to compound above CPI over the hold.
Questions for the listing agent
- Built in 1962 — when were the roof, HVAC, electrical panel, plumbing, and water heater last replaced?
- Is there a deadline driving the sale (1031 exchange, divorce, estate, relocation)? That informs how much negotiation room exists.
- Crime grade is F in this area — have there been break-ins, vandalism, or insurance claims at this property in the last 3 years? What carrier currently insures it and at what premium?
- The area grade is low — what's the realistic commute time and amenity access for the typical tenant pool here? Any planned neighborhood developments (good or bad) we should know about?
- What's the average days-on-market for RENTAL listings here right now (not sales)? A rising rental-DOM trend means longer vacancies and softer asking-rent achievability than the comps imply.
- What's the recent tenant-quality profile in this submarket — average credit score on applications, eviction rate, late-payment / NSF rate, and stable-employment percentage? A property-management company in the area should have these aggregated.
- How much new for-sale + rental construction is in the pipeline within 1–3 miles? Heavy new supply typically softens prices + rents 12–24 months out; constrained supply supports both.
Investment metrics
- 1% rule
- 0.87% ✗
- Cap rate
- 6.34%
- Cash-on-cash
- 0.18%
- DSCR
- 1.01
- GRM
- 9.6
CMA / ARV
- ARV (on-the-fly)
- $269,216
- Comps found
- 8
Show comp detail 8 sales within ~0.75 mi
| Address | Dist | Beds/Ba | Sqft | Sold | Price | $/sf | Match |
|---|---|---|---|---|---|---|---|
| 8413 Hallmark Cir | 0.04mi | 3/1.5 | 1,504 (0%) | 8mo | $278,000 | $185 | 91 |
| 3309 Hiss Ave | 0.31mi | 3/1.5 | 1,550 (+3%) | 20mo | $278,000 | $179 | 64 |
| 9 Bridgeview Ct | 0.61mi | 3/1.5 | 1,518 (+1%) | 8mo | $260,000 | $171 | 64 |
| 3802 Rolling Way | 0.48mi | 3/2.0 | 1,652 (+10%) | 9mo | $260,000 | $157 | 52 |
| 3810 Glenview Ter | 0.56mi | 3/2.5 | 1,606 (+7%) | 9mo | $265,000 | $165 | 51 |
| 32 Jack Pine Pl | 0.61mi | 3/2.5 | 1,440 (-4%) | 14mo | $312,000 | $217 | 49 |
| 22 Pine Chip Ct | 0.66mi | 2/2.0 (-1) | 1,494 (-1%) | 23mo | $263,000 | $176 | 42 |
| 3136 Dubois Ave | 0.68mi | 3/1.0 | 1,280 (-15%) | 18mo | $265,000 | $207 | 26 |
Match score weights: distance 35% · size 25% · config 20% · recency 20%. Top-matched comps best support the ARV.
Projected returns pro-forma
-3.0% appreciation · 6.68% rent growth · sell at horizon
- IRR
- -12.0%
- Equity multiple
- 0.55×
- Total profit
- $-31,474
- Equity at exit
- $37,276
- IRR
- 1.8%
- Equity multiple
- 1.15×
- Total profit
- $10,507
- Equity at exit
- $21,615
Cash invested: $70,000 (down + closing). Projections, not guarantees.
Landlord ↔ Tenant lean methodology
- Overall (STATE)
- 27 Tenant-Leaning
- State Maryland
- 27 Tenant-Leaning · D+14
- County
- — inherits STATE
- City
- — inherits STATE
ZIP-level market 21234
- Rents YoY
- 6.7%
- Active inventory
- 225
- Price-to-rent
- 9.6×
Monthly cashflow live
- Estimated rent
- $2,175 high interval (Pro) →
- Mortgage (P&I)
- −$1,311
- Tax from tax record
- −$293 /mo · $3,516/yr
- Insurance
- −$104
- HOA
- −$0
- Vacancy / Maint / Mgmt
- −$457
- Net cashflow
- $10
Break-even live
Sensitivity live
| Price | -10% $152 | -5% $81 | +0% $10 | +5% $-60 | +10% $-131 |
|---|---|---|---|---|---|
| Rent | -10% $-161 | -5% $-76 | +0% $10 | +5% $96 | +10% $182 |
| Rate | -1.0pp $136 | -0.5pp $74 | base $10 | +0.5pp $-54 | +1.0pp $-120 |
UW: 25.0% down · 7.5% · 30yr · 1.5% tax · 5.0% vac · 8.0% maint · 8.0% mgmt
Financing live
Cash to close
- Down payment
- $62,500
- Closing costs
- $7,500
- Reserves months
- —
- Total cash needed
- —
Loan-product check · same deal, 3 products live
Conventional
25% down · 7.5% · 30yr
- Down + closing
- —
- Monthly P&I
- —
- Monthly cashflow
- —
- DSCR
- —
- Eligible?
- —
Personal DTI + credit; lowest rate.
DSCR
20% down · 8.5% · 30yr
- Down + closing
- —
- Monthly P&I
- —
- Monthly cashflow
- —
- DSCR
- —
- Eligible?
- —
No personal income docs; deal must DSCR.
Hard money
10% down · 12.0% · 12mo
- Down + closing
- —
- Monthly P&I
- —
- Monthly cashflow
- —
- DSCR
- —
- Eligible?
- —
Short-term bridge; refi at stabilization.
Rent comps 27 comps
| Address | Beds | Baths | Sqft | Rent | $/sqft | DOM | Units | Dist |
|---|---|---|---|---|---|---|---|---|
| 3617 Double Rock Ln Parkville, MD | 3.0 | 2.5 | 2000 | $2,395 | $1.20 | 5d | 1 | 0.19mi |
| 7935 Belridge Rd Nottingham, MD | 1.0–3.0 | 1.0–1.5 | 974 | $2,172 | $2.23 | 2d | 17 | 0.63mi |
| 5 Belhaven Dr Nottingham, MD | 4.0 | 1.5 | 1554 | $2,000 | $1.29 | 44d | 1 | 0.66mi |
| 35-C Mopec Cir Nottingham, MD | 2.0 | 1.0 | 1100 | $1,445 | $1.31 | 2d | 10 | 0.67mi |
| 3407 Orbitan Rd Parkville, MD | 3.0 | 1.5 | 1508 | $2,200 | $1.46 | 24d | 1 | 0.81mi |
| 3026 Lavender Ave Parkville, MD | 2.0 | 2.0 | 2000 | $1,850 | $0.93 | 24d | 1 | 0.84mi |
| 29 E Elm Ave Baltimore, MD | 3.0 | 2.0 | 2052 | $3,000 | $1.46 | 5d | 1 | 1.04mi |
| 3108 Glendale Ave Parkville, MD | 3.0 | 3.0 | 1224 | $2,550 | $2.08 | 24d | 1 | 1.07mi |
| 100 Elinor Ave Nottingham, MD | 4.0 | 2.5 | 1800 | $2,800 | $1.56 | 24d | 1 | 1.08mi |
| 101 Elinor Ave Nottingham, MD | 4.0 | 2.0 | 1476 | $2,900 | $1.96 | 44d | 1 | 1.10mi |
| 8204 Old Harford Rd Unit 2 Parkville, MD | 2.0 | 1.0 | 1146 | $1,850 | $1.61 | 44d | 1 | 1.19mi |
| 8206 Old Harford Rd Unit 2 Parkville, MD | 2.0 | 1.0 | 1146 | $1,850 | $1.61 | 44d | 1 | 1.19mi |
| 8206 Old Harford Rd Unit 1 Parkville, MD | 2.0 | 1.0 | 1146 | $1,750 | $1.53 | 44d | 1 | 1.19mi |
| 9300 Carney Ave Unit A Parkville, MD | 2.0 | 1.0 | 1392 | $1,300 | $0.93 | 44d | 1 | 1.21mi |
| 21 Monhegan Ct Unit 28B Nottingham, MD | 3.0 | 2.0 | 1436 | $1,900 | $1.32 | 44d | 1 | 1.26mi |
| 2 Durness Ct Unit 30I Nottingham, MD | 3.0 | 2.0 | 1446 | $2,100 | $1.45 | 44d | 1 | 1.29mi |
| 5110 Kenwood Ave Baltimore, MD | 3.0 | 1.5 | 1406 | $2,500 | $1.78 | 44d | 1 | 1.32mi |
| 3158 Woodring Ave Parkville, MD | 3.0 | 1.5 | 1500 | $1,950 | $1.30 | 24d | 1 | 1.33mi |
| 9428 Orbitan Ct Parkville, MD | 2.0 | 1.5 | 1670 | $2,250 | $1.35 | 44d | 1 | 1.35mi |
| 3412 Fleetwood Ave Baltimore, MD | 3.0 | 2.5 | 1620 | $2,195 | $1.35 | 44d | 1 | 1.38mi |
| 8334 Tapu Ct Nottingham, MD | 3.0 | 2.5 | 1302 | $2,100 | $1.61 | 15d | 1 | 1.44mi |
| 2908 5th Ave Parkville, MD | 3.0 | 1.0 | 1260 | $1,950 | $1.55 | 44d | 1 | 1.46mi |
| 6410 Walther Ave Baltimore, MD | 2.0 | 1.0–2.0 | 1195 | $1,995 | $1.67 | 44d | 7 | 1.46mi |
| 8507 Gradien Dr Baltimore, MD | 3.0 | 1.5 | 1056 | $2,100 | $1.99 | 24d | 1 | 1.48mi |
| 24 Lerner Ct Unit 32H Nottingham, MD | 3.0 | 2.0 | 1556 | $2,295 | $1.47 | 18d | 1 | 1.49mi |
| 3201 E Joppa Rd Parkville, MD | 3.0 | 1.5 | 1812 | $2,800 | $1.55 | 44d | 1 | 1.49mi |
| 8500 Arry Pl Parkville, MD | 3.0 | 2.5 | 2100 | $2,500 | $1.19 | 44d | 1 | 1.50mi |
Listing history 11 events
-
2026-06-13statusdays on market $250,000 Pending 14 DOM
-
2026-06-09days on market $250,000 Active 13 DOM
-
2026-06-08days on market $250,000 Active 12 DOM
-
2026-06-07days on market $250,000 Active 11 DOM
-
2026-06-04days on market $250,000 Active 8 DOM
-
2026-06-03days on market $250,000 Active 7 DOM
-
2026-06-02days on market $250,000 Active 6 DOM
-
2026-06-01days on market $250,000 Active 5 DOM
-
2026-05-31days on market $250,000 Active 4 DOM
-
2026-05-27$250,000 Active
-
1977-09-13soldstatus $50,000
ⓘ Source: listings_history table (triggers on properties + properties_extension) + one-shot
backfill from property_details.listing_events for pre-trigger history.
Tax reassessment forecast MD · Partial reset (capped growth)
- Current annual tax
- $3,516 · $293/mo
- Projected year-2 tax
- $3,516 · $293/mo
- Expected delta
- $0/yr ($0/mo · 0.0%)
ⓘ Screening estimate from a state-policy table — verify with the county assessor before closing.
Climate risk First Street
- Flood 1/10 Low FEMA zone X (unshaded) · 0% chance over 30 yrs
- Wildfire 1/10 Low
- Heat 7/10 Severe 7 d/yr ≥104°F today · 15 d/yr by 30 yrs out
- Wind 6/10 Major 27% chance of damaging wind over 30 yrs
- Air quality 4/10 Moderate 5 unhealthy d/yr today · 7 by 30 yrs out
Nearby sold comps map
Loading sold comps map…
Walkable amenities ~0.75 mi
Loading nearby amenities…
Taxation est. · year 1
- Rental income
- $26,105
- − Mortgage interest
- −$14,004
- − Property taxes
- −$3,516
- − Insurance
- −$1,250
- − Repairs & maintenance
- −$2,088
- − Management
- −$2,088
- − Depreciation
- −$7,273
- Taxable loss
- −$4,114
- Est. tax savings @ 24.0%
- +$987
- After-tax cash flow
- $1,112/yr
For passive investors: Depreciation is non-cash, so a rental often shows a tax loss while cash-flowing — sheltering income. Rental losses are passive: they offset passive income freely, and up to $25,000/yr can offset ordinary (W-2) income if you actively participate and your MAGI is under $100k (phasing out to $0 by $150k); unused losses carry forward. On sale, claimed depreciation is recaptured at up to 25%, and gains may owe capital-gains tax (a 1031 exchange can defer both). Figures are a year-1 estimate at your 24.0% rate — not tax advice; consult a CPA.
Schools (NCES district)
- District
- Baltimore County Public Schools
- NCES district ID
- 2400120
- Math proficiency
- 15% ▼ -16.00%
- Reading proficiency
- 34% ▼ -5.00%
- Median HH income
- $66,746
- Composite
- 23.17/100
- National rank
- #7948
- State rank
- #11 of 24 in MD
Livability — Overlea
- Score
- 81/100
- State rank
- #38
- US rank
- #1418
Category grades
Schools grade is shown separately in the Schools card above.
Census & demographics
- Census place
- Overlea, MD
- County
- Baltimore County · 769,527 people
- Metro
- Baltimore-Columbia-Towson, MD
- Population (ZIP)
- 66,334
- Household income
- $83,517
- Rent vs Own
- Severe rent burden
- 2719.0
Population outlook (Baltimore County) Hauer SSP2
- Today (2025)
- 885,518 people
- By 2030
- 909,272 · +2.7%
- By 2040
- 951,547 · +7.5%
- By 2050
- 990,955 · +11.9%
- By 2075
- 1,086,411 · +22.7%
- By 2100
- 1,135,078 · +28.2%
Race, ethnicity, and origin ACS 2023
- Neighborhood character
- Diverse neighborhood (Simpson 0.58)
- Race & ethnicity
- White 58% Black 28% Asian 5% Hispanic / Latino 5% Two or more races 5%
- Common ancestry
- Romanian 5% Lithuanian 1% Italian 1%
- Foreign-born
- 10% · Canada, China, South Korea
- Languages at home
- 89% English-only · Spanish 3% Other Indo-European 2% Tagalog/Filipino 1%
Political lean MEDSL · Baltimore
- 2024 margin
- Strong D (+24.5) · D 61.0% · R 36.5% · Other 2.5%
- 2008→2024 swing
- +9.9pp toward D · 2008: 14.6pp · 2024: 24.5pp
- All cycles
- 2024: D+24.5 2020: D+27.0 2016: D+17.4 2012: D+16.4 2008: D+14.6
Not yet ingested
- Civics
- —
Market trends
- HPI YoY
- ▼ -247.04%
- Current HPI
- 254.3824
- Rent YoY
- ▲ 6.68%
- Metro
- Baltimore-Columbia-Towson, MD
- State GDP YoY
- ▲ 2.97%
- F500 in state
- 12
Industry mix (Fortune 500 HQ in MD)
| Industry | F500 HQs | Revenue |
|---|---|---|
| Aerospace / Defense | 1 | $71B |
|
||
| Utilities | 1 | $25B |
|
||
| Hotels | 1 | $24B |
|
||
| Consumer Goods | 1 | $7B |
|
||
| Real Estate | 1 | $6B |
|
||
| Chemicals | 1 | $2B |
|
||
Price history
+400.0% since first listed2 events — show timeline
- 2026-05-27 Listed $250,000 BRIGHT MLS
- 1977-09-13 Sold (Public Records) $50,000 Public Records
Property tax history
+2.8%/yrLatest (2025): $3,516 · +3.1% YoY. Source: county tax records.
Cash-flow waterfall
monthlySold comps — $/sqft
last 12 mo · ≤1 miLoading sold comps…