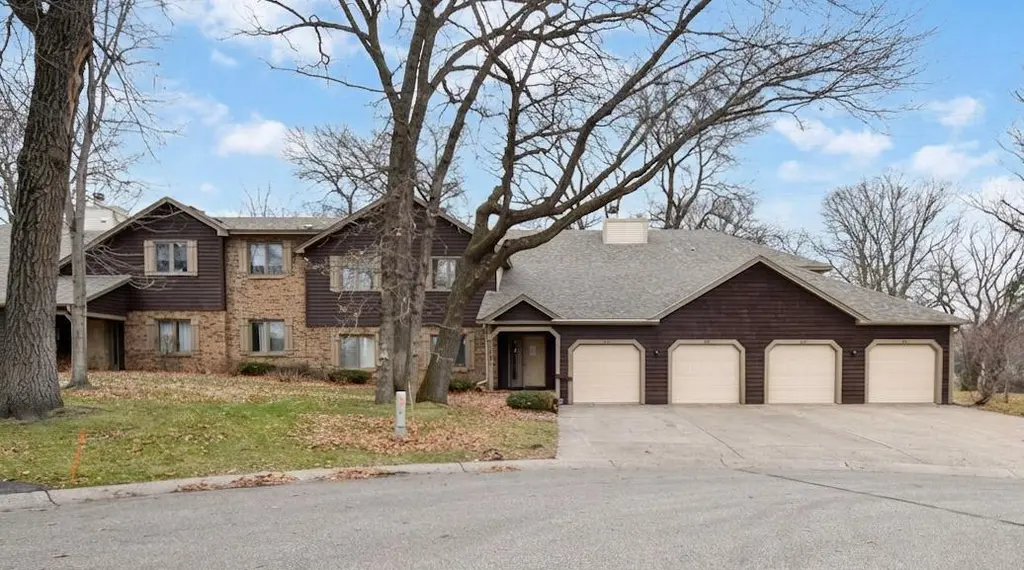
12191 Grouse St NW #408 · Coon Rapids, MN
Flood risk 1/10 · Minimal
- FEMA flood zone
- X (unshaded)
- Chance of flooding over 30 yrs
- 0.0%
- Est. flood insurance / yr
- $507 – $1,088
Fire risk 1/10 · Minimal
- Est. fire insurance / yr
- $888 – $1,650
Heat risk 2/10 · Minimal
- Hot days now (above 100°F)
- 7 days/yr
- Hot days in 30 yrs
- 14 days/yr
Wind risk 2/10 · Minimal
- Chance of severe wind over 30 yrs
- —
Air-quality risk 2/10 · Minimal
- Unhealthy air days now
- 2 days/yr
- Unhealthy air days in 30 yrs
- 2 days/yr
Risk factors via First Street. Map © Google.
Why this score? — see what drove the D- grade
The composite is a weighted blend of 9 inputs, each scored 0–100. Each bar is that input's sub-score; the figure is the points it added to the 100-point composite (weight × sub-score).
- ARV discount +9.7/15.0
- Cash flow +7.2/30.0
- Schools +4.7/10.0
- Livability +4.3/5.0
- 1% rule +3.5/10.0
- Rent growth +2.5/5.0
- Condition / age +2.5/5.0
- DSCR +1.4/10.0
- Appreciation +0.0/10.0
$230,000
🖨 Deal sheet 📄 Offer letter ✓ Due diligence
Listing remarks MLS
Discover the charm of this cozy upper-level manor home, featuring 3 spacious bedrooms and 2 bathrooms, nestled on a peaceful cul-de-sac. This property boasts numerous amenities, including a walkout from the dining room to a newly painted deck that provides stunning views of a serene, private backyard. Enjoy both formal and informal dining options in a stylish, neutral décor. The home includes a water softener, plenty of storage, and a convenient laundry room with utilities. The primary bedroom offers the bonus of a 3/4 bathroom for your comfort. With parks, shopping, and entertainment just around the corner, this home is truly a must-see! Please be aware that rental restrictions apply, and there are no signs on the property.
Key facts
- Private deck
- Treed backyard
- $398 HOA
Tags
Neighborhood map
What this means for you Summary
Snapshot
- This is a 3-bed/2.0-bath condo listed at $230k.
Deal economics
- At list price, monthly cash flow is $-319 ($-4k/yr) — negative.
- To cash-flow at today's rent, offer at most $174k (24.5% below list).
- To meet the 1% rule (rent ≥ 1% of price), the offer needs to be $196k (14.7% below list).
- Recommended offer: $174k (24.5% below list) — sets the bar for cash-flow.
- Cap rate 4.6% vs local median 3.8% in Coon Rapids — meaningfully above typical; check what's discounted (condition, days-on-market, listing class) to confirm the premium yield is real.
Location & tenants
- Location reads 86/100 on livability (#12 in MN, #390 nationally) — a professional / high-income tenant draw. Strengths: commute A+, employment A+, housing A+; Watch: amenities D.
- Anoka-Hennepin Public School District (suburban): math 49% / reading 55% proficiency, ranked #71 of 301 in MN (top 24%) — acceptable for families but not a draw, mixed tenant base, ~2y average lease.
- Market conditions: 115 active listings in the ZIP; 5 comparable units currently listed for rent nearby; rentals at typical pace (median 24d on market — plan ~3-4 weeks tenant-placement turnaround); 40% of comp listings sitting > 30 days — soft ceiling on asking rent; solid renter incomes; 1,083 units permitted in Anoka County in 2024 (134 in 5+ unit buildings).
Forward outlook
- Local home prices are declining (-3.0%/yr); year-one equity from $2k of loan paydown is wiped out by about $7k of value loss. Plan a longer hold.
- Anoka County population projected at +11% by 2050 — modest demand growth; plan on rents tracking national, not racing it.
Negotiation context
- It's been on market 73 days — a 6% lower offer ($216k) is reasonable based on typical stale-listing flexibility.
- 4 sale attempts since 30y ago with the ask held roughly flat each time — persistent listings suggest the price (not the market) is what's stuck; bring a comps-based counter.
- Current owner paid $177k; 30% above their basis — modest negotiation headroom, anchor on the comps not their cost.
Risks & watch-outs
- Watch-outs: HOA is 20% of rent.
Questions for the listing agent
- What do current leases actually rent for vs. the listed asking? Can we see a recent rent roll and the last 12 months of T-12 income?
- It's been on market 73 days. Have you received any prior offers? Is the seller open to a 24% concession, seller financing, or rate buy-down credit?
- What does the HOA fee cover, when was the last increase, and are there any pending special assessments or reserve-fund shortfalls?
- Any open or pending special assessments — roof, HVAC, plumbing, elevator, façade? What's the per-unit balance and payoff schedule, and is the seller paying it off at close or rolling it to the buyer?
- Why hasn't it sold? Are there any deal-killer items the seller is aware of (foundation, flood, title, zoning, code violations)?
- Is there a deadline driving the sale (1031 exchange, divorce, estate, relocation)? That informs how much negotiation room exists.
- Schools are B-rated — typically a magnet for longer-tenancy family renters. What's the average tenant stay here, and is there a school-zone premium baked into asking?
- The area grade is low — what's the realistic commute time and amenity access for the typical tenant pool here? Any planned neighborhood developments (good or bad) we should know about?
- What's the average days-on-market for RENTAL listings here right now (not sales)? A rising rental-DOM trend means longer vacancies and softer asking-rent achievability than the comps imply.
- What's the recent tenant-quality profile in this submarket — average credit score on applications, eviction rate, late-payment / NSF rate, and stable-employment percentage? A property-management company in the area should have these aggregated.
- How much new apartment / multifamily construction is in the pipeline within 1–3 miles? Heavy new supply (>2% of stock underway) typically softens rents 12–24 months out; light construction supports rent growth.
Investment metrics
- 1% rule
- 0.85% ✗
- Cap rate
- 4.63%
- Cash-on-cash
- -5.94%
- DSCR
- 0.74
- GRM
- 9.8
CMA / ARV
- ARV (median comp)
- $241,999
- List price
- $230,000
- Delta
- -4.96%
- Verdict
- FAIR
- Comps
- 2 within 2.0 mi
Projected returns pro-forma
-3.0% appreciation · 3.0% rent growth · sell at horizon
- IRR
- -26.4%
- Equity multiple
- 0.11×
- Total profit
- $-57,357
- Equity at exit
- $34,294
- IRR
- -23.1%
- Equity multiple
- -0.17×
- Total profit
- $-75,253
- Equity at exit
- $19,886
Cash invested: $64,400 (down + closing). Projections, not guarantees.
Landlord ↔ Tenant lean methodology
- Overall (STATE)
- 46 Balanced
- State Minnesota
- 46 Balanced · D+2
- County
- — inherits STATE
- City
- — inherits STATE
ZIP-level market 55448
- Home prices YoY
- -27.6%
- Active inventory
- 115
- Price-to-rent
- 9.8×
Monthly cashflow live
- Estimated rent
- $1,962 high interval (Pro) →
- Mortgage (P&I)
- −$1,206
- Tax from tax record
- −$169 /mo · $2,023/yr
- Insurance
- −$96
- HOA
- −$398
- Vacancy / Maint / Mgmt
- −$412
- Net cashflow
- $-319
Break-even live
UW: 25.0% down · 7.5% · 30yr · 1.5% tax · 5.0% vac · 8.0% maint · 8.0% mgmt
Financing live
Cash to close
- Down payment
- $57,500
- Closing costs
- $6,900
- Reserves months
- —
- Total cash needed
- —
Loan-product check · same deal, 3 products live
Conventional
25% down · 7.5% · 30yr
- Down + closing
- —
- Monthly P&I
- —
- Monthly cashflow
- —
- DSCR
- —
- Eligible?
- —
Personal DTI + credit; lowest rate.
DSCR
20% down · 8.5% · 30yr
- Down + closing
- —
- Monthly P&I
- —
- Monthly cashflow
- —
- DSCR
- —
- Eligible?
- —
No personal income docs; deal must DSCR.
Hard money
10% down · 12.0% · 12mo
- Down + closing
- —
- Monthly P&I
- —
- Monthly cashflow
- —
- DSCR
- —
- Eligible?
- —
Short-term bridge; refi at stabilization.
Rent comps 5 comps
| Address | Beds | Baths | Sqft | Rent | $/sqft | DOM | Units | Dist |
|---|---|---|---|---|---|---|---|---|
| 12186 Drake St NW Minneapolis, MN | 2.0 | 1.0 | 1100 | $1,695 | $1.54 | 43d | 1 | 0.13mi |
| 12114 Drake St NW Minneapolis, MN | 3.0 | 2.0 | 1460 | $1,895 | $1.30 | 43d | 1 | 0.20mi |
| 1770 121st Ave NW Minneapolis, MN | 1.0–3.0 | 1.0–2.0 | 1075 | $2,120 | $1.97 | 1d | 11 | 0.41mi |
| 11639 Raven St NW Coon Rapids, MN | 2.0–3.0 | 1.0–2.0 | 900 | $1,850 | $2.06 | 1d | 5 | 1.03mi |
| 11360 Robinson Dr Coon Rapids, MN | 1.0–3.0 | 1.0–2.0 | 1029 | $1,874 | $1.82 | 24d | 1 | 1.07mi |
HOA detail condo
- Monthly dues
- $398 · $4,776/yr
- Likely covers
- water
- Assessments
- None detected in remarks — confirm with the listing agent.
Listing history 25 events
-
2026-06-18days on market $230,000 Active 73 DOM
-
2026-06-17days on market $230,000 Active 72 DOM
-
2026-06-16days on market $230,000 Active 71 DOM
-
2026-06-15days on market $230,000 Active 70 DOM
-
2026-06-13days on market $230,000 Active 68 DOM
-
2026-06-13days on market $230,000 Active 67 DOM
-
2026-06-09days on market $230,000 Active 64 DOM
-
2026-06-08days on market $230,000 Active 63 DOM
-
2026-06-07days on market $230,000 Active 62 DOM
-
2026-06-04days on market $230,000 Active 59 DOM
-
2026-06-03days on market $230,000 Active 58 DOM
-
2026-06-02days on market $230,000 Active 57 DOM
-
2026-06-01days on market $230,000 Active 56 DOM
-
2026-05-31days on market $230,000 Active 55 DOM
-
2026-04-06$230,000 Active 741-char remark
Show marketing remark (741 chars)
Discover the charm of this cozy upper-level manor home, featuring 3 spacious bedrooms and 2 bathrooms, nestled on a peaceful cul-de-sac. This property boasts numerous amenities, including a walkout from the dining room to a newly painted deck that provides stunning views of a serene, private backyard. Enjoy both formal and informal dining options in a stylish, neutral décor. The home includes a water softener, plenty of storage, and a convenient laundry room with utilities. The primary bedroom offers the bonus of a 3/4 bathroom for your comfort. With parks, shopping, and entertainment just around the corner, this home is truly a must-see! Please be aware that rental restrictions apply, and there are no signs on the property.
-
2023-05-05soldstatus $177,000 Sold 151-char remark
Show marketing remark (151 chars)
Sold "as is" Cash only. 2 bedroom, 2 bath Upper Unit with 1 car garage. Nice view from deck! Kitchen has SS appliances.. nice floor plan.
-
2023-05-05soldstatus $177,000
Show marketing remark (151 chars)
Sold "as is" Cash only. 2 bedroom, 2 bath Upper Unit with 1 car garage. Nice view from deck! Kitchen has SS appliances.. nice floor plan.
-
2023-04-19status Pending 151-char remark
Show marketing remark (151 chars)
Sold "as is" Cash only. 2 bedroom, 2 bath Upper Unit with 1 car garage. Nice view from deck! Kitchen has SS appliances.. nice floor plan.
-
2023-04-10$172,000 Active 151-char remark
Show marketing remark (151 chars)
Sold "as is" Cash only. 2 bedroom, 2 bath Upper Unit with 1 car garage. Nice view from deck! Kitchen has SS appliances.. nice floor plan.
-
1998-06-25soldstatus $80,000
-
1998-05-28historical
-
1998-05-06$82,900
-
1996-05-30soldstatus $72,100
-
1996-03-11historical
-
1996-03-07$72,400
ⓘ Source: listings_history table (triggers on properties + properties_extension) + one-shot
backfill from property_details.listing_events for pre-trigger history.
Tax reassessment forecast MN · Partial reset (capped growth)
- Current annual tax
- $2,023 · $169/mo
- Projected year-2 tax
- $2,299 · $192/mo
- Expected delta
- +$277/yr (+$23/mo · 13.7%)
ⓘ Screening estimate from a state-policy table — verify with the county assessor before closing.
Climate risk First Street
- Flood 1/10 Low FEMA zone X (unshaded) · 0% chance over 30 yrs
- Wildfire 1/10 Low
- Heat 2/10 Low 7 d/yr ≥100°F today · 14 d/yr by 30 yrs out
- Wind 2/10 Low
- Air quality 2/10 Low 2 unhealthy d/yr today · 2 by 30 yrs out
Nearby sold comps map
Loading sold comps map…
Walkable amenities ~0.75 mi
Loading nearby amenities…
Taxation est. · year 1
- Rental income
- $23,544
- − Mortgage interest
- −$12,884
- − Property taxes
- −$2,023
- − Insurance
- −$1,150
- − Repairs & maintenance
- −$1,884
- − Management
- −$1,884
- − HOA
- −$4,776
- − Depreciation
- −$6,691
- Taxable loss
- −$7,746
- Est. tax savings @ 24.0%
- +$1,859
- After-tax cash flow
- $-1,963/yr
For passive investors: Depreciation is non-cash, so a rental often shows a tax loss while cash-flowing — sheltering income. Rental losses are passive: they offset passive income freely, and up to $25,000/yr can offset ordinary (W-2) income if you actively participate and your MAGI is under $100k (phasing out to $0 by $150k); unused losses carry forward. On sale, claimed depreciation is recaptured at up to 25%, and gains may owe capital-gains tax (a 1031 exchange can defer both). Figures are a year-1 estimate at your 24.0% rate — not tax advice; consult a CPA.
Schools (NCES district)
- District
- Anoka-Hennepin Public School District
- NCES district ID
- 2703180
- Math proficiency
- 49% ▼ -14.00%
- Reading proficiency
- 55% ▼ -10.00%
- Median HH income
- $73,837
- Composite
- 46.7/100
- National rank
- #2400
- State rank
- #71 of 301 in MN
Livability — Coon Rapids
- Score
- 86/100
- State rank
- #12
- US rank
- #390
Category grades
Schools grade is shown separately in the Schools card above.
Census & demographics
- Census place
- Coon Rapids, MN
- County
- Anoka County · 277,116 people
- City population
- 63,468
- Metro
- Minneapolis-St. Paul-Bloomington, MN-WI
- Population (ZIP)
- 29,005
- Household income
- $103,461
- Rent vs Own
- Severe rent burden
- 221.0
Population outlook (Anoka County) Hauer SSP2
- Today (2025)
- 375,223 people
- By 2030
- 387,850 · +3.4%
- By 2040
- 407,239 · +8.5%
- By 2050
- 417,541 · +11.3%
- By 2075
- 448,447 · +19.5%
- By 2100
- 464,954 · +23.9%
Race, ethnicity, and origin ACS 2023
- Neighborhood character
- Predominantly White (75%)
- Race & ethnicity
- White 75% Black 8% Asian 7% Hispanic / Latino 7% Two or more races 6%
- Hispanic origin (detail)
- Mexican 6%
- Common ancestry
- Portuguese 13% Romanian 5% Lithuanian 3%
- Foreign-born
- 11% · Canada, Vietnam, South Korea
- Languages at home
- 85% English-only · Spanish 4% Other Asian/Pacific 4% Russian/Polish/Slavic 1%
Political lean MEDSL · Anoka
- 2024 margin
- Toss-up / Even · D 46.6% · R 51.0% · Other 2.4%
- 2008→2024 swing
- -2.0pp toward R · 2008: -2.4pp · 2024: -4.4pp
- All cycles
- 2024: R+4.4 2020: R+1.9 2016: R+9.7 2012: R+2.6 2008: R+2.4
Not yet ingested
- Civics
- —
Market trends
- HPI YoY
- ▼ -97.29%
- Current HPI
- 254.7687
- Rent YoY
- —
- Metro
- Minneapolis-St. Paul-Bloomington, MN-WI
- State GDP YoY
- ▲ 2.41%
- F500 in state
- 34
Industry mix (Fortune 500 HQ in MN)
| Industry | F500 HQs | Revenue |
|---|---|---|
| Healthcare | 2 | $407B |
|
||
| Retail | 2 | $150B |
|
||
| Consumer Goods | 2 | $32B |
|
||
| Industrial Machinery | 2 | $6B |
|
||
| Agriculture | 1 | $40B |
|
||
| Healthcare / Medical Devices | 1 | $32B |
|
||
Price history
+217.7% since first listed11 events — show timeline
- 2026-04-06 Listed $230,000 NORTHSTARMLS as Distributed by MLS Grid
- 2023-05-05 Sold (Public Records) $177,000 Public Records
- 2023-05-05 Sold (MLS) $177,000 NORTHSTARMLS as Distributed by MLS Grid
- 2023-04-19 Pending — NORTHSTARMLS as Distributed by MLS Grid
- 2023-04-10 Listed $172,000 NORTHSTARMLS as Distributed by MLS Grid
- 1998-06-25 Sold (MLS) $80,000 NORTHSTARMLS as Distributed by MLS Grid
- 1998-05-28 Listing Removed — NORTHSTARMLS as Distributed by MLS Grid
- 1998-05-06 Listed $82,900 NORTHSTARMLS as Distributed by MLS Grid
- 1996-05-30 Sold (MLS) $72,100 NORTHSTARMLS as Distributed by MLS Grid
- 1996-03-11 Listing Removed — NORTHSTARMLS as Distributed by MLS Grid
- 1996-03-07 Listed $72,400 NORTHSTARMLS as Distributed by MLS Grid
Property tax history
+6.8%/yrLatest (2026): $2,023 · -3.5% YoY. Source: county tax records.
Cash-flow waterfall
monthlySold comps — $/sqft
last 12 mo · ≤1 miLoading sold comps…