1 Running H · Palm Desert, CA
Flood risk 1/10 · Minimal
- FEMA flood zone
- X
- Chance of flooding over 30 yrs
- 0.0%
- Est. flood insurance / yr
- $507 – $1,088
Fire risk 5/10 · Moderate
- Est. fire insurance / yr
- $659 – $1,223
Heat risk 9/10 · Severe
- Hot days now (above 107°F)
- 10 days/yr
- Hot days in 30 yrs
- 28 days/yr
Wind risk 1/10 · Minimal
- Chance of severe wind over 30 yrs
- —
Air-quality risk 4/10 · Minor
- Unhealthy air days now
- 5 days/yr
- Unhealthy air days in 30 yrs
- 6 days/yr
Risk factors via First Street. Map © Google.
Why this score? — see what drove the B- grade
The composite is a weighted blend of 9 inputs, each scored 0–100. Each bar is that input's sub-score; the figure is the points it added to the 100-point composite (weight × sub-score).
- Cash flow +30.0/30.0
- 1% rule +10.0/10.0
- DSCR +10.0/10.0
- ARV discount +6.1/15.0
- Schools +3.8/10.0
- Rent growth +2.9/5.0
- Livability +2.6/5.0
- Condition / age +2.5/5.0
- Appreciation +0.0/10.0
$110,000
🖨 Deal sheet (PDF) 📄 Offer letter ✓ Due diligence
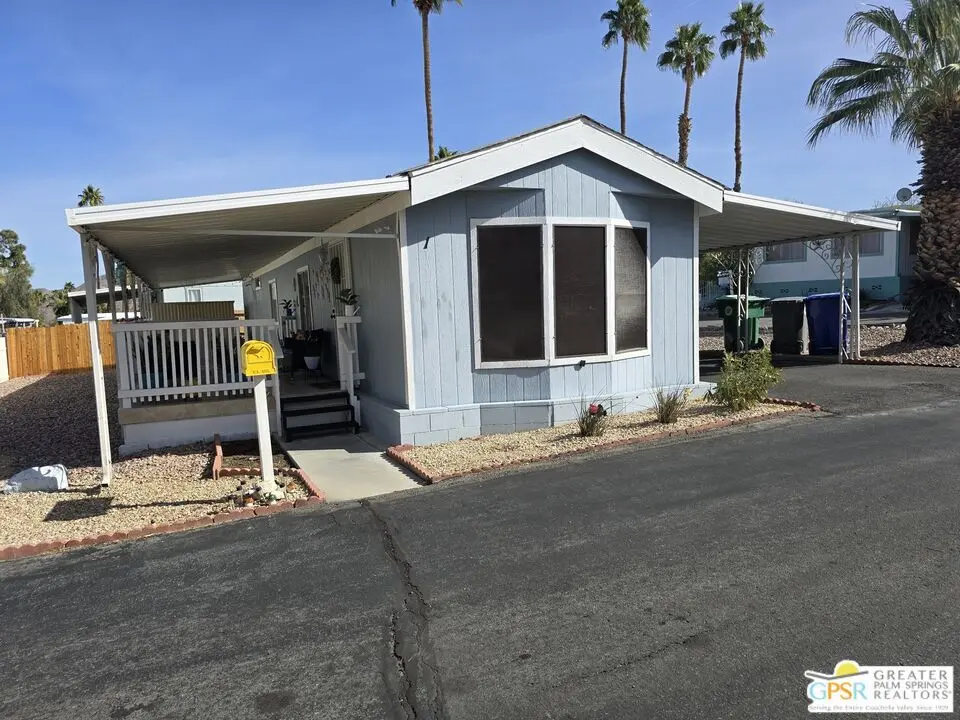
Listing remarks
Single-wide, renovated 2bed, 1bath 840 sq ft 1983 manuf home on a double wide lot in desirable (million $$ views) location high up on Hwy 74 (the beautiful foothills of Palm Desert). Silver Spur Community, rent space park, ALL AGES. Kitchen and living room as one large room w/ vaulted ceiling. Kitchen has bay windows offering a nice breakfast area/nook with mountain views. While Kitchen does not come with a dishwasher there is a dedicated space with hookups for same. Kitchen cabinetry has been upgraded, stainless steel sink, laminate wood flooring in kitchen and great room, both bedrooms are carpeted, vinyl tile in bathroom. Updated vanity in bathroom. Central air/heat system newly installe
Key facts
- Double wide lot
- Vaulted ceiling
- Upgraded cabinetry
Tags
Property features AI
Finance
- Financial info: Monthly land lease: $960 (annual land lease: $11,520)
- HOA & community: Association pet rules (contact for details); Common RV parking; Onsite property management; Community pool and spa; Approximately 300 units in the complex
Exterior
- Parking: Attached carport (tandem); 2 covered parking spaces
- Utilities: Lease (land lease payment applies)
- Home design: Residential mobile home; Located in Silver Spur Community; Land lease
- Construction: Composition roof
- Exterior features: Covered concrete slab patio; Community pool; Community spa; Has mountain view
Interior
- Kitchen: Free standing gas range; Corian counters; Remodeled kitchen; Refrigerator; Range/Oven; Garbage disposal; Water line to refrigerator
- Flooring: Carpeted floors; Laminate floors; Vinyl tile floors
- Bathrooms: 1 full bathroom
- Heating & cooling: Central heat; Central cooling
- Interior features: Breakfast area; Living room; Dining area; Shower over tub
- Laundry & utility: Laundry inside
Neighborhood map
What this means for you Summary
Snapshot
- This is a 2-bed/1.0-bath manufactured listed at $110k.
Deal economics
- At list price, monthly cash flow is $1k ($13k/yr) — positive.
- The deal already cash-flows at list — no discount required.
- Meets the 1% rule at list price ($2k rent vs $110k).
- Recommended offer: $108k (1.5% below list) — sets the bar for market timing.
- Cap rate 18.4% vs local median 3.4% in Palm Desert — top-decile yield for the area; either an underpriced asset or a hidden risk that comps aren't pricing in. Stress-test before assuming the spread holds.
Location & tenants
- Location reads 51/100 on livability (#1,050 in CA) — a working-class tenant base; expect higher turnover. Strengths: employment B+, housing B; Watch: crime D, amenities F, commute F.
- Desert Sands Unified (suburban): math 31% / reading 56% proficiency, ranked #199 of 517 in CA (top 38%) — families likely to look elsewhere, expect single-tenant / working-renter base with shorter leases.
- Zoned schools: Abraham Lincoln Elementary (585 students, 80% FRL); La Quinta Middle (math 24% / reading 24%, grade F, #277 of 498 statewide, top 73%, 754 students, 83% FRL); Palm Desert High (math 42% / reading 67%, grade C-, #256 of 1,170 statewide, top 24%, 2,050 students, 57% FRL) — zoned schools average 73% FRL vs 56% district-wide (17 pts higher); higher-poverty schools than district average — tighter screening recommended.
- Market conditions: Rents rising (+1.6%/yr); 551 active listings in the ZIP; 2 comparable units currently listed for rent nearby; 9,195 units permitted in Riverside County in 2024 (1,512 in 5+ unit buildings).
- This rent runs 41% of the median local income ($70k/yr) — at the standard rent-burdened threshold; future hikes will face affordability resistance.
Forward outlook
- Local home prices are declining (-3.0%/yr); year-one equity from $761 of loan paydown is wiped out by about $3k of value loss. Plan a longer hold.
- Riverside County population projected at +22% by 2050 — long-run rental-demand tailwind backs the buy-and-hold thesis.
- At projected returns (-3.0% appreciation + 1.6% rent growth), your $31k cash investment doubles in ~3 years — after that, you're playing with house money.
Negotiation context
- It's been on market 20 days — a 2% lower offer ($108k) is reasonable based on typical stale-listing flexibility.
- 14 sale attempts since 14y ago with the ask held roughly flat each time — persistent listings suggest the price (not the market) is what's stuck; bring a comps-based counter.
- Current owner paid $87k; 26% above their basis — modest negotiation headroom, anchor on the comps not their cost.
Risks & watch-outs
- Climate carrying-cost: moderate wildfire risk; extreme-heat days projected 10→28/yr by 2055 (HVAC capex compounding) — expect insurance premiums to compound above CPI over the hold.
Questions for the listing agent
- Is there a deadline driving the sale (1031 exchange, divorce, estate, relocation)? That informs how much negotiation room exists.
- Schools are A-rated — typically a magnet for longer-tenancy family renters. What's the average tenant stay here, and is there a school-zone premium baked into asking?
- Crime grade is D in this area — have there been break-ins, vandalism, or insurance claims at this property in the last 3 years? What carrier currently insures it and at what premium?
- What's the average days-on-market for RENTAL listings here right now (not sales)? A rising rental-DOM trend means longer vacancies and softer asking-rent achievability than the comps imply.
- What's the recent tenant-quality profile in this submarket — average credit score on applications, eviction rate, late-payment / NSF rate, and stable-employment percentage? A property-management company in the area should have these aggregated.
- How much new for-sale + rental construction is in the pipeline within 1–3 miles? Heavy new supply typically softens prices + rents 12–24 months out; constrained supply supports both.
Investment metrics
- 1% rule
- 2.16% ✓
- Cap rate
- 18.43%
- Cash-on-cash
- 43.36%
- DSCR
- 2.93
- GRM
- 3.9
CMA / ARV
- ARV (median comp)
- $106,746
- List price
- $110,000
- Delta
- 3.05%
- Verdict
- FAIR
- Comps
- 20 within 1.0 mi
Show comp detail 3 sales within ~0.75 mi
| Address | Dist | Beds/Ba | Sqft | Sold | Price | $/sf | Match |
|---|---|---|---|---|---|---|---|
| 6 Cholla Ln | 0.01mi | 2/2.0 | 840 (0%) | 12mo | $82,500 | $98 | 86 |
| 7 Ocotillo Ln | 0.09mi | 2/2.0 | 798 (-5%) | 9mo | $155,000 | $194 | 76 |
| 16 Prickley Pear Ln | 0.27mi | 2/2.0 | 760 (-10%) | 7mo | $90,000 | $118 | 61 |
Match score weights: distance 35% · size 25% · config 20% · recency 20%. Top-matched comps best support the ARV.
Projected returns pro-forma
-3.0% appreciation · 1.6% rent growth · sell at horizon
- IRR
- 38.6%
- Equity multiple
- 2.62×
- Total profit
- $49,805
- Equity at exit
- $16,401
- IRR
- 44.4%
- Equity multiple
- 4.95×
- Total profit
- $121,652
- Equity at exit
- $9,511
Cash invested: $30,800 (down + closing). Projections, not guarantees.
Landlord ↔ Tenant lean methodology
- Overall (STATE)
- 18 Strongly Tenant-Friendly
- State California
- 18 Strongly Tenant-Friendly · D+13
- County
- — inherits STATE
- City
- — inherits STATE
ZIP-level market 92260
- Rents YoY
- 1.6%
- Active inventory
- 551
- Price-to-rent
- 3.9×
Monthly cashflow live
- Estimated rent
- $2,371 medium interval (Pro) →
- Mortgage (P&I)
- −$577
- Tax est. 1.5%
- −$138 /mo · $1,650/yr
- Insurance
- −$46
- HOA
- −$0
- Vacancy / Maint / Mgmt
- −$498
- Net cashflow
- $1,113
Break-even live
Sensitivity live
| Price | -10% $1,189 | -5% $1,151 | +0% $1,113 | +5% $1,075 | +10% $1,037 |
|---|---|---|---|---|---|
| Rent | -10% $926 | -5% $1,019 | +0% $1,113 | +5% $1,207 | +10% $1,300 |
| Rate | -1.0pp $1,168 | -0.5pp $1,141 | base $1,113 | +0.5pp $1,085 | +1.0pp $1,056 |
UW: 25.0% down · 7.5% · 30yr · 1.5% tax · 5.0% vac · 8.0% maint · 8.0% mgmt
Financing live
Cash to close
- Down payment
- $27,500
- Closing costs
- $3,300
- Reserves months
- —
- Total cash needed
- —
Loan-product check · same deal, 3 products live
Conventional
25% down · 7.5% · 30yr
- Down + closing
- —
- Monthly P&I
- —
- Monthly cashflow
- —
- DSCR
- —
- Eligible?
- —
Personal DTI + credit; lowest rate.
DSCR
20% down · 8.5% · 30yr
- Down + closing
- —
- Monthly P&I
- —
- Monthly cashflow
- —
- DSCR
- —
- Eligible?
- —
No personal income docs; deal must DSCR.
Hard money
10% down · 12.0% · 12mo
- Down + closing
- —
- Monthly P&I
- —
- Monthly cashflow
- —
- DSCR
- —
- Eligible?
- —
Short-term bridge; refi at stabilization.
Rent comps 2 comps
| Address | Beds | Baths | Sqft | Rent | $/sqft | DOM | Units | Dist |
|---|---|---|---|---|---|---|---|---|
| 48828 Desert Flower Dr Palm Desert, CA | 2.0 | 1.0 | 1118 | $2,450 | $2.19 | 45d | 1 | 0.59mi |
| 72619 Thrush Rd #2 Palm Desert, CA | 2.0 | 1.0 | 840 | $2,250 | $2.68 | 26d | 1 | 1.47mi |
Listing history 50 events
-
2026-06-21days on market $110,000 Active 20 DOM
-
2026-06-18days on market $110,000 Active 17 DOM
-
2026-06-17days on market $110,000 Active 16 DOM
-
2026-06-16days on market $110,000 Active 15 DOM
-
2026-06-15days on market $110,000 Active 14 DOM
-
2026-06-13days on market $110,000 Active 12 DOM
-
2026-06-09days on market $110,000 Active 8 DOM
-
2026-06-08days on market $110,000 Active 7 DOM
-
2026-06-07days on market $110,000 Active 6 DOM
-
2026-06-04days on market $110,000 Active 3 DOM
-
2026-06-03days on market $110,000 Active 2 DOM
-
2026-06-02days on market $110,000 Active 1 DOM
-
2026-05-31days on market $110,000 Active 139 DOM
-
2026-04-09price $110,000 1443-char remark
-
2026-01-12$120,000 Active 1443-char remark
-
2025-07-08status Active
-
2025-06-24historical Backup Offers Accepted
-
2025-06-01Active
-
2025-05-22price
-
2025-02-24Active
-
2025-02-01historical
-
2024-10-16price $114,900
-
2024-09-04price $119,900
-
2024-07-27status Active
-
2024-07-24historical Active Under Contract
-
2024-05-01price $129,900
-
2024-03-15$145,000 Active
-
2023-05-08soldstatus $87,000 Sold
-
2023-04-24status Pending
-
2023-04-17historical Backup Offers Accepted
-
2023-03-16price $86,400
-
2023-03-09status Active
-
2023-02-27historical Backup Offers Accepted
-
2023-02-12$89,900 Active
-
2022-11-23historical
-
2022-10-20$89,900 Active
-
2022-05-29historical
-
2022-05-06price $89,900
-
2022-03-06price $92,500
-
2022-02-24$93,500 Active
-
2015-01-31soldstatus $22,000 Closed
-
2015-01-31soldstatus $22,000 Sold
-
2015-01-29status Pending
-
2015-01-26historical Contingent
-
2014-07-11price $22,900
-
2014-06-06price $24,500
-
2014-05-09price $25,000
-
2014-05-09price $25,500
-
2013-07-05$25,500 Active
-
2013-06-12historical
ⓘ Source: listings_history table (triggers on properties + properties_extension) + one-shot
backfill from property_details.listing_events for pre-trigger history.
Climate risk First Street
- Flood 1/10 Low FEMA zone X · 0% chance over 30 yrs
- Wildfire 5/10 Major
- Heat 9/10 Extreme 10 d/yr ≥107°F today · 28 d/yr by 30 yrs out
- Wind 1/10 Low
- Air quality 4/10 Moderate 5 unhealthy d/yr today · 6 by 30 yrs out
Nearby sold comps map
Loading sold comps map…
Walkable amenities ~0.75 mi
Loading nearby amenities…
Taxation est. · year 1
- Rental income
- $28,454
- − Mortgage interest
- −$6,162
- − Property taxes
- −$1,650
- − Insurance
- −$550
- − Repairs & maintenance
- −$2,276
- − Management
- −$2,276
- − Depreciation
- −$3,200
- Taxable income
- $12,339
- Est. tax owed @ 24.0%
- −$2,961
- After-tax cash flow
- $10,395/yr
For passive investors: Depreciation is non-cash, so a rental often shows a tax loss while cash-flowing — sheltering income. Rental losses are passive: they offset passive income freely, and up to $25,000/yr can offset ordinary (W-2) income if you actively participate and your MAGI is under $100k (phasing out to $0 by $150k); unused losses carry forward. On sale, claimed depreciation is recaptured at up to 25%, and gains may owe capital-gains tax (a 1031 exchange can defer both). Figures are a year-1 estimate at your 24.0% rate — not tax advice; consult a CPA.
Schools (NCES district)
- District
- Desert Sands Unified
- NCES district ID
- 0611110
- Math proficiency
- 31% ▼ -4.00%
- Reading proficiency
- 56% ▲ 7.00%
- Median HH income
- $54,957
- Composite
- 37.77/100
- National rank
- #4346
- State rank
- #199 of 517 in CA
Livability — Palm Desert
- Score
- 51/100
- State rank
- #1050
- US rank
- #25164
Category grades
Schools grade is shown separately in the Schools card above.
Census & demographics
- Census place
- Palm Desert, CA
- County
- Riverside County · 2,287,001 people
- City population
- 58,615
- Metro
- Riverside-San Bernardino-Ontario, CA
- Population (ZIP)
- 30,523
- Household income
- $70,091
- Rent vs Own
- Severe rent burden
- 1734.0
Population outlook (Riverside County) Hauer SSP2
- Today (2025)
- 2,664,475 people
- By 2030
- 2,802,692 · +5.2%
- By 2040
- 3,050,904 · +14.5%
- By 2050
- 3,256,783 · +22.2%
- By 2075
- 3,655,058 · +37.2%
- By 2100
- 3,766,594 · +41.4%
Race, ethnicity, and origin ACS 2023
- Neighborhood character
- Majority White (61%)
- Race & ethnicity
- White 61% Hispanic / Latino 31% Two or more races 20% Asian 4% Black 2%
- Hispanic origin (detail)
- Mexican 25%
- Common ancestry
- Italian 4% Lithuanian 3% Slovak 2%
- Foreign-born
- 18% · Canada, South Korea, Vietnam
- Languages at home
- 73% English-only · Spanish 22% French/Haitian/Cajun 1% Other Indo-European 1%
Political lean MEDSL · Riverside
- 2024 margin
- Toss-up / Even · D 48.0% · R 49.3% · Other 2.6%
- 2008→2024 swing
- -3.6pp toward R · 2008: 2.3pp · 2024: -1.3pp
- All cycles
- 2024: R+1.3 2020: D+8.0 2016: D+4.3 2012: R+0.4 2008: D+2.3
Not yet ingested
- Civics
- —
Market trends
- HPI YoY
- ▼ -364.94%
- Current HPI
- 294.9425
- Rent YoY
- ▲ 1.60%
- Metro
- Riverside-San Bernardino-Ontario, CA
- State GDP YoY
- ▲ 3.21%
- F500 in state
- 116
Industry mix (Fortune 500 HQ in CA)
| Industry | F500 HQs | Revenue |
|---|---|---|
| Technology | 27 | $1,492B |
|
||
| Financial Services | 3 | $174B |
|
||
| Retail | 3 | $44B |
|
||
| Insurance | 3 | $26B |
|
||
| Media / Entertainment | 2 | $115B |
|
||
| Pharmaceuticals / Biotech | 2 | $62B |
|
||
Price history
+267.9% since first listed42 events — show timeline
- 2026-06-01 Listed $110,000 TheMLS
- 2026-04-09 Price Changed — TheMLS
- 2026-01-12 Listed — TheMLS
- 2025-07-08 Relisted — TheMLS
- 2025-06-24 Contingent — TheMLS
- 2025-06-01 Listed — TheMLS
- 2025-05-22 Price Changed — TheMLS
- 2025-02-24 Listed — TheMLS
- 2025-02-01 Listing Removed — GPSMLS
- 2024-10-16 Price Changed $114,900 GPSMLS
- 2024-09-04 Price Changed $119,900 GPSMLS
- 2024-07-27 Relisted — GPSMLS
- 2024-07-24 Contingent — GPSMLS
- 2024-05-01 Price Changed $129,900 GPSMLS
- 2024-03-15 Listed $145,000 GPSMLS
- 2023-05-08 Sold (MLS) $87,000 TheMLS
- 2023-04-24 Pending — TheMLS
- 2023-04-17 Contingent — TheMLS
- 2023-03-16 Price Changed $86,400 TheMLS
- 2023-03-09 Relisted — TheMLS
- 2023-02-27 Contingent — TheMLS
- 2023-02-12 Listed $89,900 TheMLS
- 2022-11-23 Listing Removed — GPSMLS
- 2022-10-20 Listed $89,900 GPSMLS
- 2022-05-29 Listing Removed — GPSMLS
- 2022-05-06 Price Changed $89,900 GPSMLS
- 2022-03-06 Price Changed $92,500 GPSMLS
- 2022-02-24 Listed $93,500 GPSMLS
- 2015-01-31 Sold (MLS) $22,000 GPSMLS
- 2015-01-31 Sold (MLS) $22,000 GPSMLS
- 2015-01-29 Pending — GPSMLS
- 2015-01-26 Contingent — GPSMLS
- 2014-07-11 Price Changed $22,900 GPSMLS
- 2014-06-06 Price Changed $24,500 GPSMLS
- 2014-05-09 Price Changed $25,000 GPSMLS
- 2014-05-09 Price Changed $25,500 GPSMLS
- 2013-07-05 Listed $25,500 GPSMLS
- 2013-06-12 Listing Removed — GPSMLS
- 2012-12-28 Relisted — GPSMLS
- 2012-12-28 Pending — GPSMLS
- 2012-11-03 Price Changed $25,200 GPSMLS
- 2012-10-03 Listed $29,900 GPSMLS
Property tax history
+2.3%/yrLatest (2025): $205 · +2.3% YoY. Source: county tax records.
Cash-flow waterfall
monthlySold comps — $/sqft
last 12 mo · ≤1 miLoading sold comps…