 Fourplex
None · Alton, TX
Flood risk 4/10 · Minor
- FEMA flood zone
- —
- Chance of flooding over 30 yrs
- 0.24%
- Est. flood insurance / yr
- —
Fire risk 6/10 · Moderate
- Est. fire insurance / yr
- $1,222 – $2,270
Heat risk 9/10 · Severe
- Hot days now (above 112°F)
- 7 days/yr
- Hot days in 30 yrs
- 21 days/yr
Wind risk 8/10 · Major
- Chance of severe wind over 30 yrs
- 99.0%
Air-quality risk 2/10 · Minimal
- Unhealthy air days now
- 0 days/yr
- Unhealthy air days in 30 yrs
- 1 days/yr
Risk factors via First Street. Map © Google.
Why this score? — see what drove the C grade
The composite is a weighted blend of 9 inputs, each scored 0–100. Each bar is that input's sub-score; the figure is the points it added to the 100-point composite (weight × sub-score).
- Cash flow +15.5/30.0
- ARV discount +10.7/15.0
- Appreciation +10.0/10.0
- DSCR +4.8/10.0
- 1% rule +4.4/10.0
- Condition / age +4.0/5.0
- Rent growth +3.1/5.0
- Livability +2.9/5.0
- Schools +1.7/10.0
$459,777
🖨 Deal sheet (PDF) 📄 Offer letter ✓ Due diligence
Multi-family units
County records classify this as Multi-Family (2-4 Unit). Listing-text estimate: 4 units. confirmed
Listing remarks MLS
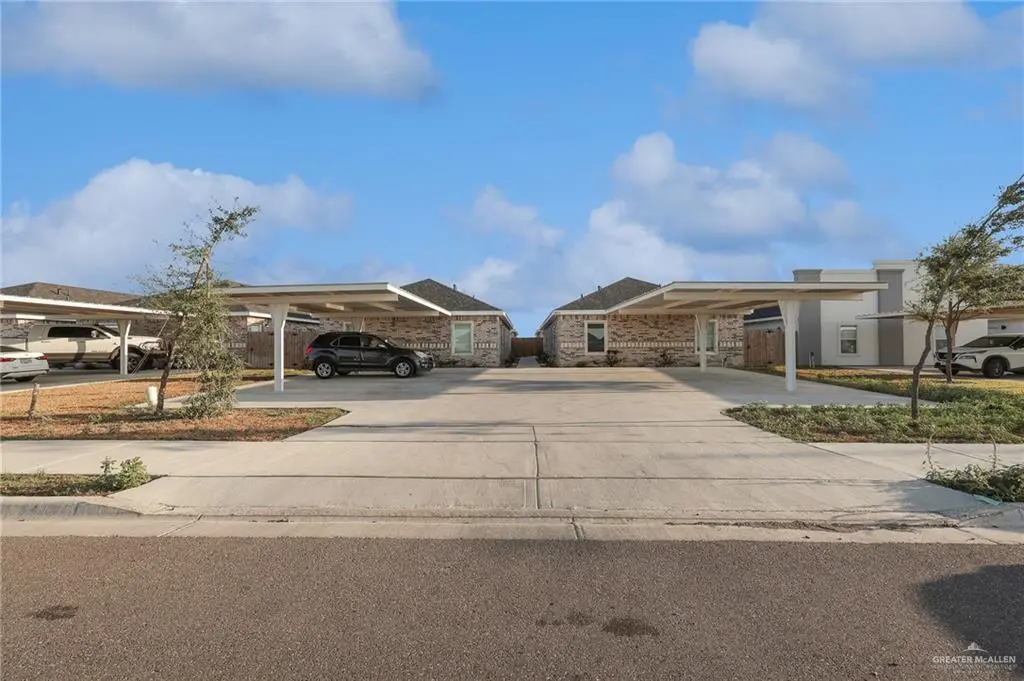
Perfect modern 4 plex to add to or start your investment portfolio! You and your tenants will feel secure and comfortable living in this stunning apartment building located in a gated community!! Enjoy the modern fixtures throughout the apartments, modern kitchens and private patio areas. All apartments come with kitchen appliances (Refrigerator and stove/oven combo) as well as with washer and dryer so you can offer that comfort and convenience to your tenants. Each unit is thoughtfully designed and well-maintained, making it an attractive option for owners to have the unique opportunity to reside on the property, making it a perfect choice for hands-on management and enjoying the community’s offerings firsthand. Seize the opportunity and start building your Real Estate empire!
Key facts
- Gated community
- Kitchen appliances
- Private patio areas
Tags
Neighborhood map
What this means for you Summary
Snapshot
- This is a 4 × 2-bed/1-bath units multifamily listed at $460k. Condition is rated good.
Deal economics
- At list price, monthly cash flow is $188 ($2k/yr) — positive. Per door: $47/mo.
- The deal already cash-flows at list — no discount required.
- To meet the 1% rule (rent ≥ 1% of price), the offer needs to be $431k (6.3% below list).
- Recommended offer: $405k (12.0% below list) — sets the bar for market timing.
- Cap rate 6.8% vs local median 2.6% in Alton — top-decile yield for the area; either an underpriced asset or a hidden risk that comps aren't pricing in. Stress-test before assuming the spread holds.
Location & tenants
- Location reads 58/100 on livability (#1,230 in TX) — a working-class tenant base; expect higher turnover. Strengths: cost of living A+, housing A; Watch: crime F, amenities F, commute F.
- Mission CISD (urban): math 15% / reading 28% proficiency, ranked #775 of 826 in TX (top 94%) — low school quality limits family demand, transient renter base, plan for 1-2y turnover; 78% free/reduced lunch — lower-income household profile, screen leases tightly.
- Zoned schools: Cantu El (math 22% / reading 32%, grade F, #2,791 of 4,322 statewide, top 68%, 417 students, 94% FRL); Alton Memorial J H (math 10% / reading 21%, grade F, #1,556 of 1,662 statewide, top 94%, 819 students, 91% FRL); Mission H S (math 18% / reading 28%, grade F, #1,348 of 1,632 statewide, top 83%, 2,218 students, 91% FRL).
- Market conditions: Rents rising (+2.5%/yr); 624 active listings in the ZIP; 10 comparable units currently listed for rent nearby; rentals at typical pace (median 25d on market — plan ~3-4 weeks tenant-placement turnaround); 40% of comp listings sitting > 30 days — soft ceiling on asking rent; 7,378 units permitted in Hidalgo County in 2024 (641 in 5+ unit buildings).
- At $4,308/mo this rent would consume 94% of the median local household income ($55k/yr) (locally 855% of renters already pay >50% of income on rent) — very limited rent-growth headroom before tenants either downsize or default.
Forward outlook
- In year one you build about $49k of equity ($3k loan paydown + $46k appreciation (10.0% local appreciation)).
- Hidalgo County population projected at +28% by 2050 — long-run rental-demand tailwind backs the buy-and-hold thesis.
- At projected returns (10.0% appreciation + 2.5% rent growth), your $129k cash investment doubles in ~3 years — after that, you're playing with house money.
- By year 2, paydown + projected appreciation supports a ~$79k cash-out refi (75% LTV) — recoverable capital for the next deal without selling this one.
Negotiation context
- It's been on market 295 days — a 12% lower offer ($405k) is reasonable based on typical stale-listing flexibility.
Risks & watch-outs
- Climate carrying-cost: severe wind risk, 99% chance of damaging wind over 30y; major wildfire risk; extreme-heat days projected 7→21/yr by 2055 (HVAC capex compounding) — expect insurance premiums to compound above CPI over the hold.
Questions for the listing agent
- It's been on market 295 days. Have you received any prior offers? Is the seller open to a 12% concession, seller financing, or rate buy-down credit?
- Can we see the unit-by-unit rent roll, current vacancy, and any below-market leases? What's the average tenancy length?
- What capital expenditures (roof, boiler, parking lot, exteriors) have been made in the last 5 years, and what's planned in the next 2?
- What does the HOA fee cover, when was the last increase, and are there any pending special assessments or reserve-fund shortfalls?
- Why hasn't it sold? Are there any deal-killer items the seller is aware of (foundation, flood, title, zoning, code violations)?
- Is there a deadline driving the sale (1031 exchange, divorce, estate, relocation)? That informs how much negotiation room exists.
- Schools are F-rated, which usually means shorter tenancies and higher turnover. Who's the typical renter profile here, and what's been the actual vacancy rate?
- Crime grade is F in this area — have there been break-ins, vandalism, or insurance claims at this property in the last 3 years? What carrier currently insures it and at what premium?
- What's the average days-on-market for RENTAL listings here right now (not sales)? A rising rental-DOM trend means longer vacancies and softer asking-rent achievability than the comps imply.
- What's the recent tenant-quality profile in this submarket — average credit score on applications, eviction rate, late-payment / NSF rate, and stable-employment percentage? A property-management company in the area should have these aggregated.
- How much new apartment / multifamily construction is in the pipeline within 1–3 miles? Heavy new supply (>2% of stock underway) typically softens rents 12–24 months out; light construction supports rent growth.
Investment metrics
- 1% rule
- 0.94% ✗
- Cap rate
- 6.78%
- Cash-on-cash
- 1.75%
- DSCR
- 1.08
- GRM
- 8.9
CMA / ARV
- ARV (median comp)
- $495,224
- List price
- $459,777
- Delta
- -7.16%
- Verdict
- FAIR
- Comps
- 20 within 1.0 mi
Show comp detail 12 sales within ~0.75 mi
| Address | Dist | Beds/Ba | Sqft | Sold | Price | $/sf | Match |
|---|---|---|---|---|---|---|---|
| 1000 Kohala Ave | 0.05mi | —/— | 3,540 (-5%) | 2mo | $390,000 | $110 | 88 |
| 913 W Mahala Ave | 0.11mi | —/— | 3,600 (-3%) | 15mo | $495,000 | $138 | 77 |
| 1005 W Mahala Ave | 0.06mi | —/— | 3,644 (-2%) | 20mo | $485,000 | $133 | 77 |
| 904 Mahala Ave | 0.11mi | —/— | 3,636 (-2%) | 22mo | $479,500 | $132 | 72 |
| 908 Kentucky St | 0.16mi | —/— | 4,032 (+8%) | 10mo | $480,000 | $119 | 70 |
| 808 W Sunset Valley St | 0.21mi | —/— | 4,032 (+8%) | 14mo | $475,000 | $118 | 64 |
| 804 W Sunset Valley St | 0.22mi | —/— | 4,032 (+8%) | 14mo | $475,000 | $118 | 64 |
| 311 W Campeche Ave | 0.52mi | —/— | 4,180 (+12%) | 3mo | $469,000 | $112 | 53 |
| 220 W Campeche Ave | 0.57mi | —/— | 4,110 (+10%) | 6mo | $490,000 | $119 | 51 |
| 320 W Campeche Ave | 0.38mi | —/— | 4,100 (+10%) | 22mo | $500,000 | $122 | 47 |
| 115 W Campeche Ave | 0.65mi | —/— | 4,034 (+8%) | 23mo | $525,000 | $130 | 37 |
| 120 W Diamond Ave | 0.68mi | —/— | 4,200 (+13%) | 17mo | $520,000 | $124 | 32 |
Match score weights: distance 35% · size 25% · config 20% · recency 20%. Top-matched comps best support the ARV.
Projected returns pro-forma
10.0% appreciation · 2.45% rent growth · sell at horizon
- IRR
- 25.3%
- Equity multiple
- 3.02×
- Total profit
- $260,092
- Equity at exit
- $414,204
- IRR
- 22.2%
- Equity multiple
- 6.84×
- Total profit
- $751,987
- Equity at exit
- $893,246
Cash invested: $128,738 (down + closing). Projections, not guarantees.
Landlord ↔ Tenant lean methodology
- Overall (STATE)
- 87 Strongly Landlord-Friendly
- State Texas
- 87 Strongly Landlord-Friendly · R+5
- County
- — inherits STATE
- City
- — inherits STATE
ZIP-level market 78573
- Home prices YoY
- 8.0%
- Rents YoY
- 2.5%
- Active inventory
- 624
- Price-to-rent
- 35.6×
Monthly cashflow live
- Estimated rent
- $4,308 high interval (Pro) →
- Mortgage (P&I)
- −$2,411
- Tax est. 1.5%
- −$575 /mo · $6,897/yr
- Insurance
- −$192
- HOA
- −$38
- Vacancy / Maint / Mgmt
- −$905
- Net cashflow
- $188
Break-even live
Sensitivity live
| Price | -10% $506 | -5% $347 | +0% $188 | +5% $29 | +10% $-130 |
|---|---|---|---|---|---|
| Rent | -10% $-152 | -5% $18 | +0% $188 | +5% $358 | +10% $528 |
| Rate | -1.0pp $419 | -0.5pp $305 | base $188 | +0.5pp $69 | +1.0pp $-52 |
4-unit breakdown (identical units grouped — click to expand)
| Units | Beds | Baths | Est. rent |
|---|---|---|---|
| 4× units | 2 | 1 | $4,308 |
| #1 | 2 | 1 | $1,077 |
| #2 | 2 | 1 | $1,077 |
| #3 | 2 | 1 | $1,077 |
| #4 | 2 | 1 | $1,077 |
| Total (4 units) | $4,308 | ||
UW: 25.0% down · 7.5% · 30yr · 1.5% tax · 5.0% vac · 8.0% maint · 8.0% mgmt
Financing live
Cash to close
- Down payment
- $114,944
- Closing costs
- $13,793
- Reserves months
- —
- Total cash needed
- —
Loan-product check · same deal, 3 products live
Conventional
25% down · 7.5% · 30yr
- Down + closing
- —
- Monthly P&I
- —
- Monthly cashflow
- —
- DSCR
- —
- Eligible?
- —
Personal DTI + credit; lowest rate.
DSCR
20% down · 8.5% · 30yr
- Down + closing
- —
- Monthly P&I
- —
- Monthly cashflow
- —
- DSCR
- —
- Eligible?
- —
No personal income docs; deal must DSCR.
Hard money
10% down · 12.0% · 12mo
- Down + closing
- —
- Monthly P&I
- —
- Monthly cashflow
- —
- DSCR
- —
- Eligible?
- —
Short-term bridge; refi at stabilization.
Rent comps 10 comps
| Address | Beds | Baths | Sqft | Rent | $/sqft | DOM | Units | Dist |
|---|---|---|---|---|---|---|---|---|
| 1008 W Kohala Ave Unit 4 Alton, TX | 2.0 | 2.0 | 3596 | $1,100 | $0.31 | 25d | 1 | 0.04mi |
| 913 W Kohala Ave #3 Mission, TX | 2.0 | 2.0 | 4354 | $975 | $0.22 | 15d | 1 | 0.09mi |
| 1101 W Sunset Valley St Unit 3 Alton, TX | 2.0 | 2.0 | 4032 | $1,000 | $0.25 | 25d | 1 | 0.13mi |
| 812 N Kentucky St Unit 2 Alton, TX | 3.0 | 2.0 | 4032 | $1,050 | $0.26 | 45d | 1 | 0.15mi |
| 810 N Missouri St Unit 2 Alton, TX | 2.0 | 2.0 | 3960 | $950 | $0.24 | 45d | 1 | 0.31mi |
| 312 W Campeche Ave Unit 3 Alton, TX | 2.0 | 2.0 | 4050 | $1,000 | $0.25 | 25d | 1 | 0.39mi |
| 116 W Campeche Ave Mission, TX | 2.0 | 2.0 | 4050 | $1,100 | $0.27 | 25d | 1 | 0.67mi |
| 312 E Campeche St Unit 4 Alton, TX | 3.0 | 2.0 | 4050 | $1,165 | $0.29 | 45d | 1 | 0.91mi |
| 825 S Michigan St Mission, TX | 2.0 | 1.5 | 4144 | $685 | $0.17 | 25d | 1 | 1.02mi |
| 1404 W Harrison Ave Unit 3 Alton, TX | 3.0 | 2.0 | 4320 | $1,100 | $0.25 | 45d | 1 | 1.07mi |
HOA detail
- Monthly dues
- $38 · $456/yr
- Likely covers
- security
Listing history 16 events
-
2026-06-21days on market $459,777 Active 295 DOM
-
2026-06-18days on market $459,777 Active 292 DOM
-
2026-06-17days on market $459,777 Active 291 DOM
-
2026-06-16days on market $459,777 Active 290 DOM
-
2026-06-15days on market $459,777 Active 289 DOM
-
2026-06-14days on market $459,777 Active 287 DOM
-
2026-06-10days on market $459,777 Active 284 DOM
-
2026-06-09days on market $459,777 Active 283 DOM
-
2026-06-08days on market $459,777 Active 282 DOM
-
2026-06-07days on market $459,777 Active 281 DOM
-
2026-06-03days on market $459,777 Active 277 DOM
-
2026-06-02days on market $459,777 Active 276 DOM
-
2026-06-01days on market $459,777 Active 275 DOM
-
2026-05-31days on market $459,777 Active 274 DOM
-
2026-05-31days on market $459,777 Active 273 DOM
-
2025-08-30$459,777 Active 794-char remark
Show marketing remark (794 chars)
Perfect modern 4 plex to add to or start your investment portfolio! You and your tenants will feel secure and comfortable living in this stunning apartment building located in a gated community!! Enjoy the modern fixtures throughout the apartments, modern kitchens and private patio areas. All apartments come with kitchen appliances (Refrigerator and stove/oven combo) as well as with washer and dryer so you can offer that comfort and convenience to your tenants. Each unit is thoughtfully designed and well-maintained, making it an attractive option for owners to have the unique opportunity to reside on the property, making it a perfect choice for hands-on management and enjoying the community’s offerings firsthand. Seize the opportunity and start building your Real Estate empire!
ⓘ Source: listings_history table (triggers on properties + properties_extension) + one-shot
backfill from property_details.listing_events for pre-trigger history.
Climate risk First Street
- Flood 4/10 Moderate 24% chance over 30 yrs
- Wildfire 6/10 Major
- Heat 9/10 Extreme 7 d/yr ≥112°F today · 21 d/yr by 30 yrs out
- Wind 8/10 Severe 99% chance of damaging wind over 30 yrs
- Air quality 2/10 Low 0 unhealthy d/yr today · 1 by 30 yrs out
Nearby sold comps map
Loading sold comps map…
Walkable amenities ~0.75 mi
Loading nearby amenities…
Taxation est. · year 1
- Rental income
- $51,696
- − Mortgage interest
- −$25,755
- − Property taxes
- −$6,897
- − Insurance
- −$2,299
- − Repairs & maintenance
- −$4,136
- − Management
- −$4,136
- − HOA
- −$456
- − Depreciation
- −$13,375
- Taxable loss
- −$5,357
- Est. tax savings @ 24.0%
- +$1,286
- After-tax cash flow
- $3,541/yr
For passive investors: Depreciation is non-cash, so a rental often shows a tax loss while cash-flowing — sheltering income. Rental losses are passive: they offset passive income freely, and up to $25,000/yr can offset ordinary (W-2) income if you actively participate and your MAGI is under $100k (phasing out to $0 by $150k); unused losses carry forward. On sale, claimed depreciation is recaptured at up to 25%, and gains may owe capital-gains tax (a 1031 exchange can defer both). Figures are a year-1 estimate at your 24.0% rate — not tax advice; consult a CPA.
Condition & rehab AI · 12 photos
This modern 4plex is in excellent condition with minimal repairs needed. It offers a great investment opportunity with high rental potential.
Value-add opportunities
- Both Landscaping and curb appeal improvements — Enhances the home's aesthetic appeal and can attract more tenants.
- Both Painting interior walls — Fresh paint can make the home more inviting and can increase both resale and rental value.
- Both Landscaping and curb appeal improvements — Enhances the home's aesthetic appeal and can attract more tenants.
Renovation cost estimate screening
Value-add ROI direction
- Both Landscaping and curb appeal improvements — Enhances the home's aesthetic appeal and can attract more tenants. ↑
- Both Painting interior walls — Fresh paint can make the home more inviting and can increase both resale and rental value. ↑
- Both Landscaping and curb appeal improvements — Enhances the home's aesthetic appeal and can attract more tenants. ↑
ⓘ Cost ranges are severity-bucket heuristics (US national rule-of-thumb). Get contractor quotes + a written scope before underwriting a rehab budget.
Schools (NCES district)
- District
- Mission CISD
- NCES district ID
- 4831040
- Math proficiency
- 15% ▼ -35.00%
- Reading proficiency
- 28% ▼ -15.00%
- Median HH income
- $32,855
- Composite
- 17.47/100
- National rank
- #9061
- State rank
- #775 of 826 in TX
Livability — Alton
- Score
- 58/100
- State rank
- #1230
- US rank
- #21479
Category grades
Schools grade is shown separately in the Schools card above.
Census & demographics
- Census place
- Alton, TX
- County
- Hidalgo County · 623,128 people
- City population
- 44,809
- Metro
- McAllen-Edinburg-Mission, TX
- Population (ZIP)
- 44,809
- Household income
- $55,000
- Rent vs Own
- Severe rent burden
- 855.0
Population outlook (Hidalgo County) Hauer SSP2
- Today (2025)
- 955,232 people
- By 2030
- 1,009,774 · +5.7%
- By 2040
- 1,120,332 · +17.3%
- By 2050
- 1,225,036 · +28.2%
- By 2075
- 1,439,189 · +50.7%
- By 2100
- 1,533,429 · +60.5%
Race, ethnicity, and origin ACS 2023
- Neighborhood character
- Predominantly Hispanic (96%)
- Race & ethnicity
- Hispanic / Latino 96% Two or more races 63% White 3%
- Hispanic origin (detail)
- Mexican 94%
- Foreign-born
- 28% · Canada
- Languages at home
- 12% English-only · Spanish 88%
Political lean MEDSL · Hidalgo
- 2024 margin
- Toss-up / Even · D 48.1% · R 51.0%
- 2008→2024 swing
- -41.6pp toward R · 2008: 38.7pp · 2024: -2.9pp
- All cycles
- 2024: R+2.9 2020: D+17.1 2016: D+40.5 2012: D+41.8 2008: D+38.7
Not yet ingested
- Civics
- —
Market trends
- HPI YoY
- ▲ 17.95%
- Current HPI
- 242.0711
- Rent YoY
- ▲ 2.45%
- Metro
- McAllen-Edinburg-Mission, TX
- State GDP YoY
- ▲ 3.95%
- F500 in state
- 110
Industry mix (Fortune 500 HQ in TX)
| Industry | F500 HQs | Revenue |
|---|---|---|
| Energy | 16 | $1,198B |
|
||
| Technology | 5 | $198B |
|
||
| Engineering / Construction | 4 | $72B |
|
||
| Energy Services | 3 | $60B |
|
||
| Utilities | 3 | $41B |
|
||
| Healthcare | 2 | $330B |
|
||
Price history
1 event — show timeline
- 2025-08-30 Listed $459,777 MCALLENMLS
Cash-flow waterfall
monthlySold comps — $/sqft
last 12 mo · ≤1 miLoading sold comps…