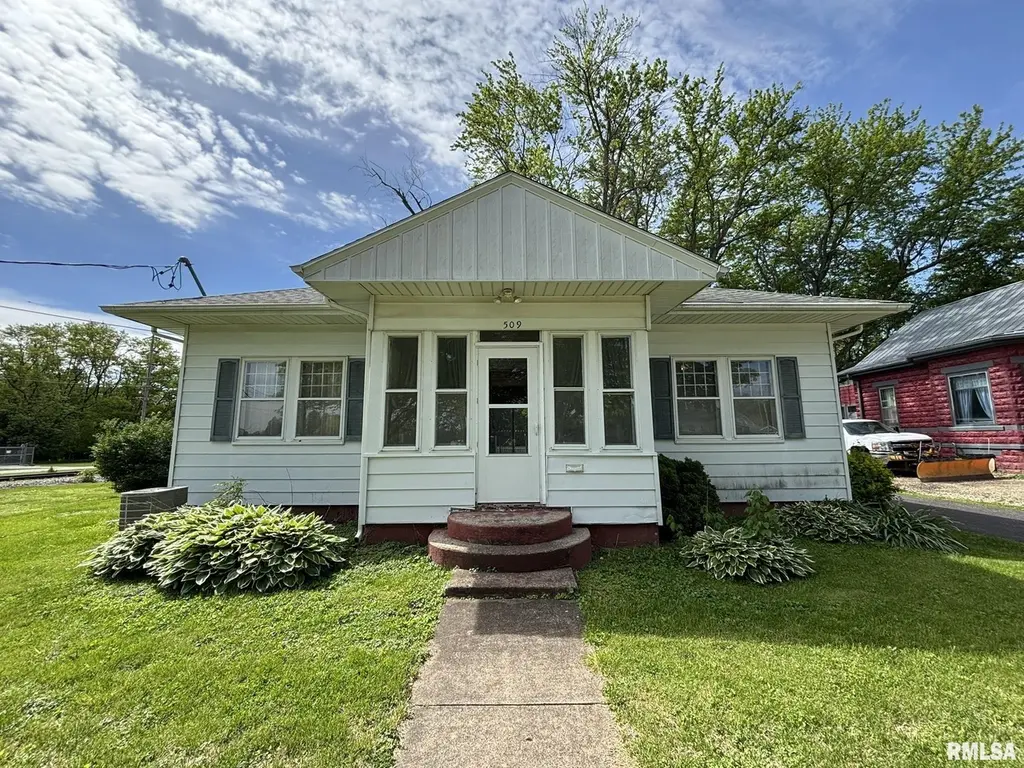
509 E Milton Ave · Lewistown, IL
Flood risk 1/10 · Minimal
- FEMA flood zone
- X (unshaded)
- Chance of flooding over 30 yrs
- 0.0%
- Est. flood insurance / yr
- $473 – $860
Fire risk 1/10 · Minimal
- Est. fire insurance / yr
- $804 – $1,492
Heat risk 3/10 · Minor
- Hot days now (above 106°F)
- 7 days/yr
- Hot days in 30 yrs
- 19 days/yr
Wind risk 2/10 · Minimal
- Chance of severe wind over 30 yrs
- —
Air-quality risk 2/10 · Minimal
- Unhealthy air days now
- 1 days/yr
- Unhealthy air days in 30 yrs
- 1 days/yr
Risk factors via First Street. Map © Google.
Why this score? — see what drove the B grade
The composite is a weighted blend of 9 inputs, each scored 0–100. Each bar is that input's sub-score; the figure is the points it added to the 100-point composite (weight × sub-score).
- Cash flow +30.0/30.0
- DSCR +10.0/10.0
- 1% rule +9.2/10.0
- ARV discount +7.8/15.0
- Appreciation +4.0/10.0
- Livability +3.2/5.0
- Rent growth +2.5/5.0
- Condition / age +2.5/5.0
- Schools +1.1/10.0
$79,500
🖨 Deal sheet 📄 Offer letter ✓ Due diligence
Listing remarks
Ranch style 3 Bedroom 1 bath. Small corridor when you first walk in. Spacious living room. Beautiful hardwood floors throughout the house. Formal dining room. Eat-in kitchen with a kitchen nook for an additional eating space. Laundry room/mudroom. Large composite deck in the back. Long blacktop driveway with access to 1 car garage. Pergola with picnic table. Washer and dryer stay. Refrigerator stays. Oven stays. All work benches in garage stay (all tools will go) Property being sold as part of estate and being sold As-is Come check this one out!
Key facts
- Formal dining room
- Laundry room
- Eat-in kitchen
Tags
Property features AI
Finance
- Other: Lot dimensions approximately 60' x 130'
- HOA & community: No association fees
Exterior
- Parking: Detached 1-car garage
- Utilities: Public water; Public sewer
- Home design: Single-family residence; Residential zoning
- Construction: Shingle roof; Building area approximately 1260 (living area); Year built not specified
- Exterior features: Level lot; Paved road access
Interior
- Kitchen: Refrigerator included
- Bedrooms: 3 bedrooms (one on main level, others on upper, lower/basement/additional levels); All three main-level bedrooms have egress windows
- Flooring: Hardwood flooring in living spaces and bedrooms; Other flooring types in kitchen/dining areas
- Bathrooms: 1 full bathroom
- Heating & cooling: Central air conditioning; Forced air heating
- Interior features: Partial, unfinished basement; No fireplaces
- Laundry & utility: Washer and dryer included; Dedicated laundry room on main level
Neighborhood map
What this means for you Summary
Snapshot
- This is a 3-bed/1.0-bath other listed at $80k.
Deal economics
- At list price, monthly cash flow is $337 ($4k/yr) — positive.
- The deal already cash-flows at list — no discount required.
- Meets the 1% rule at list price ($1k rent vs $80k).
- Recommended offer: $77k (3.0% below list) — sets the bar for market timing.
Location & tenants
- Location reads 63/100 on livability (#756 in IL) — a middle-class / working-renter tenant base. Strengths: cost of living A+, housing A+, crime A; Watch: amenities F, commute F, employment D-.
- Lewistown CUSD 97 (rural): math 11% / reading 14% proficiency, ranked #546 of 620 in IL (top 88%) — low school quality limits family demand, transient renter base, plan for 1-2y turnover.
- Zoned schools: Lewistown Jr/Sr High School (math 12% / reading 17%, grade F, #479 of 693 statewide, top 71%, 276 students, 0% FRL) — zoned schools average 0% FRL vs 50% district-wide (50 pts lower); this property's tenant base skews higher-income than the district average.
- Market conditions: 22 active listings in the ZIP; 14 units permitted in Fulton County in 2024 (0 in 5+ unit buildings).
Forward outlook
- Local home prices are declining (-2.0%/yr); year-one equity from $550 of loan paydown is wiped out by about $2k of value loss. Plan a longer hold.
- Fulton County population projected at -20% by 2050 — secular population decline; favor cash flow + early exit over multi-decade hold.
- At projected returns (-2.0% appreciation + 3.0% rent growth), your $22k cash investment doubles in ~6 years — after that, you're playing with house money.
Negotiation context
- It's been on market 43 days — a 3% lower offer ($77k) is reasonable based on typical stale-listing flexibility.
Questions for the listing agent
- It's been on market 43 days. Have you received any prior offers? Is the seller open to a 3% concession, seller financing, or rate buy-down credit?
- Is there a deadline driving the sale (1031 exchange, divorce, estate, relocation)? That informs how much negotiation room exists.
- Schools are F-rated, which usually means shorter tenancies and higher turnover. Who's the typical renter profile here, and what's been the actual vacancy rate?
- What's the average days-on-market for RENTAL listings here right now (not sales)? A rising rental-DOM trend means longer vacancies and softer asking-rent achievability than the comps imply.
- What's the recent tenant-quality profile in this submarket — average credit score on applications, eviction rate, late-payment / NSF rate, and stable-employment percentage? A property-management company in the area should have these aggregated.
- How much new for-sale + rental construction is in the pipeline within 1–3 miles? Heavy new supply typically softens prices + rents 12–24 months out; constrained supply supports both.
Investment metrics
- 1% rule
- 1.42% ✓
- Cap rate
- 11.38%
- Cash-on-cash
- 18.17%
- DSCR
- 1.81
- GRM
- 5.9
CMA / ARV
- ARV (median comp)
- $79,990
- List price
- $79,500
- Delta
- -0.61%
- Verdict
- FAIR
- Comps
- 20 within 1.0 mi
Projected returns pro-forma
-1.97% appreciation · 3.0% rent growth · sell at horizon
- IRR
- 12.8%
- Equity multiple
- 1.54×
- Total profit
- $12,079
- Equity at exit
- $15,550
- IRR
- 20.1%
- Equity multiple
- 2.86×
- Total profit
- $41,341
- Equity at exit
- $13,393
Cash invested: $22,260 (down + closing). Projections, not guarantees.
Landlord ↔ Tenant lean methodology
- Overall (STATE)
- 43 Moderately Tenant-Leaning
- State Illinois
- 43 Moderately Tenant-Leaning · D+7
- County
- — inherits STATE
- City
- — inherits STATE
ZIP-level market 61542
- Home prices YoY
- -1.3%
- Active inventory
- 22
- Price-to-rent
- 5.9×
Monthly cashflow live
- Estimated rent
- $1,125 medium interval (Pro) →
- Mortgage (P&I)
- −$417
- Tax from tax record
- −$102 /mo · $1,220/yr
- Insurance
- −$33
- HOA
- −$0
- Vacancy / Maint / Mgmt
- −$236
- Net cashflow
- $337
Break-even live
UW: 25.0% down · 7.5% · 30yr · 1.5% tax · 5.0% vac · 8.0% maint · 8.0% mgmt
Financing live
Cash to close
- Down payment
- $19,875
- Closing costs
- $2,385
- Reserves months
- —
- Total cash needed
- —
Loan-product check · same deal, 3 products live
Conventional
25% down · 7.5% · 30yr
- Down + closing
- —
- Monthly P&I
- —
- Monthly cashflow
- —
- DSCR
- —
- Eligible?
- —
Personal DTI + credit; lowest rate.
DSCR
20% down · 8.5% · 30yr
- Down + closing
- —
- Monthly P&I
- —
- Monthly cashflow
- —
- DSCR
- —
- Eligible?
- —
No personal income docs; deal must DSCR.
Hard money
10% down · 12.0% · 12mo
- Down + closing
- —
- Monthly P&I
- —
- Monthly cashflow
- —
- DSCR
- —
- Eligible?
- —
Short-term bridge; refi at stabilization.
Listing history 16 events
-
2026-06-18days on market $79,500 Active 43 DOM
-
2026-06-17days on market $79,500 Active 42 DOM
-
2026-06-16days on market $79,500 Active 41 DOM
-
2026-06-15days on market $79,500 Active 40 DOM
-
2026-06-13days on market $79,500 Active 38 DOM
-
2026-06-12days on market $79,500 Active 37 DOM
-
2026-06-09days on market $79,500 Active 34 DOM
-
2026-06-08days on market $79,500 Active 33 DOM
-
2026-06-07days on market $79,500 Active 32 DOM
-
2026-06-07days on market $79,500 Active 31 DOM
-
2026-06-04days on market $79,500 Active 28 DOM
-
2026-06-02days on market $79,500 Active 27 DOM
-
2026-06-01days on market $79,500 Active 26 DOM
-
2026-05-31days on market $79,500 Active 25 DOM
-
2026-05-31days on market $79,500 Active 24 DOM
-
2026-05-06$79,500 Active 552-char remark
ⓘ Source: listings_history table (triggers on properties + properties_extension) + one-shot
backfill from property_details.listing_events for pre-trigger history.
Tax reassessment forecast IL · Partial reset (capped growth)
- Current annual tax
- $1,220 · $102/mo
- Projected year-2 tax
- $1,512 · $126/mo
- Expected delta
- +$293/yr (+$24/mo · 24.0%)
ⓘ Screening estimate from a state-policy table — verify with the county assessor before closing.
Climate risk First Street
- Flood 1/10 Low FEMA zone X (unshaded) · 0% chance over 30 yrs
- Wildfire 1/10 Low
- Heat 3/10 Moderate 7 d/yr ≥106°F today · 19 d/yr by 30 yrs out
- Wind 2/10 Low
- Air quality 2/10 Low 1 unhealthy d/yr today · 1 by 30 yrs out
Nearby sold comps map
Loading sold comps map…
Walkable amenities ~0.75 mi
Loading nearby amenities…
Taxation est. · year 1
- Rental income
- $13,500
- − Mortgage interest
- −$4,453
- − Property taxes
- −$1,220
- − Insurance
- −$398
- − Repairs & maintenance
- −$1,080
- − Management
- −$1,080
- − Depreciation
- −$2,313
- Taxable income
- $2,957
- Est. tax owed @ 24.0%
- −$710
- After-tax cash flow
- $3,335/yr
For passive investors: Depreciation is non-cash, so a rental often shows a tax loss while cash-flowing — sheltering income. Rental losses are passive: they offset passive income freely, and up to $25,000/yr can offset ordinary (W-2) income if you actively participate and your MAGI is under $100k (phasing out to $0 by $150k); unused losses carry forward. On sale, claimed depreciation is recaptured at up to 25%, and gains may owe capital-gains tax (a 1031 exchange can defer both). Figures are a year-1 estimate at your 24.0% rate — not tax advice; consult a CPA.
Schools (NCES district)
- District
- Lewistown CUSD 97
- NCES district ID
- 1700153
- Math proficiency
- 11% ▼ -5.00%
- Reading proficiency
- 14% ▼ -8.00%
- Median HH income
- $45,704
- Composite
- 11.28/100
- National rank
- #9719
- State rank
- #546 of 620 in IL
Livability — Lewistown
- Score
- 63/100
- State rank
- #756
- US rank
- #15307
Category grades
Schools grade is shown separately in the Schools card above.
Census & demographics
- Census place
- Lewistown, IL
- Population (ZIP)
- 3,306
Population outlook (Fulton County) Hauer SSP2
- Today (2025)
- 33,356 people
- By 2030
- 32,144 · -3.6%
- By 2040
- 29,518 · -11.5%
- By 2050
- 26,775 · -19.7%
- By 2075
- 19,972 · -40.1%
- By 2100
- 13,580 · -59.3%
Race, ethnicity, and origin ACS 2023
- Neighborhood character
- Predominantly White (96%)
- Race & ethnicity
- White 96% Asian 2% Two or more races 2%
- Common ancestry
- Lithuanian 3% Portuguese 2% Iranian 2%
- Foreign-born
- 2% · China
- Languages at home
- 98% English-only · Chinese 1%
Political lean MEDSL · Fulton
- 2024 margin
- Strong R (+23.8) · D 37.1% · R 60.9% · Other 2.0%
- 2008→2024 swing
- -45.2pp toward R · 2008: 21.3pp · 2024: -23.8pp
- All cycles
- 2024: R+23.8 2020: R+20.1 2016: R+15.1 2012: D+11.1 2008: D+21.3
Not yet ingested
- Civics
- —
Market trends
- HPI YoY
- ▼ -1.97%
- Current HPI
- 146.1702
- Rent YoY
- —
- Metro
- —
- State GDP YoY
- ▲ 1.59%
- F500 in state
- 60
Industry mix (Fortune 500 HQ in IL)
| Industry | F500 HQs | Revenue |
|---|---|---|
| Insurance | 4 | $201B |
|
||
| Consumer Goods | 4 | $87B |
|
||
| Industrial Machinery | 3 | $64B |
|
||
| Healthcare | 2 | $55B |
|
||
| Retail / Pharmacy | 1 | $148B |
|
||
| Agriculture / Food | 1 | $86B |
|
||
Price history
1 event — show timeline
- 2026-05-06 Listed $79,500 RMLSA as Distributed by MLS Grid
Property tax history
+3.0%/yrLatest (2024): $1,220 · -7.1% YoY. Source: county tax records.
Cash-flow waterfall
monthlySold comps — $/sqft
last 12 mo · ≤1 miLoading sold comps…