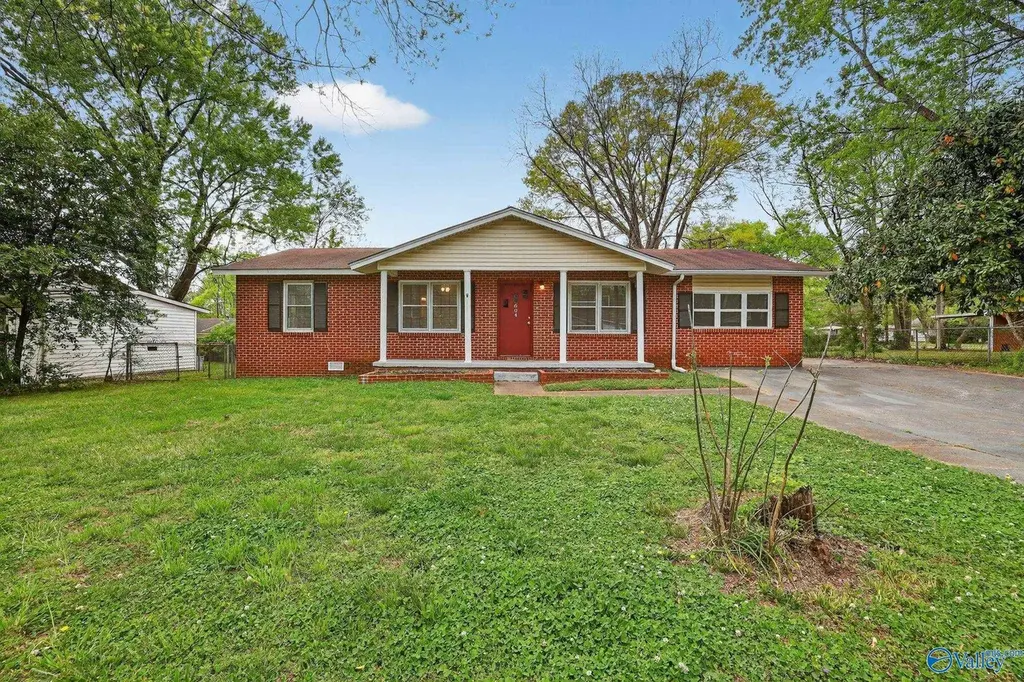
604 Murray Rd NW · Huntsville, AL
Flood risk 1/10 · Minimal
- FEMA flood zone
- X (unshaded)
- Chance of flooding over 30 yrs
- 0.0%
- Est. flood insurance / yr
- $507 – $1,088
Fire risk 1/10 · Minimal
- Est. fire insurance / yr
- $916 – $1,700
Heat risk 5/10 · Moderate
- Hot days now (above 104°F)
- 7 days/yr
- Hot days in 30 yrs
- 18 days/yr
Wind risk 4/10 · Minor
- Chance of severe wind over 30 yrs
- 18.0%
Air-quality risk 2/10 · Minimal
- Unhealthy air days now
- 1 days/yr
- Unhealthy air days in 30 yrs
- 1 days/yr
Risk factors via First Street. Map © Google.
Why this score? — see what drove the B- grade
The composite is a weighted blend of 9 inputs, each scored 0–100. Each bar is that input's sub-score; the figure is the points it added to the 100-point composite (weight × sub-score).
- Cash flow +23.6/30.0
- ARV discount +15.0/15.0
- DSCR +7.6/10.0
- 1% rule +5.2/10.0
- Rent growth +4.2/5.0
- Livability +4.1/5.0
- Schools +2.9/10.0
- Condition / age +2.5/5.0
- Appreciation +1.4/10.0
$149,900
🖨 Deal sheet 📄 Offer letter ✓ Due diligence
Listing remarks MLS
Charming single-family home in a convenient Huntsville location! Features a spacious living room, formal dining area, updated kitchen, 3 bedrooms, and 1.5 baths. Enjoy a private backyard and mature landscaping. Close to schools, shopping, parks, and downtow n Huntsville. Perfect for comfortable family living.
Key facts
- Close to parks
- Close to schools
- Private backyard
Tags
Neighborhood map
What this means for you Summary
Snapshot
- This is a 3-bed/1.0-bath single-family listed at $150k.
Deal economics
- At list price, monthly cash flow is $283 ($3k/yr) — positive.
- The deal already cash-flows at list — no discount required.
- Meets the 1% rule at list price ($2k rent vs $150k).
- Recommended offer: $141k (6.0% below list) — sets the bar for market timing.
- Cap rate 8.6% vs local median 3.8% in Huntsville — top-decile yield for the area; either an underpriced asset or a hidden risk that comps aren't pricing in. Stress-test before assuming the spread holds.
Location & tenants
- Location reads 82/100 on livability (#3 in AL, #1,082 nationally) — a professional / high-income tenant draw. Strengths: commute A+, cost of living A+, housing A+; Watch: crime F.
- Huntsville City (urban): math 21% / reading 46% proficiency, ranked #48 of 129 in AL (top 37%) — families likely to look elsewhere, expect single-tenant / working-renter base with shorter leases.
- Market conditions: Rents rising fast (+6.8%/yr); 560 active listings in the ZIP; 31 comparable units currently listed for rent nearby; rentals lingering (median 44d on market — plan ~5-8 weeks vacancy on turnover, expect pricing pressure); 65% of comp listings sitting > 30 days — soft ceiling on asking rent; solid renter incomes; 4,709 units permitted in Madison County in 2024 (1,186 in 5+ unit buildings).
Forward outlook
- Local home prices are declining (-3.0%/yr); year-one equity from $1k of loan paydown is wiped out by about $4k of value loss. Plan a longer hold.
- Madison County population projected at +18% by 2050 — long-run rental-demand tailwind backs the buy-and-hold thesis.
- At projected returns (-3.0% appreciation + 6.8% rent growth), your $42k cash investment doubles in ~9 years — after that, you're playing with house money.
Negotiation context
- It's been on market 69 days — a 6% lower offer ($141k) is reasonable based on typical stale-listing flexibility.
Risks & watch-outs
- Climate carrying-cost: extreme-heat days projected 7→18/yr by 2055 (HVAC capex compounding) — expect insurance premiums to compound above CPI over the hold.
Questions for the listing agent
- It's been on market 69 days. Have you received any prior offers? Is the seller open to a 6% concession, seller financing, or rate buy-down credit?
- Built in 1960 — when were the roof, HVAC, electrical panel, plumbing, and water heater last replaced?
- Why hasn't it sold? Are there any deal-killer items the seller is aware of (foundation, flood, title, zoning, code violations)?
- Is there a deadline driving the sale (1031 exchange, divorce, estate, relocation)? That informs how much negotiation room exists.
- Crime grade is F in this area — have there been break-ins, vandalism, or insurance claims at this property in the last 3 years? What carrier currently insures it and at what premium?
- What's the average days-on-market for RENTAL listings here right now (not sales)? A rising rental-DOM trend means longer vacancies and softer asking-rent achievability than the comps imply.
- What's the recent tenant-quality profile in this submarket — average credit score on applications, eviction rate, late-payment / NSF rate, and stable-employment percentage? A property-management company in the area should have these aggregated.
- How much new for-sale + rental construction is in the pipeline within 1–3 miles? Heavy new supply typically softens prices + rents 12–24 months out; constrained supply supports both.
Investment metrics
- 1% rule
- 1.02% ✓
- Cap rate
- 8.56%
- Cash-on-cash
- 8.09%
- DSCR
- 1.36
- GRM
- 8.2
CMA / ARV
- ARV (median comp)
- $181,297
- List price
- $149,900
- Delta
- -17.32%
- Verdict
- UNDERPRICED
- Comps
- 20 within 1.0 mi
Show comp detail 12 sales within ~0.75 mi
| Address | Dist | Beds/Ba | Sqft | Sold | Price | $/sf | Match |
|---|---|---|---|---|---|---|---|
| 608 Murray Rd | 0.03mi | 4/2.0 (+1) | 1,535 (-8%) | 5mo | $210,000 | $137 | 73 |
| 448 N Edgemont Cir | 0.45mi | 3/2.0 | 1,716 (+3%) | 4mo | $208,000 | $121 | 67 |
| 600 Ofallon Rd | 0.05mi | 4/2.0 (+1) | 1,461 (-12%) | 3mo | $156,500 | $107 | 66 |
| 641 Dawson Ter | 0.28mi | 3/2.0 | 1,506 (-9%) | 10mo | $155,000 | $103 | 59 |
| 308 Plymouth Rd | 0.49mi | 4/2.0 (+1) | 1,698 (+2%) | 7mo | $199,900 | $118 | 59 |
| 611 Glasgow Rd | 0.11mi | 3/2.0 | 1,419 (-15%) | 9mo | $195,000 | $137 | 59 |
| 602 Ofallon Rd NW | 0.05mi | 4/3.0 (+1) | 1,820 (+10%) | 14mo | $227,000 | $125 | 58 |
| 705 Mastin Lake Rd NW | 0.09mi | 3/2.0 | 1,430 (-14%) | 15mo | $128,000 | $90 | 56 |
| 633 Dawson Ter | 0.28mi | 4/2.0 (+1) | 1,470 (-12%) | 5mo | $115,000 | $78 | 54 |
| 425 S Plymouth Rd NW | 0.36mi | 4/2.0 (+1) | 1,433 (-14%) | 1mo | $190,000 | $133 | 51 |
| 618 Greenfield Dr NW | 0.40mi | 4/1.5 (+1) | 1,902 (+14%) | 1mo | $185,000 | $97 | 50 |
| 3700 Lakewood Dr | 0.59mi | 3/1.5 | 1,499 (-10%) | 14mo | $135,000 | $90 | 42 |
Match score weights: distance 35% · size 25% · config 20% · recency 20%. Top-matched comps best support the ARV.
Projected returns pro-forma
-3.0% appreciation · 6.81% rent growth · sell at horizon
- IRR
- -0.1%
- Equity multiple
- 0.99×
- Total profit
- $-217
- Equity at exit
- $22,351
- IRR
- 12.9%
- Equity multiple
- 2.19×
- Total profit
- $49,892
- Equity at exit
- $12,961
Cash invested: $41,972 (down + closing). Projections, not guarantees.
Landlord ↔ Tenant lean methodology
- Overall (STATE)
- 90 Strongly Landlord-Friendly
- State Alabama
- 90 Strongly Landlord-Friendly · R+15
- County
- — inherits STATE
- City
- — inherits STATE
ZIP-level market 35811
- Home prices YoY
- -2.1%
- Rents YoY
- 6.8%
- Active inventory
- 560
- Price-to-rent
- 8.2×
Monthly cashflow live
- Estimated rent
- $1,531 high interval (Pro) →
- Mortgage (P&I)
- −$786
- Tax from tax record
- −$78 /mo · $937/yr
- Insurance
- −$62
- HOA
- −$0
- Vacancy / Maint / Mgmt
- −$322
- Net cashflow
- $283
Break-even live
UW: 25.0% down · 7.5% · 30yr · 1.5% tax · 5.0% vac · 8.0% maint · 8.0% mgmt
Financing live
Cash to close
- Down payment
- $37,475
- Closing costs
- $4,497
- Reserves months
- —
- Total cash needed
- —
Loan-product check · same deal, 3 products live
Conventional
25% down · 7.5% · 30yr
- Down + closing
- —
- Monthly P&I
- —
- Monthly cashflow
- —
- DSCR
- —
- Eligible?
- —
Personal DTI + credit; lowest rate.
DSCR
20% down · 8.5% · 30yr
- Down + closing
- —
- Monthly P&I
- —
- Monthly cashflow
- —
- DSCR
- —
- Eligible?
- —
No personal income docs; deal must DSCR.
Hard money
10% down · 12.0% · 12mo
- Down + closing
- —
- Monthly P&I
- —
- Monthly cashflow
- —
- DSCR
- —
- Eligible?
- —
Short-term bridge; refi at stabilization.
Rent comps 31 comps
| Address | Beds | Baths | Sqft | Rent | $/sqft | DOM | Units | Dist |
|---|---|---|---|---|---|---|---|---|
| 611 Ofallon Rd NW Huntsville, AL | 3.0 | 2.0 | 1350 | $3,000 | $2.22 | 23d | 1 | 0.10mi |
| 3058 Boswell Dr NW Huntsville, AL | 4.0 | 2.0 | 1450 | $1,398 | $0.96 | 43d | 1 | 0.19mi |
| 641 Dawson Ter NW Huntsville, AL | 4.0 | 2.0 | 1506 | $1,675 | $1.11 | 13d | 1 | 0.29mi |
| 3606 Lakewood Rd NW Huntsville, AL | 3.0 | 1.5 | 1408 | $1,400 | $0.99 | 43d | 1 | 0.54mi |
| 3707 Lakewood Dr NW Huntsville, AL | 3.0 | 1.0 | 1100 | $1,100 | $1.00 | 43d | 1 | 0.66mi |
| 2032 Front St NE Huntsville, AL | 4.0 | 2.0 | 1304 | $1,400 | $1.07 | 43d | 1 | 0.88mi |
| 2640 Blue Spring Rd NW Huntsville, AL | 1.0–3.0 | 1.0–2.0 | 944 | $1,149 | $1.22 | 43d | 3 | 0.94mi |
| 4005 Memorial Pkwy NW Huntsville, AL | 3.0 | 1.0 | 1100 | $1,375 | $1.25 | 43d | 1 | 1.01mi |
| 743 W Arbor Dr NW Huntsville, AL | 4.0 | 2.0 | 2000 | $1,600 | $0.80 | 23d | 1 | 1.02mi |
| 3811 Lakeview Dr NW Huntsville, AL | 3.0 | 2.0 | 1707 | $1,350 | $0.79 | 43d | 1 | 1.03mi |
| 2519 Birchfield St NW Huntsville, AL | 3.0 | 1.5 | 1125 | $1,195 | $1.06 | 43d | 1 | 1.03mi |
| 2601 Blue Spring Rd NW Huntsville, AL | 3.0 | 1.5 | 1700 | $1,350 | $0.79 | 23d | 1 | 1.09mi |
| 2106 Sullivan Rd NW Huntsville, AL | 3.0 | 1.5 | 1690 | $1,195 | $0.71 | 44d | 1 | 1.10mi |
| 2206 Harris Rd NW Huntsville, AL | 3.0 | 1.0 | 1354 | $1,400 | $1.03 | 43d | 1 | 1.10mi |
| 3013 Kirkland Dr NW Huntsville, AL | 3.0 | 1.5 | 1324 | $1,295 | $0.98 | 43d | 1 | 1.11mi |
| 415 Halsey Ave NE Huntsville, AL | 2.0 | 1.0–2.0 | 818 | $1,760 | $2.15 | 13d | 20 | 1.12mi |
| 2801 Penland Ave NW Huntsville, AL | 3.0 | 2.0 | 1650 | $1,450 | $0.88 | 23d | 1 | 1.12mi |
| 1607 Chapman Ave NE Huntsville, AL | 3.0 | 2.0 | 1508 | $1,495 | $0.99 | 23d | 1 | 1.15mi |
| 2213 Maysville Rd NE Huntsville, AL | 3.0 | 2.0 | 1924 | $1,900 | $0.99 | 23d | 1 | 1.20mi |
| 2602 Gibson St NW Huntsville, AL | 4.0 | 2.0 | 1795 | $1,625 | $0.91 | 43d | 1 | 1.26mi |
| 805 Rison Ave NE Huntsville, AL | 3.0 | 2.0 | 1700 | $2,250 | $1.32 | 43d | 1 | 1.30mi |
| 2211 Penhall Dr NE Huntsville, AL | 3.0 | 1.5 | 1274 | $1,650 | $1.30 | 43d | 1 | 1.30mi |
| 2416 Hanover Dr NW Huntsville, AL | 3.0 | 2.0 | 1300 | $1,395 | $1.07 | 43d | 1 | 1.32mi |
| 3812 Melody Cir NE Huntsville, AL | 3.0 | 1.5 | 2000 | $1,400 | $0.70 | 43d | 1 | 1.32mi |
| 4408 Kenwood Dr NW Huntsville, AL | 3.0 | 1.5 | 1520 | $1,195 | $0.79 | 43d | 1 | 1.33mi |
| 4114 Blue Spring Rd NW Huntsville, AL | 3.0 | 2.0 | 1100 | $1,500 | $1.36 | 23d | 1 | 1.33mi |
| 2113 Norris Rd NW Huntsville, AL | 3.0 | 1.0 | 1372 | $1,550 | $1.13 | 43d | 1 | 1.34mi |
| 3904 Battlefield Dr NW Huntsville, AL | 4.0 | 2.0 | 1890 | $1,600 | $0.85 | 43d | 1 | 1.35mi |
| 1224 Halsey Ave NE Huntsville, AL | 3.0 | 2.0 | 1229 | $2,000 | $1.63 | 23d | 1 | 1.35mi |
| 3205 Lewisburg Dr NW Huntsville, AL | 3.0 | 2.0 | 1408 | $1,600 | $1.14 | 23d | 1 | 1.35mi |
| 1503 Rison Ave NE Huntsville, AL | 2.0 | 1.0 | 1070 | $1,395 | $1.30 | 43d | 1 | 1.49mi |
Listing history 18 events
-
2026-06-18days on market $149,900 Active 69 DOM
-
2026-06-17days on market $149,900 Active 68 DOM
-
2026-06-16days on market $149,900 Active 67 DOM
-
2026-06-15days on market $149,900 Active 66 DOM
-
2026-06-14days on market $149,900 Active 64 DOM
-
2026-06-10days on market $149,900 Active 61 DOM
-
2026-06-09days on market $149,900 Active 60 DOM
-
2026-06-08days on market $149,900 Active 59 DOM
-
2026-06-07days on market $149,900 Active 58 DOM
-
2026-06-03days on market $149,900 Active 54 DOM
-
2026-06-02days on market $149,900 Active 53 DOM
-
2026-06-01days on market $149,900 Active 52 DOM
-
2026-05-31days on market $149,900 Active 51 DOM
-
2026-05-30days on market $149,900 Active 50 DOM
-
2026-05-15price $154,900 310-char remark
Show marketing remark (310 chars)
Charming single-family home in a convenient Huntsville location! Features a spacious living room, formal dining area, updated kitchen, 3 bedrooms, and 1.5 baths. Enjoy a private backyard and mature landscaping. Close to schools, shopping, parks, and downtow n Huntsville. Perfect for comfortable family living.
-
2026-04-10$164,900 Active 310-char remark
Show marketing remark (310 chars)
Charming single-family home in a convenient Huntsville location! Features a spacious living room, formal dining area, updated kitchen, 3 bedrooms, and 1.5 baths. Enjoy a private backyard and mature landscaping. Close to schools, shopping, parks, and downtow n Huntsville. Perfect for comfortable family living.
-
2024-03-14soldstatus $4,528,000
-
2024-03-14soldstatus $4,528,000
ⓘ Source: listings_history table (triggers on properties + properties_extension) + one-shot
backfill from property_details.listing_events for pre-trigger history.
Tax reassessment forecast AL · Resets to sale price
- Current annual tax
- $937 · $78/mo
- Projected year-2 tax
- $937 · $78/mo
- Expected delta
- $0/yr ($0/mo · 0.0%)
ⓘ Screening estimate from a state-policy table — verify with the county assessor before closing.
Climate risk First Street
- Flood 1/10 Low FEMA zone X (unshaded) · 0% chance over 30 yrs
- Wildfire 1/10 Low
- Heat 5/10 Major 7 d/yr ≥104°F today · 18 d/yr by 30 yrs out
- Wind 4/10 Moderate 18% chance of damaging wind over 30 yrs
- Air quality 2/10 Low 1 unhealthy d/yr today · 1 by 30 yrs out
Nearby sold comps map
Loading sold comps map…
Walkable amenities ~0.75 mi
Loading nearby amenities…
Taxation est. · year 1
- Rental income
- $18,374
- − Mortgage interest
- −$8,397
- − Property taxes
- −$937
- − Insurance
- −$750
- − Repairs & maintenance
- −$1,470
- − Management
- −$1,470
- − Depreciation
- −$4,361
- Taxable income
- $990
- Est. tax owed @ 24.0%
- −$238
- After-tax cash flow
- $3,158/yr
For passive investors: Depreciation is non-cash, so a rental often shows a tax loss while cash-flowing — sheltering income. Rental losses are passive: they offset passive income freely, and up to $25,000/yr can offset ordinary (W-2) income if you actively participate and your MAGI is under $100k (phasing out to $0 by $150k); unused losses carry forward. On sale, claimed depreciation is recaptured at up to 25%, and gains may owe capital-gains tax (a 1031 exchange can defer both). Figures are a year-1 estimate at your 24.0% rate — not tax advice; consult a CPA.
Schools (NCES district)
- District
- Huntsville City
- NCES district ID
- 0101800
- Math proficiency
- 21% ▼ -23.00%
- Reading proficiency
- 46% ▬ 0.00%
- Median HH income
- $48,264
- Composite
- 28.84/100
- National rank
- #6647
- State rank
- #48 of 129 in AL
Livability — Huntsville
- Score
- 82/100
- State rank
- #3
- US rank
- #1082
Category grades
Schools grade is shown separately in the Schools card above.
Census & demographics
- Census place
- Huntsville, AL
- County
- Madison County · 380,832 people
- City population
- 220,435
- Metro
- Huntsville, AL
- Population (ZIP)
- 31,008
- Household income
- $90,812
- Rent vs Own
- Severe rent burden
- 517.0
Population outlook (Madison County) Hauer SSP2
- Today (2025)
- 392,086 people
- By 2030
- 409,788 · +4.5%
- By 2040
- 440,557 · +12.4%
- By 2050
- 460,990 · +17.6%
- By 2075
- 502,872 · +28.3%
- By 2100
- 513,623 · +31.0%
Race, ethnicity, and origin ACS 2023
- Neighborhood character
- Majority White (64%)
- Race & ethnicity
- White 64% Black 27% Two or more races 5% Hispanic / Latino 3% Asian 2%
- Common ancestry
- Slovak 2% Italian 2% Serbian 2%
- Foreign-born
- 4% · Canada, Vietnam, China
- Languages at home
- 95% English-only · Spanish 3% Vietnamese 1%
Political lean MEDSL · Madison
- 2024 margin
- Lean R (+9.0) · D 44.7% · R 53.7% · Other 1.6%
- 2008→2024 swing
- +6.0pp toward D · 2008: -14.9pp · 2024: -9.0pp
- All cycles
- 2024: R+9.0 2020: R+8.0 2016: R+16.8 2012: R+18.7 2008: R+14.9
Not yet ingested
- Civics
- —
Market trends
- HPI YoY
- ▼ -7.13%
- Current HPI
- 332.9423
- Rent YoY
- ▲ 6.81%
- Metro
- Huntsville, AL
- State GDP YoY
- ▲ 2.94%
- F500 in state
- 4
Industry mix (Fortune 500 HQ in AL)
| Industry | F500 HQs | Revenue |
|---|---|---|
| Financial Services | 1 | $8B |
|
||
| Healthcare | 1 | $5B |
|
||
Price history
-96.6% since first listed4 events — show timeline
- 2026-05-15 Price Changed $154,900 VMLS
- 2026-04-10 Listed $164,900 VMLS
- 2024-03-14 Sold (Public Records) $4,528,000 Public Records
- 2024-03-14 Sold (Public Records) $4,528,000 Public Records
Property tax history
+10.6%/yrLatest (2024): $937 · +7.2% YoY. Source: county tax records.
Cash-flow waterfall
monthlySold comps — $/sqft
last 12 mo · ≤1 miLoading sold comps…