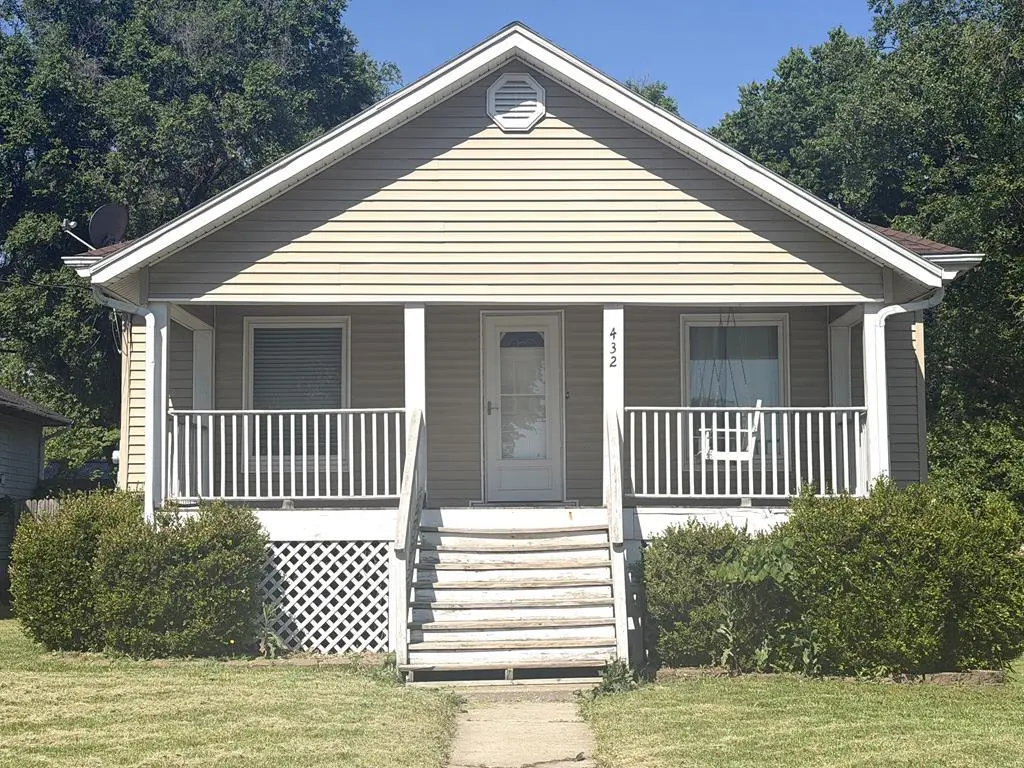
432 Woodrow St · Chillicothe, MO
Flood risk 1/10 · Minimal
- FEMA flood zone
- X (unshaded)
- Chance of flooding over 30 yrs
- 0.0%
- Est. flood insurance / yr
- $473 – $860
Fire risk 1/10 · Minimal
- Est. fire insurance / yr
- $1,054 – $1,958
Heat risk 4/10 · Minor
- Hot days now (above 108°F)
- 7 days/yr
- Hot days in 30 yrs
- 15 days/yr
Wind risk 2/10 · Minimal
- Chance of severe wind over 30 yrs
- —
Air-quality risk 2/10 · Minimal
- Unhealthy air days now
- 0 days/yr
- Unhealthy air days in 30 yrs
- 1 days/yr
Risk factors via First Street. Map © Google.
Why this score? — see what drove the D grade
The composite is a weighted blend of 9 inputs, each scored 0–100. Each bar is that input's sub-score; the figure is the points it added to the 100-point composite (weight × sub-score).
- Cash flow +16.3/30.0
- ARV discount +6.9/15.0
- DSCR +5.1/10.0
- Schools +4.1/10.0
- 1% rule +3.7/10.0
- Livability +3.4/5.0
- Rent growth +2.5/5.0
- Condition / age +2.5/5.0
- Appreciation +0.0/10.0
$120,000
🖨 Deal sheet (PDF) 📄 Offer letter ✓ Due diligence
Listing remarks MLS
Charming 3 bedroom bungalow offering classic character and comfortable living with 1,120 finished square feet plus a full unfinished basement for added potential. Step inside to find hardwood floors that flow throughout the main living spaces, creating a welcoming feel. The home features 3 bedrooms and 1 full bath, all conveniently located on the main level. Out back, enjoy a deck that steps down into a nice fenced-in yard — perfect for relaxing, entertaining, or letting pets roam. The full unfinished basement provides excellent storage or room to expand in the future.
Key facts
- Hardwood floors
- Fenced-in yard
- 7,928 sq ft lot
Tags
Property features AI
Finance
- Other: Not in a flood plain; Lot approximately 7,928 square feet; Living area reported as 1,120 (assessor); Property age estimated 76–100 years
- HOA & community: No association fees
Exterior
- Parking: Off-street parking
- Utilities: Public water; Public sewer
- Home design: Single-family residence; Bungalow floor plan; Residential property
- Construction: Vinyl siding; Composition (shingle) roof
- Exterior features: Deck; Porch; Metal fencing; Paved road access
Interior
- Kitchen: Refrigerator; Electric range
- Bedrooms: 3 bedrooms (all on the main level)
- Flooring: Wood flooring
- Bathrooms: 1 full bathroom (main level)
- Heating & cooling: Forced air heating (natural gas); Electric cooling
- Interior features: Ceiling fan(s)
- Laundry & utility: Laundry located in the basement
Neighborhood map
What this means for you Summary
Snapshot
- This is a 3-bed/1.0-bath single-family listed at $120k.
Deal economics
- At list price, monthly cash flow is $67 ($799/yr) — positive.
- The deal already cash-flows at list — no discount required.
- To meet the 1% rule (rent ≥ 1% of price), the offer needs to be $104k (13.0% below list).
- Recommended offer: $104k (13.0% below list) — sets the bar for 1% rule.
- Cap rate 7.0% vs local median 4.8% in Chillicothe — top-decile yield for the area; either an underpriced asset or a hidden risk that comps aren't pricing in. Stress-test before assuming the spread holds.
Location & tenants
- Location reads 67/100 on livability (#225 in MO) — a middle-class / working-renter tenant base. Strengths: cost of living A+, housing A; Watch: employment D+, amenities F, commute F.
- Chillicothe R-II (town): math 49% / reading 48% proficiency, ranked #60 of 324 in MO (top 18%) — families likely to look elsewhere, expect single-tenant / working-renter base with shorter leases.
- Zoned schools: Chillicothe Elem (327 students, 52% FRL); Chillicothe Middle (math 31% / reading 35%, grade F, #265 of 391 statewide, top 69%, 371 students, 48% FRL); Chillicothe High (math 62% / reading 62%, grade B-, #28 of 521 statewide, top 6%, 609 students, 37% FRL) — zoned schools at 46% FRL track the district average.
- Market conditions: 71 active listings in the ZIP; 47 units permitted in Livingston County in 2024 (0 in 5+ unit buildings).
Forward outlook
- Local home prices are declining (-3.0%/yr); year-one equity from $830 of loan paydown is wiped out by about $4k of value loss. Plan a longer hold.
Negotiation context
- It's been on market 23 days — a 2% lower offer ($118k) is reasonable based on typical stale-listing flexibility.
- 6 sale attempts since 5y ago with the ask held roughly flat each time — persistent listings suggest the price (not the market) is what's stuck; bring a comps-based counter.
Risks & watch-outs
- Watch-outs: built in 1930 — expect roof / HVAC / electrical / plumbing capex.
Questions for the listing agent
- Built in 1930 — when were the roof, HVAC, electrical panel, plumbing, and water heater last replaced?
- Is there a deadline driving the sale (1031 exchange, divorce, estate, relocation)? That informs how much negotiation room exists.
- The area grade is low — what's the realistic commute time and amenity access for the typical tenant pool here? Any planned neighborhood developments (good or bad) we should know about?
- What's the average days-on-market for RENTAL listings here right now (not sales)? A rising rental-DOM trend means longer vacancies and softer asking-rent achievability than the comps imply.
- What's the recent tenant-quality profile in this submarket — average credit score on applications, eviction rate, late-payment / NSF rate, and stable-employment percentage? A property-management company in the area should have these aggregated.
- How much new for-sale + rental construction is in the pipeline within 1–3 miles? Heavy new supply typically softens prices + rents 12–24 months out; constrained supply supports both.
Investment metrics
- 1% rule
- 0.87% ✗
- Cap rate
- 6.96%
- Cash-on-cash
- 2.38%
- DSCR
- 1.11
- GRM
- 9.6
CMA / ARV
- ARV (median comp)
- $118,533
- List price
- $120,000
- Delta
- 1.24%
- Verdict
- FAIR
- Comps
- 20 within 1.0 mi
Show comp detail 4 sales within ~0.75 mi
| Address | Dist | Beds/Ba | Sqft | Sold | Price | $/sf | Match |
|---|---|---|---|---|---|---|---|
| 380 Woodrow St | 0.01mi | 2/2.0 (-1) | 1,878 (+0%) | 20mo | $30,000 | $16 | 73 |
| 251 Southwest Dr | 0.27mi | 3/1.5 | 1,805 (-4%) | 8mo | $199,900 | $111 | 73 |
| 1307 Jackson St | 0.30mi | 3/1.0 | 2,000 (+7%) | 6mo | $155,000 | $78 | 69 |
| 453 Elm St | 0.72mi | 3/1.0 | 1,628 (-13%) | 3mo | $36,900 | $23 | 43 |
Match score weights: distance 35% · size 25% · config 20% · recency 20%. Top-matched comps best support the ARV.
Projected returns pro-forma
-3.0% appreciation · 3.0% rent growth · sell at horizon
- IRR
- -12.6%
- Equity multiple
- 0.55×
- Total profit
- $-15,231
- Equity at exit
- $17,892
- IRR
- -3.5%
- Equity multiple
- 0.76×
- Total profit
- $-7,914
- Equity at exit
- $10,375
Cash invested: $33,600 (down + closing). Projections, not guarantees.
Landlord ↔ Tenant lean methodology
- Overall (STATE)
- 81 Strongly Landlord-Friendly
- State Missouri
- 81 Strongly Landlord-Friendly · R+10
- County
- — inherits STATE
- City
- — inherits STATE
ZIP-level market 64601
- Home prices YoY
- -15.3%
- Active inventory
- 71
- Price-to-rent
- 9.6×
Monthly cashflow live
- Estimated rent
- $1,044 medium interval (Pro) →
- Mortgage (P&I)
- −$629
- Tax from tax record
- −$79 /mo · $945/yr
- Insurance
- −$50
- HOA
- −$0
- Vacancy / Maint / Mgmt
- −$219
- Net cashflow
- $67
Break-even live
Sensitivity live
| Price | -10% $135 | -5% $101 | +0% $67 | +5% $33 | +10% $-1 |
|---|---|---|---|---|---|
| Rent | -10% $-16 | -5% $25 | +0% $67 | +5% $108 | +10% $149 |
| Rate | -1.0pp $127 | -0.5pp $97 | base $67 | +0.5pp $36 | +1.0pp $4 |
UW: 25.0% down · 7.5% · 30yr · 1.5% tax · 5.0% vac · 8.0% maint · 8.0% mgmt
Financing live
Cash to close
- Down payment
- $30,000
- Closing costs
- $3,600
- Reserves months
- —
- Total cash needed
- —
Loan-product check · same deal, 3 products live
Conventional
25% down · 7.5% · 30yr
- Down + closing
- —
- Monthly P&I
- —
- Monthly cashflow
- —
- DSCR
- —
- Eligible?
- —
Personal DTI + credit; lowest rate.
DSCR
20% down · 8.5% · 30yr
- Down + closing
- —
- Monthly P&I
- —
- Monthly cashflow
- —
- DSCR
- —
- Eligible?
- —
No personal income docs; deal must DSCR.
Hard money
10% down · 12.0% · 12mo
- Down + closing
- —
- Monthly P&I
- —
- Monthly cashflow
- —
- DSCR
- —
- Eligible?
- —
Short-term bridge; refi at stabilization.
Listing history 15 events
-
2026-06-22days on market $120,000 Active 23 DOM
-
2026-06-21days on market $120,000 Active 22 DOM
-
2026-06-21days on market $120,000 Active 21 DOM
-
2026-06-18days on market $120,000 Active 19 DOM
-
2026-06-17days on market $120,000 Active 18 DOM
-
2026-06-16days on market $120,000 Active 17 DOM
Show marketing remark (581 chars)
Charming 3 bedroom bungalow offering classic character and comfortable living with 1,120 finished square feet plus a full unfinished basement for added potential. Step inside to find hardwood floors that flow throughout the main living spaces, creating a welcoming feel. The home features 3 bedrooms and 1 full bath, all conveniently located on the main level. Out back, enjoy a deck that steps down into a nice fenced-in yard — perfect for relaxing, entertaining, or letting pets roam. The full unfinished basement provides excellent storage or room to expand in the future.
-
2026-06-15days on market $120,000 Active 16 DOM
-
2026-06-13statusdays on market $120,000 Active 14 DOM
-
2026-05-11$120,000 Active 581-char remark
Show marketing remark (581 chars)
Charming 3 bedroom bungalow offering classic character and comfortable living with 1,120 finished square feet plus a full unfinished basement for added potential. Step inside to find hardwood floors that flow throughout the main living spaces, creating a welcoming feel. The home features 3 bedrooms and 1 full bath, all conveniently located on the main level. Out back, enjoy a deck that steps down into a nice fenced-in yard — perfect for relaxing, entertaining, or letting pets roam. The full unfinished basement provides excellent storage or room to expand in the future.
-
2025-03-24$135,000 Active
-
2021-10-12soldstatus
-
2021-10-08soldstatus
-
2021-06-03$100,000
-
2018-10-22soldstatus
ⓘ Source: listings_history table (triggers on properties + properties_extension) + one-shot
backfill from property_details.listing_events for pre-trigger history.
Tax reassessment forecast MO · Resets to sale price
- Current annual tax
- $945 · $79/mo
- Projected year-2 tax
- $1,164 · $97/mo
- Expected delta
- +$219/yr (+$18/mo · 23.1%)
ⓘ Screening estimate from a state-policy table — verify with the county assessor before closing.
Climate risk First Street
- Flood 1/10 Low FEMA zone X (unshaded) · 0% chance over 30 yrs
- Wildfire 1/10 Low
- Heat 4/10 Moderate 7 d/yr ≥108°F today · 15 d/yr by 30 yrs out
- Wind 2/10 Low
- Air quality 2/10 Low 0 unhealthy d/yr today · 1 by 30 yrs out
Nearby sold comps map
Loading sold comps map…
Walkable amenities ~0.75 mi
Loading nearby amenities…
Taxation est. · year 1
- Rental income
- $12,527
- − Mortgage interest
- −$6,722
- − Property taxes
- −$945
- − Insurance
- −$600
- − Repairs & maintenance
- −$1,002
- − Management
- −$1,002
- − Depreciation
- −$3,491
- Taxable loss
- −$1,236
- Est. tax savings @ 24.0%
- +$297
- After-tax cash flow
- $1,096/yr
For passive investors: Depreciation is non-cash, so a rental often shows a tax loss while cash-flowing — sheltering income. Rental losses are passive: they offset passive income freely, and up to $25,000/yr can offset ordinary (W-2) income if you actively participate and your MAGI is under $100k (phasing out to $0 by $150k); unused losses carry forward. On sale, claimed depreciation is recaptured at up to 25%, and gains may owe capital-gains tax (a 1031 exchange can defer both). Figures are a year-1 estimate at your 24.0% rate — not tax advice; consult a CPA.
Schools (NCES district)
- District
- Chillicothe R-II
- NCES district ID
- 2908760
- Math proficiency
- 49% ▲ 4.00%
- Reading proficiency
- 48% ▲ 4.00%
- Median HH income
- $42,193
- Composite
- 40.81/100
- National rank
- #3637
- State rank
- #60 of 324 in MO
Livability — Chillicothe
- Score
- 67/100
- State rank
- #225
- US rank
- #10947
Category grades
Schools grade is shown separately in the Schools card above.
Census & demographics
- Census place
- Chillicothe, MO
- Population (ZIP)
- 12,110
Population outlook (Livingston County) Hauer SSP2
- Today (2025)
- 14,945 people
- By 2030
- 14,945 · +0.0%
- By 2040
- 15,010 · +0.4%
- By 2050
- 15,105 · +1.1%
- By 2075
- 15,950 · +6.7%
- By 2100
- 15,897 · +6.4%
Race, ethnicity, and origin ACS 2023
- Neighborhood character
- Predominantly White (91%)
- Race & ethnicity
- White 91% Two or more races 4% Black 3% Hispanic / Latino 2%
- Common ancestry
- Slovak 2% Italian 1% Romanian 1%
- Foreign-born
- 1% · Canada
Political lean MEDSL · Livingston
- 2024 margin
- Solid R (+57.8) · D 20.7% · R 78.5%
- 2008→2024 swing
- -34.0pp toward R · 2008: -23.8pp · 2024: -57.8pp
- All cycles
- 2024: R+57.8 2020: R+57.1 2016: R+56.4 2012: R+34.7 2008: R+23.8
Not yet ingested
- Civics
- —
Market trends
- HPI YoY
- ▼ -32.00%
- Current HPI
- 177.3092
- Rent YoY
- —
- Metro
- —
- State GDP YoY
- ▲ 1.84%
- F500 in state
- 20
Industry mix (Fortune 500 HQ in MO)
| Industry | F500 HQs | Revenue |
|---|---|---|
| Healthcare | 1 | $163B |
|
||
| Insurance | 1 | $21B |
|
||
| Industrial Technology | 1 | $17B |
|
||
| Retail | 1 | $16B |
|
||
| Industrial Distribution | 1 | $10B |
|
||
| Utilities | 1 | $9B |
|
||
Price history
+20.0% since first listed11 events — show timeline
- 2026-06-16 Relisted — NECAR
- 2026-06-12 Relisted — Heartland MLS as Distributed by MLS Grid
- 2026-05-26 Pending — NECAR
- 2026-05-24 Pending — Heartland MLS as Distributed by MLS Grid
- 2026-05-11 Listed $120,000 NECAR
- 2026-05-11 Listed $120,000 Heartland MLS as Distributed by MLS Grid
- 2025-03-24 Listed $135,000 NECAR
- 2021-10-12 Sold (Public Records) — Public Records
- 2021-10-08 Sold (MLS) — NECAR
- 2021-06-03 Listed $100,000 NECAR
- 2018-10-22 Sold (Public Records) — Public Records
Property tax history
+6.9%/yrLatest (2025): $945 · +13.6% YoY. Source: county tax records.
Cash-flow waterfall
monthlySold comps — $/sqft
last 12 mo · ≤1 miLoading sold comps…