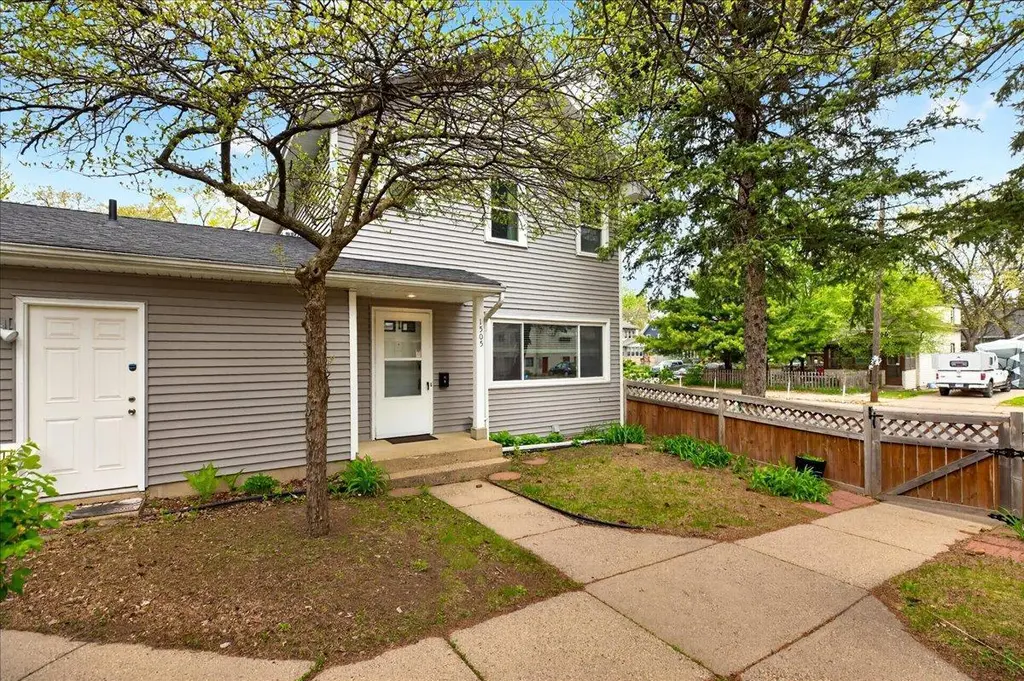
1505 E 38th St · Minneapolis, MN
Flood risk 4/10 · Minor
- FEMA flood zone
- X (unshaded)
- Chance of flooding over 30 yrs
- 0.22%
- Est. flood insurance / yr
- $473 – $860
Fire risk 1/10 · Minimal
- Est. fire insurance / yr
- $888 – $1,650
Heat risk 2/10 · Minimal
- Hot days now (above 100°F)
- 7 days/yr
- Hot days in 30 yrs
- 14 days/yr
Wind risk 2/10 · Minimal
- Chance of severe wind over 30 yrs
- —
Air-quality risk 2/10 · Minimal
- Unhealthy air days now
- 1 days/yr
- Unhealthy air days in 30 yrs
- 1 days/yr
Risk factors via First Street. Map © Google.
Why this score? — see what drove the D grade
The composite is a weighted blend of 9 inputs, each scored 0–100. Each bar is that input's sub-score; the figure is the points it added to the 100-point composite (weight × sub-score).
- ARV discount +15.0/15.0
- Cash flow +7.8/30.0
- Livability +3.9/5.0
- Rent growth +3.6/5.0
- Schools +3.5/10.0
- 1% rule +3.3/10.0
- Condition / age +2.5/5.0
- DSCR +1.8/10.0
- Appreciation +0.0/10.0
$200,000
🖨 Deal sheet (PDF) 📄 Offer letter ✓ Due diligence
Listing remarks
Move-in ready and full of value, this well-maintained 2-bedroom, 2-bath townhome offers comfortable living in a convenient Minneapolis location. Paint throughout creates a clean, updated feel, while laminate flooring in the entry, kitchen, and half bath adds style and durability. The functional layout features bright living spaces, spacious bedrooms, and a lower-level area with excellent potential for a family room, home office, workout space, or additional entertaining area. Enjoy the convenience of a single garage, low association fees, and quick possession possible for an easy transition into your new home. Located close to shopping, dining, parks, transit, and major commuting routes, th
Key facts
- $255 HOA
- Garage
- Built 1984
Property features AI
Finance
- Other: Lot about 0.055 acres (approx. 80 x 12); Publicly maintained road responsibility
- HOA & community: Homeowners association (self-governed, manager: William Lindstrom); Monthly association fee ($255) covering hazard insurance, lawn care, sewer, snow removal, and water
Exterior
- Parking: Attached garage (1 car, 11x22)
- Utilities: City water (in street); City sewer (in street); Electric service with circuit breakers; Electric fuel
- Home design: Residential attached property; Two levels; Entry on main level
- Construction: Block and frame construction; Asphalt roof (older than 8 years); Block foundation; Built area includes above-grade and below-grade finished space
- Exterior features: Vinyl exterior; Wood fencing; City street frontage with curbs and paved streets
Interior
- Kitchen: Dishwasher; Microwave; Range; Refrigerator
- Bedrooms: 2 bedrooms (both on upper level)
- Bathrooms: 1 full bath (upper level); 1 half bath
- Heating & cooling: Baseboard heating; Window air conditioning units
- Interior features: Cable available; Security system; Finished basement (partial, block foundation, full); Eat-in kitchen / kitchen-dining combo
- Laundry & utility: Washer; Dryer; Washer/Dryer hookup; Gas water heater
Neighborhood map
What this means for you Summary
Snapshot
- This is a 2-bed/1.5-bath condo listed at $200k.
Deal economics
- At list price, monthly cash flow is $-226 ($-3k/yr) — negative.
- To cash-flow at today's rent, offer at most $160k (20.0% below list).
- To meet the 1% rule (rent ≥ 1% of price), the offer needs to be $165k (17.3% below list).
- Recommended offer: $160k (20.0% below list) — sets the bar for cash-flow.
- Cap rate 4.9% vs local median 3.1% in Minneapolis — top-decile yield for the area; either an underpriced asset or a hidden risk that comps aren't pricing in. Stress-test before assuming the spread holds.
Location & tenants
- Location reads 78/100 on livability (#110 in MN, #2,525 nationally) — a middle-class / working-renter tenant base. Strengths: amenities A+, commute A+, housing A+; Watch: cost of living C-, crime F.
- Minneapolis Public School District (urban): math 35% / reading 46% proficiency, ranked #217 of 301 in MN (top 72%) — families likely to look elsewhere, expect single-tenant / working-renter base with shorter leases.
- Zoned schools: Bancroft Elementary (math 17% / reading 27%, grade F, #732 of 857 statewide, top 88%, 369 students, 56% FRL); Sanford Middle (math 30% / reading 54%, grade D-, #131 of 258 statewide, top 53%, 738 students, 38% FRL); Roosevelt High (math 24%, 1,044 students, 59% FRL).
- Market conditions: Rents rising fast (+4.3%/yr); 146 active listings in the ZIP; 40 comparable units currently listed for rent nearby; rentals at typical pace (median 26d on market — plan ~3-4 weeks tenant-placement turnaround); 40% of comp listings sitting > 30 days — soft ceiling on asking rent; solid renter incomes; 4,651 units permitted in Hennepin County in 2024 (2,443 in 5+ unit buildings).
Forward outlook
- Local home prices are declining (-3.0%/yr); year-one equity from $1k of loan paydown is wiped out by about $6k of value loss. Plan a longer hold.
- Hennepin County population projected at +30% by 2050 — long-run rental-demand tailwind backs the buy-and-hold thesis.
Negotiation context
- It's been on market 34 days — a 3% lower offer ($194k) is reasonable based on typical stale-listing flexibility.
- Current owner paid $61k; list at $200k implies a 226% gain — meaningful room to come down on a strong offer.
Questions for the listing agent
- What do current leases actually rent for vs. the listed asking? Can we see a recent rent roll and the last 12 months of T-12 income?
- It's been on market 34 days. Have you received any prior offers? Is the seller open to a 20% concession, seller financing, or rate buy-down credit?
- What does the HOA fee cover, when was the last increase, and are there any pending special assessments or reserve-fund shortfalls?
- Any open or pending special assessments — roof, HVAC, plumbing, elevator, façade? What's the per-unit balance and payoff schedule, and is the seller paying it off at close or rolling it to the buyer?
- Is there a deadline driving the sale (1031 exchange, divorce, estate, relocation)? That informs how much negotiation room exists.
- Crime grade is F in this area — have there been break-ins, vandalism, or insurance claims at this property in the last 3 years? What carrier currently insures it and at what premium?
- The area grade is low — what's the realistic commute time and amenity access for the typical tenant pool here? Any planned neighborhood developments (good or bad) we should know about?
- What's the average days-on-market for RENTAL listings here right now (not sales)? A rising rental-DOM trend means longer vacancies and softer asking-rent achievability than the comps imply.
- What's the recent tenant-quality profile in this submarket — average credit score on applications, eviction rate, late-payment / NSF rate, and stable-employment percentage? A property-management company in the area should have these aggregated.
- How much new apartment / multifamily construction is in the pipeline within 1–3 miles? Heavy new supply (>2% of stock underway) typically softens rents 12–24 months out; light construction supports rent growth.
Investment metrics
- 1% rule
- 0.83% ✗
- Cap rate
- 4.93%
- Cash-on-cash
- -4.85%
- DSCR
- 0.78
- GRM
- 10.1
CMA / ARV
- ARV (median comp)
- $270,544
- List price
- $200,000
- Delta
- -26.07%
- Verdict
- UNDERPRICED
- Comps
- 3 within 2.0 mi
Projected returns pro-forma
-3.0% appreciation · 4.3% rent growth · sell at horizon
- IRR
- -22.8%
- Equity multiple
- 0.20×
- Total profit
- $-44,522
- Equity at exit
- $29,821
- IRR
- -13.8%
- Equity multiple
- 0.15×
- Total profit
- $-47,630
- Equity at exit
- $17,292
Cash invested: $56,000 (down + closing). Projections, not guarantees.
Landlord ↔ Tenant lean methodology
- Overall (CITY)
- 34 Tenant-Leaning
- State Minnesota
- 46 Balanced · D+2
- County
- — inherits STATE
- City Minneapolis
- 34 Tenant-Leaning · D+50
ZIP-level market 55407
- Rents YoY
- 4.3%
- Active inventory
- 146
- Price-to-rent
- 10.1×
Monthly cashflow live
- Estimated rent
- $1,654 high interval (Pro) →
- Mortgage (P&I)
- −$1,049
- Tax from tax record
- −$146 /mo · $1,749/yr
- Insurance
- −$83
- HOA
- −$255
- Vacancy / Maint / Mgmt
- −$347
- Net cashflow
- $-226
Break-even live
Sensitivity live
| Price | -10% $-113 | -5% $-170 | +0% $-226 | +5% $-283 | +10% $-340 |
|---|---|---|---|---|---|
| Rent | -10% $-357 | -5% $-292 | +0% $-226 | +5% $-161 | +10% $-96 |
| Rate | -1.0pp $-126 | -0.5pp $-176 | base $-226 | +0.5pp $-278 | +1.0pp $-331 |
UW: 25.0% down · 7.5% · 30yr · 1.5% tax · 5.0% vac · 8.0% maint · 8.0% mgmt
Financing live
Cash to close
- Down payment
- $50,000
- Closing costs
- $6,000
- Reserves months
- —
- Total cash needed
- —
Loan-product check · same deal, 3 products live
Conventional
25% down · 7.5% · 30yr
- Down + closing
- —
- Monthly P&I
- —
- Monthly cashflow
- —
- DSCR
- —
- Eligible?
- —
Personal DTI + credit; lowest rate.
DSCR
20% down · 8.5% · 30yr
- Down + closing
- —
- Monthly P&I
- —
- Monthly cashflow
- —
- DSCR
- —
- Eligible?
- —
No personal income docs; deal must DSCR.
Hard money
10% down · 12.0% · 12mo
- Down + closing
- —
- Monthly P&I
- —
- Monthly cashflow
- —
- DSCR
- —
- Eligible?
- —
Short-term bridge; refi at stabilization.
Rent comps 40 comps
| Address | Beds | Baths | Sqft | Rent | $/sqft | DOM | Units | Dist |
|---|---|---|---|---|---|---|---|---|
| 3741 13th Ave S Unit 1 Minneapolis, MN | 3.0 | 1.0 | 1150 | $1,799 | $1.56 | 9d | 1 | 0.14mi |
| 3520 12th Ave S Minneapolis, MN | 1.0–2.0 | 1.0 | 725 | $1,200 | $1.66 | 45d | 1 | 0.40mi |
| 3421 15th Ave S Minneapolis, MN | 1.0 | 1.0 | 750 | $1,198 | $1.60 | 45d | 1 | 0.46mi |
| 3705 Chicago Ave Unit 1 Minneapolis, MN | 2.0 | 2.0 | 1100 | $1,250 | $1.14 | 45d | 1 | 0.47mi |
| 3925 Chicago Ave Unit 1 Minneapolis, MN | 2.0 | 1.0 | 1100 | $1,500 | $1.36 | 45d | 1 | 0.48mi |
| 3925 Chicago Ave Minneapolis, MN | 2.0 | 1.0 | 1100 | $1,450 | $1.32 | 26d | 1 | 0.48mi |
| 4212 13th Ave S Minneapolis, MN | 3.0 | 1.0 | 1500 | $2,250 | $1.50 | 45d | 1 | 0.55mi |
| 4106 Chicago Ave Minneapolis, MN | 1.0 | 1.0 | 1000 | $1,599 | $1.60 | 45d | 1 | 0.62mi |
| 4112 Chicago Ave Minneapolis, MN | 2.0 | 1.0 | 1000 | $1,399 | $1.40 | 0d | 1 | 0.62mi |
| 3320 Longfellow Ave Minneapolis, MN | 2.0 | 1.0 | 950 | $1,798 | $1.89 | 18d | 1 | 0.63mi |
| 3718 Oakland Ave Unit 2 Minneapolis, MN | 2.0 | 1.0 | 700 | $1,150 | $1.64 | 26d | 1 | 0.67mi |
| 3501 22nd Ave S Minneapolis, MN | 3.0 | 1.0 | 1100 | $1,595 | $1.45 | 9d | 1 | 0.73mi |
| 3501 22nd Ave S Unit Upper Minneapolis, MN | 3.0 | 1.0 | 1100 | $1,595 | $1.45 | 26d | 1 | 0.73mi |
| 3806 24th Ave S Minneapolis, MN | 2.0 | 1.0–2.0 | 772 | $2,305 | $2.98 | 6d | 11 | 0.76mi |
| 3601 4th Ave S Unit 101 Minneapolis, MN | 3.0 | 2.0 | 1097 | $2,350 | $2.14 | 26d | 1 | 0.86mi |
| 4344 Chicago Ave Unit 2 Minneapolis, MN | 2.0 | 1.0 | 1050 | $1,800 | $1.71 | 45d | 1 | 0.86mi |
| 4042 Clinton Ave Minneapolis, MN | 3.0 | 1.0 | 1050 | $1,854 | $1.77 | 45d | 1 | 0.98mi |
| 3328 5th Ave S Unit 01 Minneapolis, MN | 2.0 | 1.0 | 864 | $1,495 | $1.73 | 9d | 1 | 0.98mi |
| 3806 28th Ave S Minneapolis, MN | 1.0–2.0 | 1.0–2.0 | 820 | $1,925 | $2.35 | 25d | 3 | 1.02mi |
| 2932 15th Ave S Unit 1 Minneapolis, MN | 2.0 | 1.0 | 816 | $1,250 | $1.53 | 45d | 1 | 1.03mi |
| 3015 19th Ave S Unit 1 Minneapolis, MN | 3.0 | 1.0 | 960 | $1,750 | $1.82 | 45d | 1 | 1.03mi |
| 3503 2nd Ave S Minneapolis, MN | 2.0 | 1.0 | 560 | $1,668 | $2.98 | 1d | 5 | 1.08mi |
| 3714 Stevens Ave #3 Minneapolis, MN | 2.0 | 1.5 | 950 | $2,050 | $2.16 | 19d | 1 | 1.11mi |
| 3714 Stevens Ave #3 Minneapolis, MN | 2.0 | 1.5 | 900 | $2,050 | $2.28 | 45d | 1 | 1.11mi |
| 3029 22nd Ave S Unit 202 Minneapolis, MN | 2.0 | 2.0 | 923 | $1,885 | $2.04 | 45d | 1 | 1.11mi |
| 3029 22nd Ave S Unit 418 Minneapolis, MN | 2.0 | 2.0 | 1010 | $1,789 | $1.77 | 45d | 1 | 1.11mi |
| 3029 22nd Ave S Unit 302 Minneapolis, MN | 2.0 | 2.0 | 923 | $1,799 | $1.95 | 5d | 1 | 1.11mi |
| 2929 Chicago Ave Minneapolis, MN | 2.0 | 1.0–2.0 | 1325 | $2,325 | $1.75 | 45d | 2 | 1.13mi |
| 2929 Chicago Ave Minneapolis, MN | 2.0 | 1.0 | 1290 | $2,350 | $1.82 | 23d | 1 | 1.13mi |
| 3635 1st Ave S Unit 3 Minneapolis, MN | 1.0 | 1.0 | 800 | $1,100 | $1.38 | 45d | 1 | 1.16mi |
| 2835 11th Ave S Minneapolis, MN | 2.0 | 1.0–2.0 | 688 | $1,669 | $2.42 | 1d | 11 | 1.19mi |
| 3449 Snelling Ave Unit 3451 Minneapolis, MN | 3.0 | 1.0 | 1108 | $1,895 | $1.71 | 0d | 1 | 1.22mi |
| 2220 E Lake St Minneapolis, MN | 1.0–2.0 | 1.0 | 659 | $1,425 | $2.16 | 15d | 1 | 1.23mi |
| 3139 3rd Ave S Unit 3 Minneapolis, MN | 2.0 | 1.0 | 725 | $1,450 | $2.00 | 45d | 1 | 1.24mi |
| 4731 Chicago Ave Minneapolis, MN | 2.0 | 1.0 | 1398 | $1,625 | $1.16 | 26d | 1 | 1.27mi |
| 3136 Minnehaha Ave Minneapolis, MN | 1.0–2.0 | 1.0 | 602 | $1,795 | $2.98 | 1d | 2 | 1.27mi |
| 3536 Nicollet Ave Minneapolis, MN | 2.0 | 1.0–2.0 | 744 | $2,664 | $3.58 | 4d | 12 | 1.27mi |
| 3126 Minnehaha Ave Minneapolis, MN | 2.0 | 1.0 | 562 | $1,895 | $3.37 | 0d | 3 | 1.28mi |
| 4200 1st Ave S Unit 9 Minneapolis, MN | 1.0 | 1.0 | 750 | $1,149 | $1.53 | 26d | 1 | 1.28mi |
| 3944 Van Nest Ave Minneapolis, MN | 3.0 | 1.0 | 1414 | $2,525 | $1.79 | 26d | 1 | 1.30mi |
HOA detail condo
- Monthly dues
- $255 · $3,060/yr
- Assessments
- None detected in remarks — confirm with the listing agent.
Listing history 17 events
-
2026-06-18status $200,000 Pending 34 DOM
-
2026-06-18days on market $200,000 Contingent - Inspection 34 DOM
-
2026-06-17days on market $200,000 Contingent - Inspection 33 DOM
-
2026-06-16days on market $200,000 Contingent - Inspection 32 DOM
-
2026-06-15days on market $200,000 Contingent - Inspection 31 DOM
-
2026-06-13days on market $200,000 Contingent - Inspection 29 DOM
-
2026-06-09days on market $200,000 Contingent - Inspection 25 DOM
-
2026-06-08days on market $200,000 Contingent - Inspection 24 DOM
-
2026-06-07days on market $200,000 Contingent - Inspection 23 DOM
-
2026-06-04days on market $200,000 Contingent - Inspection 20 DOM
-
2026-06-03days on market $200,000 Contingent - Inspection 19 DOM
-
2026-06-02days on market $200,000 Contingent - Inspection 18 DOM
-
2026-06-01days on market $200,000 Contingent - Inspection 17 DOM
-
2026-05-31days on market $200,000 Contingent - Inspection 16 DOM
-
2026-05-16$200,000 Active 903-char remark
-
2026-05-12historical $200,000 903-char remark
-
1990-11-15soldstatus $61,400
ⓘ Source: listings_history table (triggers on properties + properties_extension) + one-shot
backfill from property_details.listing_events for pre-trigger history.
Tax reassessment forecast MN · Partial reset (capped growth)
- Current annual tax
- $1,749 · $146/mo
- Projected year-2 tax
- $1,994 · $166/mo
- Expected delta
- +$246/yr (+$20/mo · 14.0%)
ⓘ Screening estimate from a state-policy table — verify with the county assessor before closing.
Climate risk First Street
- Flood 4/10 Moderate FEMA zone X (unshaded) · 22% chance over 30 yrs
- Wildfire 1/10 Low
- Heat 2/10 Low 7 d/yr ≥100°F today · 14 d/yr by 30 yrs out
- Wind 2/10 Low
- Air quality 2/10 Low 1 unhealthy d/yr today · 1 by 30 yrs out
Nearby sold comps map
Loading sold comps map…
Walkable amenities ~0.75 mi
Loading nearby amenities…
Taxation est. · year 1
- Rental income
- $19,845
- − Mortgage interest
- −$11,203
- − Property taxes
- −$1,749
- − Insurance
- −$1,000
- − Repairs & maintenance
- −$1,588
- − Management
- −$1,588
- − HOA
- −$3,060
- − Depreciation
- −$5,818
- Taxable loss
- −$6,160
- Est. tax savings @ 24.0%
- +$1,479
- After-tax cash flow
- $-1,239/yr
For passive investors: Depreciation is non-cash, so a rental often shows a tax loss while cash-flowing — sheltering income. Rental losses are passive: they offset passive income freely, and up to $25,000/yr can offset ordinary (W-2) income if you actively participate and your MAGI is under $100k (phasing out to $0 by $150k); unused losses carry forward. On sale, claimed depreciation is recaptured at up to 25%, and gains may owe capital-gains tax (a 1031 exchange can defer both). Figures are a year-1 estimate at your 24.0% rate — not tax advice; consult a CPA.
Schools (NCES district)
- District
- Minneapolis Public School District
- NCES district ID
- 2721240
- Math proficiency
- 35% ▼ -7.00%
- Reading proficiency
- 46% ▼ -1.00%
- Median HH income
- $50,521
- Composite
- 34.92/100
- National rank
- #5067
- State rank
- #217 of 301 in MN
Livability — Minneapolis
- Score
- 78/100
- State rank
- #110
- US rank
- #2525
Category grades
Schools grade is shown separately in the Schools card above.
Census & demographics
- Census place
- Minneapolis, MN
- County
- Hennepin County · 1,150,272 people
- City population
- 417,555
- Metro
- Minneapolis-St. Paul-Bloomington, MN-WI
- Population (ZIP)
- 37,667
- Household income
- $78,464
- Rent vs Own
- Severe rent burden
- 1583.0
Population outlook (Hennepin County) Hauer SSP2
- Today (2025)
- 1,405,227 people
- By 2030
- 1,492,650 · +6.2%
- By 2040
- 1,660,157 · +18.1%
- By 2050
- 1,823,498 · +29.8%
- By 2075
- 2,221,283 · +58.1%
- By 2100
- 2,509,976 · +78.6%
Race, ethnicity, and origin ACS 2023
- Neighborhood character
- Diverse neighborhood (Simpson 0.66)
- Race & ethnicity
- White 50% Hispanic / Latino 23% Black 18% Two or more races 10% Asian 2% Native American 2%
- Hispanic origin (detail)
- Mexican 15%
- Common ancestry
- Portuguese 8% Romanian 3% Lithuanian 2%
- Foreign-born
- 18% · Canada, Jamaica
- Languages at home
- 68% English-only · Spanish 20% Other Asian/Pacific 1%
Political lean MEDSL · Hennepin
- 2024 margin
- Solid D (+42.6) · D 70.2% · R 27.5% · Other 2.3%
- 2008→2024 swing
- +14.0pp toward D · 2008: 28.6pp · 2024: 42.6pp
- All cycles
- 2024: D+42.6 2020: D+43.2 2016: D+35.3 2012: D+27.1 2008: D+28.6
Not yet ingested
- Civics
- —
Market trends
- HPI YoY
- ▼ -211.97%
- Current HPI
- 292.0322
- Rent YoY
- ▲ 4.30%
- Metro
- Minneapolis-St. Paul-Bloomington, MN-WI
- State GDP YoY
- ▲ 2.41%
- F500 in state
- 34
Industry mix (Fortune 500 HQ in MN)
| Industry | F500 HQs | Revenue |
|---|---|---|
| Healthcare | 2 | $407B |
|
||
| Retail | 2 | $150B |
|
||
| Consumer Goods | 2 | $32B |
|
||
| Industrial Machinery | 2 | $6B |
|
||
| Agriculture | 1 | $40B |
|
||
| Healthcare / Medical Devices | 1 | $32B |
|
||
Price history
+225.7% since first listed4 events — show timeline
- 2026-05-29 Contingent — NORTHSTARMLS as Distributed by MLS Grid
- 2026-05-16 Listed $200,000 NORTHSTARMLS as Distributed by MLS Grid
- 2026-05-12 Coming Soon $200,000 NORTHSTARMLS as Distributed by MLS Grid
- 1990-11-15 Sold (Public Records) $61,400 Public Records
Property tax history
+1.4%/yrLatest (2025): $1,749 · -0.6% YoY. Source: county tax records.
Cash-flow waterfall
monthlySold comps — $/sqft
last 12 mo · ≤1 miLoading sold comps…