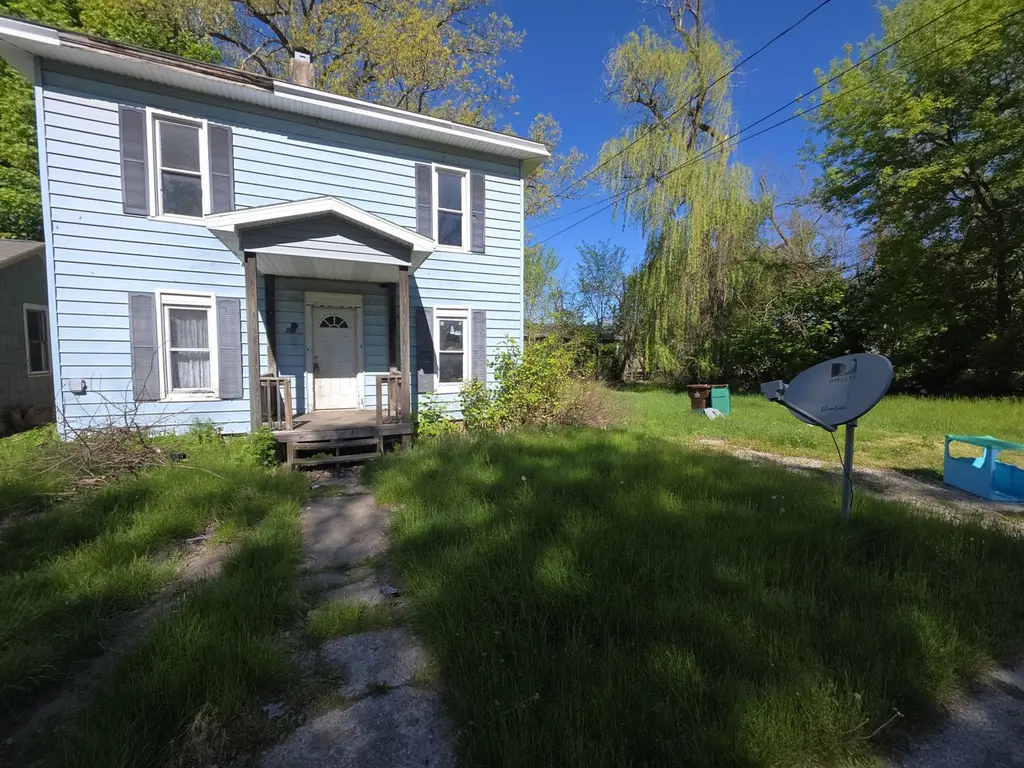
206 S Berrien St · Albion, MI
Flood risk 2/10 · Minimal
- FEMA flood zone
- X (unshaded)
- Chance of flooding over 30 yrs
- 0.09%
- Est. flood insurance / yr
- $473 – $860
Fire risk 1/10 · Minimal
- Est. fire insurance / yr
- $784 – $1,456
Heat risk 2/10 · Minimal
- Hot days now (above 97°F)
- 7 days/yr
- Hot days in 30 yrs
- 16 days/yr
Wind risk 2/10 · Minimal
- Chance of severe wind over 30 yrs
- —
Air-quality risk 2/10 · Minimal
- Unhealthy air days now
- 1 days/yr
- Unhealthy air days in 30 yrs
- 2 days/yr
Risk factors via First Street. Map © Google.
Why this score? — see what drove the B- grade
The composite is a weighted blend of 9 inputs, each scored 0–100. Each bar is that input's sub-score; the figure is the points it added to the 100-point composite (weight × sub-score).
- Cash flow +30.0/30.0
- 1% rule +10.0/10.0
- DSCR +10.0/10.0
- ARV discount +7.5/15.0
- Livability +3.5/5.0
- Schools +3.1/10.0
- Rent growth +2.5/5.0
- Condition / age +2.5/5.0
- Appreciation +0.0/10.0
$45,000
🖨 Deal sheet (PDF) 📄 Offer letter ✓ Due diligence
Listing remarks MLS
Spacious 5 bed home needing rehab but would be a great investment opportunity. Walking distance to collage would make a good rental property as well. Make an offer and make it a great home again.
Key facts
- Rental property
- 3,964 sq ft lot
- Built 1890
Tags
Property features AI
Exterior
- Home design: Traditional-style single family residence; Residential property
- Construction: Vinyl siding; Built in 1890
- Exterior features: Public water
Interior
- Bathrooms: 1 full bathroom
- Heating & cooling: Forced air heating; Has heating
- Interior features: 9 total rooms; Michigan-style basement
Neighborhood map
What this means for you Summary
Snapshot
- This is a 4-bed/2.0-bath single-family listed at $45k.
Deal economics
- At list price, monthly cash flow is $713 ($9k/yr) — positive.
- The deal already cash-flows at list — no discount required.
- Meets the 1% rule at list price ($1k rent vs $45k).
- Recommended offer: $44k (3.0% below list) — sets the bar for market timing.
- Cap rate 25.3% vs local median 8.3% in Albion — top-decile yield for the area; either an underpriced asset or a hidden risk that comps aren't pricing in. Stress-test before assuming the spread holds.
Location & tenants
- Location reads 70/100 on livability (#328 in MI) — a middle-class / working-renter tenant base. Strengths: cost of living A+, housing A+, health & safety A+; Watch: commute C-, amenities D+, crime F.
- Marshall Public Schools (town): math 28% / reading 44% proficiency, ranked #268 of 540 in MI (top 50%) — families likely to look elsewhere, expect single-tenant / working-renter base with shorter leases.
- Zoned schools: Marshall Middle School (math 22% / reading 40%, grade F, #329 of 493 statewide, top 67%, 547 students, 50% FRL).
- Market conditions: 137 active listings in the ZIP; 132 units permitted in Calhoun County in 2024 (0 in 5+ unit buildings).
Forward outlook
- Local home prices are declining (-3.0%/yr); year-one equity from $311 of loan paydown is wiped out by about $1k of value loss. Plan a longer hold.
- Calhoun County population projected at -16% by 2050 — secular population decline; favor cash flow + early exit over multi-decade hold.
- At projected returns (-3.0% appreciation + 3.0% rent growth), your $13k cash investment doubles in ~2 years — after that, you're playing with house money.
Negotiation context
- It's been on market 37 days — a 3% lower offer ($44k) is reasonable based on typical stale-listing flexibility.
- 3 sale attempts; this cycle's ask has dropped $15k (25%) from the opening price — seller is motivated, your offer sets the floor, not the list.
Risks & watch-outs
- Watch-outs: property tax is 5.0% of price; built in 1890 — expect roof / HVAC / electrical / plumbing capex.
Questions for the listing agent
- It's been on market 37 days. Have you received any prior offers? Is the seller open to a 3% concession, seller financing, or rate buy-down credit?
- Built in 1890 — when were the roof, HVAC, electrical panel, plumbing, and water heater last replaced?
- Property tax is high relative to price — has the assessment been appealed recently, and will the sale trigger a re-assessment?
- Is there a deadline driving the sale (1031 exchange, divorce, estate, relocation)? That informs how much negotiation room exists.
- Schools are F-rated, which usually means shorter tenancies and higher turnover. Who's the typical renter profile here, and what's been the actual vacancy rate?
- Crime grade is F in this area — have there been break-ins, vandalism, or insurance claims at this property in the last 3 years? What carrier currently insures it and at what premium?
- What's the average days-on-market for RENTAL listings here right now (not sales)? A rising rental-DOM trend means longer vacancies and softer asking-rent achievability than the comps imply.
- What's the recent tenant-quality profile in this submarket — average credit score on applications, eviction rate, late-payment / NSF rate, and stable-employment percentage? A property-management company in the area should have these aggregated.
- How much new for-sale + rental construction is in the pipeline within 1–3 miles? Heavy new supply typically softens prices + rents 12–24 months out; constrained supply supports both.
Investment metrics
- 1% rule
- 3.25% ✓
- Cap rate
- 25.30%
- Cash-on-cash
- 67.89%
- DSCR
- 4.02
- GRM
- 2.6
CMA / ARV
- ARV (median comp)
- $143,978
- List price
- $45,000
- Delta
- -68.75%
- Verdict
- UNDERPRICED
- Comps
- 20 within 1.0 mi
Show comp detail 12 sales within ~0.75 mi
| Address | Dist | Beds/Ba | Sqft | Sold | Price | $/sf | Match |
|---|---|---|---|---|---|---|---|
| 505 Fitch St | 0.45mi | 4/2.0 | 1,630 (+1%) | 4mo | $170,000 | $104 | 73 |
| 415 E Cass St | 0.09mi | 3/2.0 (-1) | 1,494 (-7%) | 9mo | $179,000 | $120 | 71 |
| 511 Perry St | 0.18mi | 4/2.0 | 1,416 (-12%) | 10mo | $221,000 | $156 | 63 |
| 704 E Erie St | 0.31mi | 3/1.5 (-1) | 1,680 (+4%) | 10mo | $165,900 | $99 | 63 |
| 212 W Ash St | 0.38mi | 3/1.0 (-1) | 1,564 (-3%) | 8mo | $47,000 | $30 | 62 |
| 410 Elizabeth St | 0.23mi | 4/2.0 | 1,803 (+12%) | 11mo | $225,000 | $125 | 60 |
| 105 S Eaton St | 0.36mi | 3/2.0 (-1) | 1,440 (-10%) | 8mo | $36,000 | $25 | 54 |
| 706 N Monroe St | 0.40mi | 3/2.5 (-1) | 1,416 (-12%) | 3mo | $25,000 | $18 | 52 |
| 418 Darrow St | 0.29mi | 3/1.5 (-1) | 1,800 (+12%) | 10mo | $180,000 | $100 | 52 |
| 614 N Ann St | 0.62mi | 3/1.5 (-1) | 1,500 (-7%) | 4mo | $89,000 | $59 | 50 |
| 501 W Cass St | 0.52mi | 4/2.0 | 1,820 (+13%) | 7mo | $124,900 | $69 | 48 |
| 517 Mechanic St | 0.71mi | 3/1.0 (-1) | 1,424 (-11%) | 10mo | $70,000 | $49 | 30 |
Match score weights: distance 35% · size 25% · config 20% · recency 20%. Top-matched comps best support the ARV.
Projected returns pro-forma
-3.0% appreciation · 3.0% rent growth · sell at horizon
- IRR
- 67.4%
- Equity multiple
- 4.03×
- Total profit
- $38,214
- Equity at exit
- $6,710
- IRR
- 71.6%
- Equity multiple
- 8.31×
- Total profit
- $92,156
- Equity at exit
- $3,891
Cash invested: $12,600 (down + closing). Projections, not guarantees.
Landlord ↔ Tenant lean methodology
- Overall (STATE)
- 62 Landlord-Friendly
- State Michigan
- 62 Landlord-Friendly · EVEN
- County
- — inherits STATE
- City
- — inherits STATE
ZIP-level market 49224
- Home prices YoY
- -24.9%
- Active inventory
- 137
- Price-to-rent
- 2.6×
Monthly cashflow live
- Estimated rent
- $1,462 medium interval (Pro) →
- Mortgage (P&I)
- −$236
- Tax from tax record
- −$187 /mo · $2,244/yr
- Insurance
- −$19
- HOA
- −$0
- Vacancy / Maint / Mgmt
- −$307
- Net cashflow
- $713
Break-even live
Sensitivity live
| Price | -10% $875 | -5% $859 | +0% $713 | +5% $700 | +10% $687 |
|---|---|---|---|---|---|
| Rent | -10% $597 | -5% $655 | +0% $713 | +5% $771 | +10% $828 |
| Rate | -1.0pp $736 | -0.5pp $724 | base $713 | +0.5pp $701 | +1.0pp $689 |
UW: 25.0% down · 7.5% · 30yr · 1.5% tax · 5.0% vac · 8.0% maint · 8.0% mgmt
Financing live
Cash to close
- Down payment
- $11,250
- Closing costs
- $1,350
- Reserves months
- —
- Total cash needed
- —
Loan-product check · same deal, 3 products live
Conventional
25% down · 7.5% · 30yr
- Down + closing
- —
- Monthly P&I
- —
- Monthly cashflow
- —
- DSCR
- —
- Eligible?
- —
Personal DTI + credit; lowest rate.
DSCR
20% down · 8.5% · 30yr
- Down + closing
- —
- Monthly P&I
- —
- Monthly cashflow
- —
- DSCR
- —
- Eligible?
- —
No personal income docs; deal must DSCR.
Hard money
10% down · 12.0% · 12mo
- Down + closing
- —
- Monthly P&I
- —
- Monthly cashflow
- —
- DSCR
- —
- Eligible?
- —
Short-term bridge; refi at stabilization.
Listing history 22 events
-
2026-06-22days on market $45,000 Active 37 DOM
-
2026-06-19days on market $45,000 Active 35 DOM
-
2026-06-18days on market $45,000 Active 34 DOM
-
2026-06-17days on market $45,000 Active 33 DOM
-
2026-06-16days on market $45,000 Active 32 DOM
Show marketing remark (195 chars)
Spacious 5 bed home needing rehab but would be a great investment opportunity. Walking distance to collage would make a good rental property as well. Make an offer and make it a great home again.
-
2026-06-15price $45,000 Active 31 DOM
Show marketing remark (196 chars)
Spacious 5 bed home needing rehab but would be a great investment opportunity. Walking distance to collage would make a good rental property as well. Make an offer and make it a great home again.
-
2026-06-15days on market $52,000 Active 31 DOM
Show marketing remark (196 chars)
Spacious 5 bed home needing rehab but would be a great investment opportunity. Walking distance to collage would make a good rental property as well. Make an offer and make it a great home again.
-
2026-06-14days on market $52,000 Active 29 DOM
-
2026-06-13days on market $52,000 Active 28 DOM
-
2026-06-10days on market $52,000 Active 26 DOM
-
2026-06-09days on market $52,000 Active 25 DOM
-
2026-06-08days on market $52,000 Active 24 DOM
-
2026-06-07days on market $52,000 Active 23 DOM
-
2026-06-05days on market $52,000 Active 20 DOM
-
2026-06-03pricedays on market $52,000 Active 19 DOM
Show marketing remark (196 chars)
Spacious 5 bed home needing rehab but would be a great investment opportunity. Walking distance to collage would make a good rental property as well. Make an offer and make it a great home again.
-
2026-06-02days on market $59,900 Active 18 DOM
-
2026-06-01days on market $59,900 Active 17 DOM
-
2026-05-31days on market $59,900 Active 16 DOM
-
2026-05-30days on market $59,900 Active 15 DOM
-
2026-05-13$59,900 Active 196-char remark
Show marketing remark (196 chars)
Spacious 5 bed home needing rehab but would be a great investment opportunity. Walking distance to collage would make a good rental property as well. Make an offer and make it a great home again.
-
2026-05-13$59,900 Active 196-char remark
Show marketing remark (196 chars)
Spacious 5 bed home needing rehab but would be a great investment opportunity. Walking distance to collage would make a good rental property as well. Make an offer and make it a great home again.
-
2026-05-13$59,900 Active
Show marketing remark (196 chars)
Spacious 5 bed home needing rehab but would be a great investment opportunity. Walking distance to collage would make a good rental property as well. Make an offer and make it a great home again.
ⓘ Source: listings_history table (triggers on properties + properties_extension) + one-shot
backfill from property_details.listing_events for pre-trigger history.
Tax reassessment forecast MI · Partial reset (capped growth)
- Current annual tax
- $2,244 · $187/mo
- Projected year-2 tax
- $2,244 · $187/mo
- Expected delta
- $0/yr ($0/mo · 0.0%)
ⓘ Screening estimate from a state-policy table — verify with the county assessor before closing.
Climate risk First Street
- Flood 2/10 Low FEMA zone X (unshaded) · 9% chance over 30 yrs
- Wildfire 1/10 Low
- Heat 2/10 Low 7 d/yr ≥97°F today · 16 d/yr by 30 yrs out
- Wind 2/10 Low
- Air quality 2/10 Low 1 unhealthy d/yr today · 2 by 30 yrs out
Nearby sold comps map
Loading sold comps map…
Walkable amenities ~0.75 mi
Loading nearby amenities…
Taxation est. · year 1
- Rental income
- $17,539
- − Mortgage interest
- −$2,521
- − Property taxes
- −$2,244
- − Insurance
- −$225
- − Repairs & maintenance
- −$1,403
- − Management
- −$1,403
- − Depreciation
- −$1,309
- Taxable income
- $8,433
- Est. tax owed @ 24.0%
- −$2,024
- After-tax cash flow
- $6,530/yr
For passive investors: Depreciation is non-cash, so a rental often shows a tax loss while cash-flowing — sheltering income. Rental losses are passive: they offset passive income freely, and up to $25,000/yr can offset ordinary (W-2) income if you actively participate and your MAGI is under $100k (phasing out to $0 by $150k); unused losses carry forward. On sale, claimed depreciation is recaptured at up to 25%, and gains may owe capital-gains tax (a 1031 exchange can defer both). Figures are a year-1 estimate at your 24.0% rate — not tax advice; consult a CPA.
Schools (NCES district)
- District
- Marshall Public Schools
- NCES district ID
- 2622970
- Math proficiency
- 28% ▼ -4.00%
- Reading proficiency
- 44% ▼ -2.00%
- Median HH income
- $48,020
- Composite
- 30.93/100
- National rank
- #6112
- State rank
- #268 of 540 in MI
Livability — Albion
- Score
- 70/100
- State rank
- #328
- US rank
- #8096
Category grades
Schools grade is shown separately in the Schools card above.
Census & demographics
- Census place
- Albion, MI
- Population (ZIP)
- 13,309
Population outlook (Calhoun County) Hauer SSP2
- Today (2025)
- 130,157 people
- By 2030
- 126,691 · -2.7%
- By 2040
- 118,517 · -8.9%
- By 2050
- 109,855 · -15.6%
- By 2075
- 90,486 · -30.5%
- By 2100
- 70,766 · -45.6%
Race, ethnicity, and origin ACS 2023
- Neighborhood character
- Predominantly White (69%)
- Race & ethnicity
- White 69% Black 20% Two or more races 6% Hispanic / Latino 5%
- Common ancestry
- Romanian 3% Lithuanian 1% Iranian 1%
- Foreign-born
- 1% · Canada
- Languages at home
- 96% English-only · Spanish 2% Arabic 1% German/W. Germanic 1%
Political lean MEDSL · Calhoun
- 2024 margin
- R (+14.1) · D 42.3% · R 56.4% · Other 1.3%
- 2008→2024 swing
- -23.4pp toward R · 2008: 9.4pp · 2024: -14.1pp
- All cycles
- 2024: R+14.1 2020: R+11.1 2016: R+12.5 2012: D+1.6 2008: D+9.4
Not yet ingested
- Civics
- —
Market trends
- HPI YoY
- ▼ -67.85%
- Current HPI
- 205.078
- Rent YoY
- —
- Metro
- —
- State GDP YoY
- ▲ 1.37%
- F500 in state
- 28
Industry mix (Fortune 500 HQ in MI)
| Industry | F500 HQs | Revenue |
|---|---|---|
| Automotive Parts | 3 | $48B |
|
||
| Automotive | 2 | $372B |
|
||
| Chemicals | 1 | $45B |
|
||
| Automotive Retail | 1 | $29B |
|
||
| Healthcare / Medical Devices | 1 | $23B |
|
||
| Automotive Technology | 1 | $20B |
|
||
Price history
-24.9% since first listed9 events — show timeline
- 2026-06-16 Price Changed $45,000 MiRealSource-MiMLS
- 2026-06-15 Price Changed $45,000 REALCOMP
- 2026-06-15 Price Changed $45,000 SW Michigan MLS
- 2026-06-03 Price Changed $52,000 MiRealSource-MiMLS
- 2026-06-03 Price Changed $52,000 REALCOMP
- 2026-06-03 Price Changed $52,000 SW Michigan MLS
- 2026-05-13 Listed $59,900 SW Michigan MLS
- 2026-05-13 Listed $59,900 REALCOMP
- 2026-05-13 Listed $59,900 MiRealSource-MiMLS
Property tax history
+27.0%/yrLatest (2025): $2,244 · +175.5% YoY. Source: county tax records.
Cash-flow waterfall
monthlySold comps — $/sqft
last 12 mo · ≤1 miLoading sold comps…