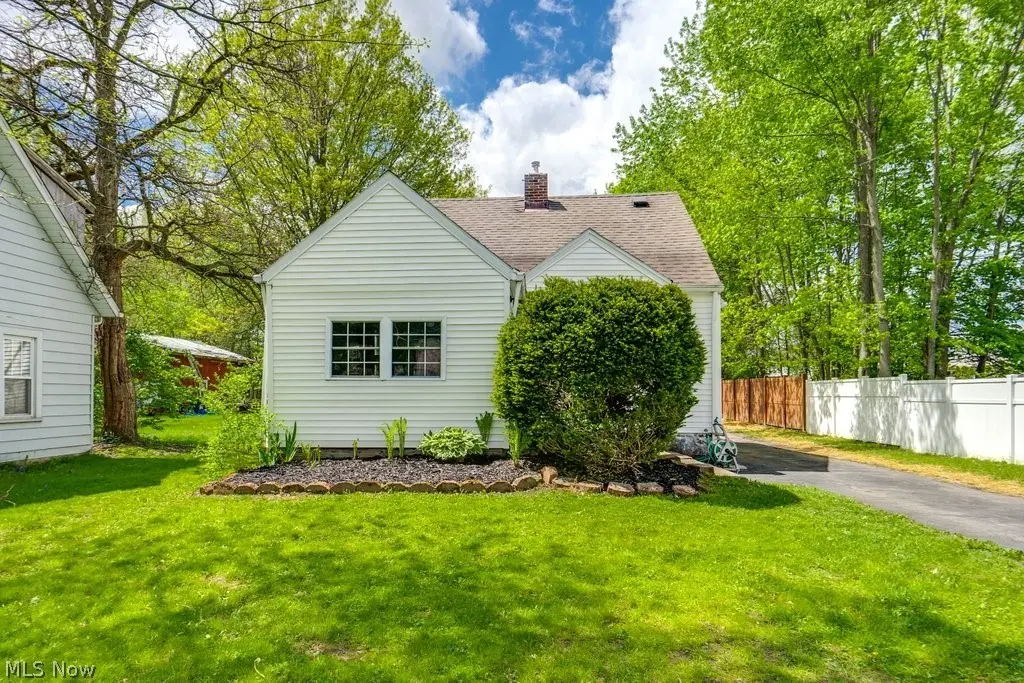
7086 Mackenzie Rd · North Olmsted, OH
Flood risk 1/10 · Minimal
- FEMA flood zone
- X (unshaded)
- Chance of flooding over 30 yrs
- 0.0%
- Est. flood insurance / yr
- $473 – $860
Fire risk 1/10 · Minimal
- Est. fire insurance / yr
- $713 – $1,323
Heat risk 2/10 · Minimal
- Hot days now (above 97°F)
- 7 days/yr
- Hot days in 30 yrs
- 16 days/yr
Wind risk 1/10 · Minimal
- Chance of severe wind over 30 yrs
- —
Air-quality risk 2/10 · Minimal
- Unhealthy air days now
- 1 days/yr
- Unhealthy air days in 30 yrs
- 3 days/yr
Risk factors via First Street. Map © Google.
Why this score? — see what drove the C- grade
The composite is a weighted blend of 9 inputs, each scored 0–100. Each bar is that input's sub-score; the figure is the points it added to the 100-point composite (weight × sub-score).
- ARV discount +15.0/15.0
- Cash flow +14.9/30.0
- Schools +6.1/10.0
- 1% rule +5.0/10.0
- DSCR +4.6/10.0
- Livability +4.3/5.0
- Rent growth +2.5/5.0
- Condition / age +2.5/5.0
- Appreciation +0.0/10.0
$159,900
🖨 Deal sheet 📄 Offer letter ✓ Due diligence
Listing remarks
Investor opportunity! Strong potential with solid upside. Property is being sold as-is, and the seller will make no repairs. Basement wall bowing/foundation concerns reflected in the price. Cash or renovation financing preferred. Excellent opportunity for an investor, rehabber, or buyer looking to build sweat equity. This 3-bedroom, 2-full-bath Cape Cod sits on a nearly half-acre lot and offers a flexible layout. The home features a detached two-car garage, additional parking pad, spacious concrete patio, and plenty of yard space. Inside, the main level includes multiple living/flex spaces, an eat-in kitchen with ample cabinet space, a first-floor bedroom with patio access, and a full bath
Key facts
- Eat-in kitchen
- Versatile front room
- 0.47 acre lot
Tags
Property features AI
Exterior
- Parking: Detached garage; 2 garage spaces; Driveway, paved parking pad; garage faces front
- Utilities: Public water; Public sewer
- Home design: 2-story home; Faces east
- Construction: Vinyl siding; Asphalt/fiberglass roof; Built per public records
- Exterior features: Patio; Back and front yard; Rectangular, wooded lot; Property has a view; Lot dimensions approximately 50 x 406
Interior
- Kitchen: Range; Dishwasher; Refrigerator
- Bedrooms: Main level: 1 bedroom; Second level: multiple bedrooms including loft and bedrooms
- Bathrooms: 2 full bathrooms; 1 full bathroom on the main level
- Heating & cooling: Forced-air heating (gas); Ceiling fans for cooling
- Interior features: Eat-in kitchen; Primary bedroom on main level; Full, unfinished basement; Basement fireplace
- Laundry & utility: Washer and dryer; Laundry located in the basement
Neighborhood map
What this means for you Summary
Snapshot
- This is a 2-bed/1.0-bath single-family listed at $160k.
Deal economics
- At list price, monthly cash flow is $47 ($568/yr) — positive.
- The deal already cash-flows at list — no discount required.
- To meet the 1% rule (rent ≥ 1% of price), the offer needs to be $160k (0.1% below list).
- Recommended offer: $160k (0.1% below list) — sets the bar for 1% rule.
- Cap rate 6.6% vs local median 4.0% in North Olmsted — top-decile yield for the area; either an underpriced asset or a hidden risk that comps aren't pricing in. Stress-test before assuming the spread holds.
Location & tenants
- Location reads 86/100 on livability (#38 in OH, #372 nationally) — a professional / high-income tenant draw. Strengths: crime A+, amenities A+, employment A+; Watch: commute F.
- Olmsted Falls City (suburban): math 70% / reading 70% proficiency, ranked #134 of 656 in OH (top 20%) — strong family-tenant draw, lease renewals of 3-5y typical; only 13% free/reduced lunch — higher-income household profile.
- Market conditions: 183 active listings in the ZIP; 3 comparable units currently listed for rent nearby; rentals leasing fast (median 3d on market — plan ~1-2 weeks tenant-placement turnaround); solid renter incomes; 1,441 units permitted in Cuyahoga County in 2024 (700 in 5+ unit buildings).
Forward outlook
- Local home prices are declining (-3.0%/yr); year-one equity from $1k of loan paydown is wiped out by about $5k of value loss. Plan a longer hold.
- Cuyahoga County population projected to shrink 8% by 2050 — rents likely to lag national; underwrite the cash flow, not the appreciation.
Negotiation context
- Only 8 days on market — expect competitive offers; lowballing is unlikely to land.
- 2 sale attempts; this cycle's ask has dropped $10k (6%) from the opening price — seller is motivated, your offer sets the floor, not the list.
Risks & watch-outs
- Watch-outs: built in 1941 — expect roof / HVAC / electrical / plumbing capex.
Questions for the listing agent
- Built in 1941 — when were the roof, HVAC, electrical panel, plumbing, and water heater last replaced?
- Is there a deadline driving the sale (1031 exchange, divorce, estate, relocation)? That informs how much negotiation room exists.
- Schools are B-rated — typically a magnet for longer-tenancy family renters. What's the average tenant stay here, and is there a school-zone premium baked into asking?
- What's the average days-on-market for RENTAL listings here right now (not sales)? A rising rental-DOM trend means longer vacancies and softer asking-rent achievability than the comps imply.
- What's the recent tenant-quality profile in this submarket — average credit score on applications, eviction rate, late-payment / NSF rate, and stable-employment percentage? A property-management company in the area should have these aggregated.
- How much new for-sale + rental construction is in the pipeline within 1–3 miles? Heavy new supply typically softens prices + rents 12–24 months out; constrained supply supports both.
Investment metrics
- 1% rule
- 1.00% ✗
- Cap rate
- 6.65%
- Cash-on-cash
- 1.27%
- DSCR
- 1.06
- GRM
- 8.3
CMA / ARV
- ARV (median comp)
- $216,354
- List price
- $159,900
- Delta
- -26.09%
- Verdict
- UNDERPRICED
- Comps
- 20 within 1.0 mi
Show comp detail 12 sales within ~0.75 mi
| Address | Dist | Beds/Ba | Sqft | Sold | Price | $/sf | Match |
|---|---|---|---|---|---|---|---|
| 7086 Mackenzie Rd | 0.00mi | 3/2.0 (+1) | 988 (0%) | 0mo | $162,500 | $164 | 91 |
| 6991 Mckenzie Rd | 0.10mi | 2/1.0 | 973 (-2%) | 15mo | $149,900 | $154 | 81 |
| 6706 Crestwood Ln | 0.50mi | 3/1.0 (+1) | 964 (-2%) | 6mo | $186,000 | $193 | 63 |
| 6720 Mackenzie Rd | 0.42mi | 3/1.0 (+1) | 1,064 (+8%) | 22mo | $180,000 | $169 | 44 |
| 6899 Mckenzie Rd | 0.22mi | 3/1.5 (+1) | 1,124 (+14%) | 20mo | $230,000 | $205 | 44 |
| 6560 Mackenzie Rd | 0.56mi | 3/1.0 (+1) | 1,131 (+14%) | 5mo | $245,000 | $217 | 40 |
| 28628 Aspen Dr | 0.64mi | 3/1.5 (+1) | 1,116 (+13%) | 3mo | $265,000 | $237 | 39 |
| 26925 Southwood Ln | 0.54mi | 3/2.0 (+1) | 1,104 (+12%) | 16mo | $240,000 | $217 | 33 |
| 26919 Westwood Ln | 0.72mi | 3/2.0 (+1) | 1,041 (+5%) | 21mo | $265,000 | $255 | 31 |
| 26949 Eastwood Ln | 0.65mi | 3/1.5 (+1) | 1,102 (+12%) | 21mo | $275,000 | $250 | 26 |
| 6495 Mackenzie Rd | 0.63mi | 3/2.0 (+1) | 1,120 (+13%) | 22mo | $275,000 | $246 | 21 |
| 26934 Eastwood Ln | 0.73mi | 3/2.0 (+1) | 1,102 (+12%) | 20mo | $291,000 | $264 | 21 |
Match score weights: distance 35% · size 25% · config 20% · recency 20%. Top-matched comps best support the ARV.
Projected returns pro-forma
-3.0% appreciation · 3.0% rent growth · sell at horizon
- IRR
- -14.2%
- Equity multiple
- 0.49×
- Total profit
- $-22,804
- Equity at exit
- $23,842
- IRR
- -5.3%
- Equity multiple
- 0.65×
- Total profit
- $-15,603
- Equity at exit
- $13,825
Cash invested: $44,772 (down + closing). Projections, not guarantees.
Landlord ↔ Tenant lean methodology
- Overall (STATE)
- 73 Landlord-Friendly
- State Ohio
- 73 Landlord-Friendly · R+6
- County
- — inherits STATE
- City
- — inherits STATE
ZIP-level market 44138
- Home prices YoY
- -30.8%
- Active inventory
- 183
- Price-to-rent
- 8.3×
Monthly cashflow live
- Estimated rent
- $1,597 medium interval (Pro) →
- Mortgage (P&I)
- −$839
- Tax from tax record
- −$309 /mo · $3,709/yr
- Insurance
- −$67
- HOA
- −$0
- Vacancy / Maint / Mgmt
- −$335
- Net cashflow
- $47
Break-even live
UW: 25.0% down · 7.5% · 30yr · 1.5% tax · 5.0% vac · 8.0% maint · 8.0% mgmt
Financing live
Cash to close
- Down payment
- $39,975
- Closing costs
- $4,797
- Reserves months
- —
- Total cash needed
- —
Loan-product check · same deal, 3 products live
Conventional
25% down · 7.5% · 30yr
- Down + closing
- —
- Monthly P&I
- —
- Monthly cashflow
- —
- DSCR
- —
- Eligible?
- —
Personal DTI + credit; lowest rate.
DSCR
20% down · 8.5% · 30yr
- Down + closing
- —
- Monthly P&I
- —
- Monthly cashflow
- —
- DSCR
- —
- Eligible?
- —
No personal income docs; deal must DSCR.
Hard money
10% down · 12.0% · 12mo
- Down + closing
- —
- Monthly P&I
- —
- Monthly cashflow
- —
- DSCR
- —
- Eligible?
- —
Short-term bridge; refi at stabilization.
Rent comps 3 comps
| Address | Beds | Baths | Sqft | Rent | $/sqft | DOM | Units | Dist |
|---|---|---|---|---|---|---|---|---|
| 27080 Oakwood Dr Olmsted Falls, OH | 1.0–2.0 | 1.0–2.0 | 975 | $1,780 | $1.83 | 1d | 39 | 0.49mi |
| 26875 Bagley Rd Olmsted Twp, OH | 1.0–3.0 | 1.0–2.0 | 890 | $1,199 | $1.35 | 2d | 1 | 1.35mi |
| 30349 Lorain Rd North Olmsted, OH | 2.0 | 1.0 | 1000 | $1,450 | $1.45 | 7d | 1 | 1.36mi |
Listing history 5 events
-
2026-05-14status Pending 1047-char remark
-
2026-05-11status Active 1047-char remark
-
2026-05-11price $159,900 1047-char remark
-
2026-05-05status Pending 1047-char remark
-
2026-04-30$169,900 Active 1047-char remark
ⓘ Source: listings_history table (triggers on properties + properties_extension) + one-shot
backfill from property_details.listing_events for pre-trigger history.
Tax reassessment forecast OH · Partial reset (capped growth)
- Current annual tax
- $3,709 · $309/mo
- Projected year-2 tax
- $3,709 · $309/mo
- Expected delta
- $0/yr ($0/mo · 0.0%)
ⓘ Screening estimate from a state-policy table — verify with the county assessor before closing.
Climate risk First Street
- Flood 1/10 Low FEMA zone X (unshaded) · 0% chance over 30 yrs
- Wildfire 1/10 Low
- Heat 2/10 Low 7 d/yr ≥97°F today · 16 d/yr by 30 yrs out
- Wind 1/10 Low
- Air quality 2/10 Low 1 unhealthy d/yr today · 3 by 30 yrs out
Nearby sold comps map
Loading sold comps map…
Walkable amenities ~0.75 mi
Loading nearby amenities…
Taxation est. · year 1
- Rental income
- $19,164
- − Mortgage interest
- −$8,957
- − Property taxes
- −$3,709
- − Insurance
- −$800
- − Repairs & maintenance
- −$1,533
- − Management
- −$1,533
- − Depreciation
- −$4,652
- Taxable loss
- −$2,020
- Est. tax savings @ 24.0%
- +$485
- After-tax cash flow
- $1,053/yr
For passive investors: Depreciation is non-cash, so a rental often shows a tax loss while cash-flowing — sheltering income. Rental losses are passive: they offset passive income freely, and up to $25,000/yr can offset ordinary (W-2) income if you actively participate and your MAGI is under $100k (phasing out to $0 by $150k); unused losses carry forward. On sale, claimed depreciation is recaptured at up to 25%, and gains may owe capital-gains tax (a 1031 exchange can defer both). Figures are a year-1 estimate at your 24.0% rate — not tax advice; consult a CPA.
Schools (NCES district)
- District
- Olmsted Falls City
- NCES district ID
- 3904657
- Math proficiency
- 70% ▼ -14.00%
- Reading proficiency
- 70% ▼ -10.00%
- Median HH income
- $68,307
- Composite
- 61.12/100
- National rank
- #787
- State rank
- #134 of 656 in OH
Livability — North Olmsted
- Score
- 86/100
- State rank
- #38
- US rank
- #372
Category grades
Schools grade is shown separately in the Schools card above.
Census & demographics
- County
- Cuyahoga · 1,045,444 people
- City population
- 31,924
- Metro
- Cleveland, OH
- Population (ZIP)
- 23,129
- Household income
- $93,877
- Rent vs Own
- Severe rent burden
- 7.6
Population outlook (Cuyahoga County) Hauer SSP2
- Today (2025)
- 1,244,621 people
- By 2030
- 1,230,093 · -1.2%
- By 2040
- 1,189,108 · -4.5%
- By 2050
- 1,145,706 · -7.9%
- By 2075
- 1,076,557 · -13.5%
- By 2100
- 978,987 · -21.3%
Race, ethnicity, and origin ACS 2023
- Neighborhood character
- Predominantly White (85%)
- Race & ethnicity
- White 85% Hispanic / Latino 9% Two or more races 6% Black 3% Asian 2%
- Hispanic origin (detail)
- Mexican 3% Puerto Rican 3%
- Common ancestry
- Romanian 9% Slovak 2% Lithuanian 1%
- Foreign-born
- 6% · Canada, Jamaica, China
- Languages at home
- 93% English-only · Spanish 4% Other Indo-European 1% Arabic 1%
Political lean MEDSL · Cuyahoga
- 2024 margin
- Solid D (+31.5) · D 65.4% · R 33.9%
- 2008→2024 swing
- -7.4pp toward R · 2008: 38.9pp · 2024: 31.5pp
- All cycles
- 2024: D+31.5 2020: D+34.1 2016: D+35.0 2012: D+38.7 2008: D+38.9
Not yet ingested
- Civics
- —
Market trends
- HPI YoY
- ▼ -89.76%
- Current HPI
- 201.9716
- Rent YoY
- —
- Metro
- —
- State GDP YoY
- ▲ 1.98%
- F500 in state
- 48
Industry mix (Fortune 500 HQ in OH)
| Industry | F500 HQs | Revenue |
|---|---|---|
| Insurance | 3 | $145B |
|
||
| Industrial Machinery | 3 | $49B |
|
||
| Financial Services | 3 | $24B |
|
||
| Consumer Goods | 2 | $93B |
|
||
| Aerospace / Defense | 2 | $47B |
|
||
| Utilities | 2 | $33B |
|
||
Price history
-4.4% since first listed6 events — show timeline
- 2026-06-11 Sold (MLS) $162,500 MLSNOW
- 2026-05-14 Pending — MLSNOW
- 2026-05-11 Relisted — MLSNOW
- 2026-05-11 Price Changed $159,900 MLSNOW
- 2026-05-05 Pending — MLSNOW
- 2026-04-30 Listed $169,900 MLSNOW
Property tax history
+4.6%/yrLatest (2025): $3,709 · +21.7% YoY. Source: county tax records.
Cash-flow waterfall
monthlySold comps — $/sqft
last 12 mo · ≤1 miLoading sold comps…