344 Sunshine St · Jacksonville, FL
Flood risk 5/10 · Moderate
- FEMA flood zone
- AE
- Chance of flooding over 30 yrs
- 0.24%
- Est. flood insurance / yr
- $1,737 – $8,500
Fire risk 1/10 · Minimal
- Est. fire insurance / yr
- $947 – $1,759
Heat risk 9/10 · Severe
- Hot days now (above 107°F)
- 7 days/yr
- Hot days in 30 yrs
- 20 days/yr
Wind risk 9/10 · Severe
- Chance of severe wind over 30 yrs
- 99.0%
Air-quality risk 5/10 · Moderate
- Unhealthy air days now
- 7 days/yr
- Unhealthy air days in 30 yrs
- 7 days/yr
Risk factors via First Street. Map © Google.
Why this score? — see what drove the B- grade
The composite is a weighted blend of 9 inputs, each scored 0–100. Each bar is that input's sub-score; the figure is the points it added to the 100-point composite (weight × sub-score).
- Cash flow +30.0/30.0
- DSCR +10.0/10.0
- 1% rule +8.4/10.0
- Appreciation +6.7/10.0
- Livability +4.2/5.0
- Schools +3.9/10.0
- Rent growth +2.9/5.0
- Condition / age +2.5/5.0
- ARV discount +0.0/15.0
$75,000
🖨 Deal sheet (PDF) 📄 Offer letter ✓ Due diligence
Listing remarks MLS
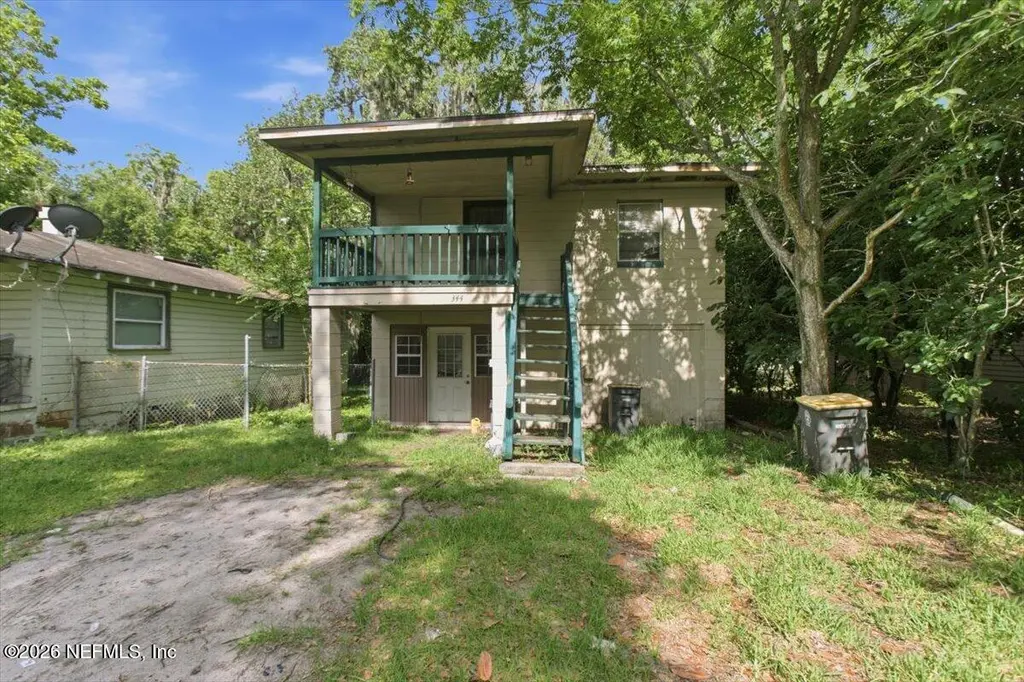
Come enjoy summer nights on the front deck of this one bedroom home located near Hollybrook Park. Home features concrete block construction, open floor plan, and front deck. This is a Fannie Mae HomePath property. Purchase this property for as little as 3% down! This property is approved for HomePath Renovation Mortgage Financing.
Key facts
- Shaded lot
- Mature trees
- Built 1959
Tags
Property features AI
Finance
- HOA & community: Not a senior community
Exterior
- Parking: Off-street parking
- Utilities: Connected to public sewer; Connected to public water
- Home design: Two levels; Single-family residence; Used for residential purposes
- Construction: Other structures present
- Exterior features: Irregular-shaped lot; City street frontage; No private pool
Interior
- Kitchen: Electric range; Refrigerator
- Bedrooms: 1 bedroom
- Bathrooms: 1 full bathroom
- Heating & cooling: Wall/window air conditioning unit(s)
- Interior features: Electric range; Refrigerator
Neighborhood map
What this means for you Summary
Snapshot
- This is a 1-bed/1.0-bath single-family listed at $75k.
Deal economics
- At list price, monthly cash flow is $-141 ($-2k/yr) — negative.
- To cash-flow at today's rent, offer at most $50k (33.3% below list).
- Meets the 1% rule at list price ($1k rent vs $75k).
- Recommended offer: $50k (33.3% below list) — sets the bar for cash-flow.
- Cap rate 10.9% vs local median 3.9% in Jacksonville — top-decile yield for the area; either an underpriced asset or a hidden risk that comps aren't pricing in. Stress-test before assuming the spread holds.
Location & tenants
- Location reads 83/100 on livability (#50 in FL, #911 nationally) — a professional / high-income tenant draw. Strengths: amenities A+, commute A+, housing A+.
- Duval (urban): math 46% / reading 45% proficiency, ranked #48 of 73 in FL (top 66%) — families likely to look elsewhere, expect single-tenant / working-renter base with shorter leases.
- Zoned schools: Ruth N. Upson Elementary School (math 72% / reading 67%, grade A-, #364 of 2,144 statewide, top 19%, 376 students, 61% FRL); Joseph Stilwell Middle School (math 31% / reading 33%, grade F, #448 of 571 statewide, top 79%, 612 students, 68% FRL); Riverside High School (math 24% / reading 39%, grade F, #424 of 667 statewide, top 64%, 1,567 students, 60% FRL).
- Market conditions: Rents rising (+1.7%/yr); 173 active listings in the ZIP; 40 comparable units currently listed for rent nearby; rentals at typical pace (median 19d on market — plan ~3-4 weeks tenant-placement turnaround); lower-income renter base — watch delinquency; 6,503 units permitted in Duval County in 2024 (1,131 in 5+ unit buildings).
- This rent runs 34% of the median local income ($35k/yr) — at the standard rent-burdened threshold; future hikes will face affordability resistance.
Forward outlook
- In year one you build about $3k of equity ($519 loan paydown + $3k appreciation (3.4% local appreciation)).
- Duval County population projected at +19% by 2050 — long-run rental-demand tailwind backs the buy-and-hold thesis.
Negotiation context
- Only 7 days on market — expect competitive offers; lowballing is unlikely to land.
- 5 sale attempts since 20y ago with the ask held roughly flat each time — persistent listings suggest the price (not the market) is what's stuck; bring a comps-based counter.
- Current owner paid $14k; list at $75k implies a 451% gain — meaningful room to come down on a strong offer.
Risks & watch-outs
- Watch-outs: flood insurance adds $427/mo; built in 1959 — expect roof / HVAC / electrical / plumbing capex.
- Climate carrying-cost: in FEMA flood zone AE (mandatory federal flood insurance); severe wind risk, 99% chance of damaging wind over 30y; extreme-heat days projected 7→20/yr by 2055 (HVAC capex compounding) — expect insurance premiums to compound above CPI over the hold.
Questions for the listing agent
- What do current leases actually rent for vs. the listed asking? Can we see a recent rent roll and the last 12 months of T-12 income?
- Built in 1959 — when were the roof, HVAC, electrical panel, plumbing, and water heater last replaced?
- What's the actual annual flood-insurance premium (NFIP or private), and is the property in a SFHA with mandatory coverage?
- Is there a deadline driving the sale (1031 exchange, divorce, estate, relocation)? That informs how much negotiation room exists.
- Schools are B-rated — typically a magnet for longer-tenancy family renters. What's the average tenant stay here, and is there a school-zone premium baked into asking?
- What's the average days-on-market for RENTAL listings here right now (not sales)? A rising rental-DOM trend means longer vacancies and softer asking-rent achievability than the comps imply.
- What's the recent tenant-quality profile in this submarket — average credit score on applications, eviction rate, late-payment / NSF rate, and stable-employment percentage? A property-management company in the area should have these aggregated.
- How much new for-sale + rental construction is in the pipeline within 1–3 miles? Heavy new supply typically softens prices + rents 12–24 months out; constrained supply supports both.
Investment metrics
- 1% rule
- 1.34% ✓
- Cap rate
- 10.86%
- Cash-on-cash
- 16.30%
- DSCR
- 1.73
- GRM
- 6.2
CMA / ARV
- ARV (on-the-fly)
- $61,632
- Comps found
- 4
Show comp detail 4 sales within ~0.75 mi
| Address | Dist | Beds/Ba | Sqft | Sold | Price | $/sf | Match |
|---|---|---|---|---|---|---|---|
| 2839 Edison Ave | 0.10mi | 2/1.0 (+1) | 588 (+2%) | 9mo | $63,000 | $107 | 79 |
| 2841 Edison Ave | 0.10mi | 2/1.0 (+1) | 630 (+9%) | 9mo | $63,000 | $100 | 67 |
| 448 Day Ave | 0.61mi | 2/1.0 (+1) | 630 (+9%) | 7mo | $45,000 | $71 | 45 |
| 2738 Gilmore St | 0.43mi | 2/1.0 (+1) | 651 (+13%) | 13mo | $160,000 | $246 | 42 |
Match score weights: distance 35% · size 25% · config 20% · recency 20%. Top-matched comps best support the ARV.
Projected returns pro-forma
3.41% appreciation · 1.7% rent growth · sell at horizon
- IRR
- 0.5%
- Equity multiple
- 1.03×
- Total profit
- $665
- Equity at exit
- $35,480
- IRR
- 3.5%
- Equity multiple
- 1.55×
- Total profit
- $11,649
- Equity at exit
- $56,086
Cash invested: $21,000 (down + closing). Projections, not guarantees.
Landlord ↔ Tenant lean methodology
- Overall (STATE)
- 87 Strongly Landlord-Friendly
- State Florida
- 87 Strongly Landlord-Friendly · R+3
- County
- — inherits STATE
- City
- — inherits STATE
ZIP-level market 32254
- Home prices YoY
- 1.2%
- Rents YoY
- 1.7%
- Active inventory
- 173
- Price-to-rent
- 6.2×
Monthly cashflow live
- Estimated rent
- $1,004 high interval (Pro) →
- Mortgage (P&I)
- −$393
- Tax from tax record
- −$84 /mo · $1,004/yr
- Insurance
- −$31
- Flood insurance flood zone
- −$427 /mo · $5,118/yr
- HOA
- −$0
- Vacancy / Maint / Mgmt
- −$211
- Net cashflow
- $-141
Break-even live
Sensitivity live
| Price | -10% $-99 | -5% $-120 | +0% $-141 | +5% $-162 | +10% $-184 |
|---|---|---|---|---|---|
| Rent | -10% $-221 | -5% $-181 | +0% $-141 | +5% $-102 | +10% $-62 |
| Rate | -1.0pp $-103 | -0.5pp $-122 | base $-141 | +0.5pp $-161 | +1.0pp $-180 |
UW: 25.0% down · 7.5% · 30yr · 1.5% tax · 5.0% vac · 8.0% maint · 8.0% mgmt
Financing live
Cash to close
- Down payment
- $18,750
- Closing costs
- $2,250
- Reserves months
- —
- Total cash needed
- —
Loan-product check · same deal, 3 products live
Conventional
25% down · 7.5% · 30yr
- Down + closing
- —
- Monthly P&I
- —
- Monthly cashflow
- —
- DSCR
- —
- Eligible?
- —
Personal DTI + credit; lowest rate.
DSCR
20% down · 8.5% · 30yr
- Down + closing
- —
- Monthly P&I
- —
- Monthly cashflow
- —
- DSCR
- —
- Eligible?
- —
No personal income docs; deal must DSCR.
Hard money
10% down · 12.0% · 12mo
- Down + closing
- —
- Monthly P&I
- —
- Monthly cashflow
- —
- DSCR
- —
- Eligible?
- —
Short-term bridge; refi at stabilization.
Rent comps 40 comps
| Address | Beds | Baths | Sqft | Rent | $/sqft | DOM | Units | Dist |
|---|---|---|---|---|---|---|---|---|
| 2551 Calvin St Jacksonville, FL | 2.0 | 1.0 | 658 | $600 | $0.91 | 19d | 1 | 0.45mi |
| 2549 Calvin St Jacksonville, FL | 2.0 | 1.0 | 658 | $600 | $0.91 | 19d | 1 | 0.45mi |
| 2920 Dellwood Ave Unit 4 Jacksonville, FL | 1.0 | 1.0 | 650 | $900 | $1.38 | 12d | 1 | 0.53mi |
| 2920 Dellwood Ave #2 Jacksonville, FL | 1.0 | 1.0 | 650 | $900 | $1.38 | 9d | 1 | 0.53mi |
| 2851 College St Unit 1 Jacksonville, FL | 1.0 | 1.0 | 655 | $1,100 | $1.68 | 25d | 1 | 0.66mi |
| 2853 College St Unit 1 Jacksonville, FL | 1.0 | 1.0 | 655 | $1,100 | $1.68 | 25d | 1 | 0.66mi |
| 2889 College St Jacksonville, FL | — | 1.0 | 642 | $1,000 | $1.56 | 25d | 1 | 0.67mi |
| 2892 College St Unit 2892-2 Jacksonville, FL | 1.0 | 1.0 | 700 | $1,195 | $1.71 | 19d | 1 | 0.70mi |
| 931 Rubel St Unit 14 Jacksonville, FL | — | 1.0 | 400 | $900 | $2.25 | 25d | 1 | 0.70mi |
| 931 Rubel St Unit 4 Jacksonville, FL | — | 1.0 | 400 | $950 | $2.38 | 6d | 1 | 0.70mi |
| 3236 Phyllis St Unit 3244 Jacksonville, FL | 2.0 | 1.0 | 720 | $850 | $1.18 | 25d | 1 | 0.72mi |
| 2613 Green St Jacksonville, FL | 2.0 | 1.0 | 665 | $1,150 | $1.73 | 22d | 1 | 0.72mi |
| 2611 Green St Jacksonville, FL | 2.0 | 1.0 | 728 | $1,195 | $1.64 | 16d | 1 | 0.72mi |
| 2611 Green St Jacksonville, FL | 2.0 | 1.0 | 728 | $1,195 | $1.64 | 25d | 1 | 0.72mi |
| 2877 Post St Unit 07 Jacksonville, FL | 1.0 | 1.0 | 650 | $995 | $1.53 | 19d | 1 | 0.73mi |
| 3250 Phyllis St Jacksonville, FL | 2.0 | 1.0 | 720 | $850 | $1.18 | 25d | 1 | 0.74mi |
| 2659 College St Jacksonville, FL | 1.0 | 1.0 | 639 | $995 | $1.56 | 25d | 1 | 0.74mi |
| 2908 Post St Apt 3 Jacksonville, FL | 1.0 | 1.0 | 720 | $995 | $1.38 | 16d | 1 | 0.77mi |
| 2908 Post St Unit 4 Jacksonville, FL | 1.0 | 1.0 | 720 | $995 | $1.38 | 4d | 1 | 0.77mi |
| 2908 Post St Unit 6 Jacksonville, FL | 1.0 | 1.0 | 500 | $895 | $1.79 | 16d | 1 | 0.77mi |
| 2619 College St Unit 2 Jacksonville, FL | 1.0 | 1.0 | 700 | $1,050 | $1.50 | 25d | 1 | 0.77mi |
| 1052 Willow Branch Ave #2 Jacksonville, FL | 1.0 | 1.0 | 730 | $891 | $1.22 | 25d | 1 | 0.87mi |
| 2359 College St #4 Jacksonville, FL | — | 1.0 | 500 | $1,100 | $2.20 | 25d | 1 | 0.90mi |
| 1098 Cherry St Unit 1 Jacksonville, FL | 1.0 | 1.0 | 700 | $1,250 | $1.79 | 19d | 1 | 0.93mi |
| 3233 Post St Jacksonville, FL | 2.0 | 1.0 | 750 | $1,095 | $1.46 | 25d | 1 | 0.97mi |
| 1078 Day Ave Jacksonville, FL | — | 1.0 | 350 | $995 | $2.84 | 25d | 1 | 1.03mi |
| 2960 Remington St #8 Jacksonville, FL | 1.0 | 1.0 | 500 | $950 | $1.90 | 25d | 1 | 1.03mi |
| 2966 Remington St #4 Jacksonville, FL | 1.0 | 1.0 | 650 | $1,100 | $1.69 | 16d | 1 | 1.04mi |
| 2966 Remington St #4 Jacksonville, FL | 1.0 | 1.0 | 650 | $1,095 | $1.68 | 16d | 1 | 1.04mi |
| 2725 Herschel St Jacksonville, FL | 1.0 | 1.0 | 660 | $921 | $1.40 | 4d | 1 | 1.05mi |
| 3337 Post St Unit 2 Jacksonville, FL | 1.0 | 1.0 | 642 | $925 | $1.44 | 12d | 1 | 1.06mi |
| 3343 Post St Unit 1 Jacksonville, FL | 1.0 | 1.0 | 642 | $925 | $1.44 | 12d | 1 | 1.07mi |
| 2979 Downing St Unit 1 Jacksonville, FL | 1.0 | 1.0 | 700 | $1,170 | $1.67 | 9d | 1 | 1.08mi |
| 2979 Downing St Unit 2 Jacksonville, FL | 1.0 | 1.0 | 700 | $1,250 | $1.79 | 25d | 1 | 1.08mi |
| 2153 Post St Jacksonville, FL | 1.0 | 1.0 | 540 | $875 | $1.62 | 25d | 1 | 1.08mi |
| 1606 King St #1 Jacksonville, FL | 1.0 | 1.0 | 650 | $1,200 | $1.85 | 16d | 1 | 1.08mi |
| 1606 King St Apt 2 Jacksonville, FL | 1.0 | 1.0 | 650 | $1,200 | $1.85 | 25d | 1 | 1.08mi |
| 2775 Herschel St Unit 7 Jacksonville, FL | 1.0 | 1.0 | 700 | $1,050 | $1.50 | 12d | 1 | 1.09mi |
| 2775 Herschel St Unit 7 Jacksonville, FL | 1.0 | 1.0 | 700 | $1,050 | $1.50 | 5d | 1 | 1.09mi |
| 2752 Herschel St #2 Jacksonville, FL | 1.0 | 1.0 | 750 | $1,050 | $1.40 | 4d | 1 | 1.10mi |
Listing history 14 events
-
2026-05-22$75,000 Active
-
2012-10-15soldstatus $13,600 332-char remark
Show marketing remark (332 chars)
Come enjoy summer nights on the front deck of this one bedroom home located near Hollybrook Park. Home features concrete block construction, open floor plan, and front deck. This is a Fannie Mae HomePath property. Purchase this property for as little as 3% down! This property is approved for HomePath Renovation Mortgage Financing.
-
2012-08-07$11,000 332-char remark
Show marketing remark (332 chars)
Come enjoy summer nights on the front deck of this one bedroom home located near Hollybrook Park. Home features concrete block construction, open floor plan, and front deck. This is a Fannie Mae HomePath property. Purchase this property for as little as 3% down! This property is approved for HomePath Renovation Mortgage Financing.
-
2010-07-31historical 210-char remark
Show marketing remark (210 chars)
Investor Special. Solid concrete block two story ''garage apartment'' First floor is 570 sq ft unfinished storage. could be 1200 sq ft 2 story with rehab or converted back to garage. Priced to sell. Short sale.
-
2010-02-03$29,900 210-char remark
Show marketing remark (210 chars)
Investor Special. Solid concrete block two story ''garage apartment'' First floor is 570 sq ft unfinished storage. could be 1200 sq ft 2 story with rehab or converted back to garage. Priced to sell. Short sale.
-
2010-02-03historical
Show marketing remark (210 chars)
Investor Special. Solid concrete block two story ''garage apartment'' First floor is 570 sq ft unfinished storage. could be 1200 sq ft 2 story with rehab or converted back to garage. Priced to sell. Short sale.
-
2010-01-14$29,900
-
2007-02-01soldstatus $45,000
-
2007-01-29historical
-
2007-01-24soldstatus $45,000
-
2006-01-04$46,500
-
1996-10-02soldstatus $28,900
-
1996-08-15soldstatus $40,000
-
1995-09-07soldstatus $25,000
ⓘ Source: listings_history table (triggers on properties + properties_extension) + one-shot
backfill from property_details.listing_events for pre-trigger history.
Tax reassessment forecast FL · Resets to sale price
- Current annual tax
- $1,004 · $84/mo
- Projected year-2 tax
- $1,004 · $84/mo
- Expected delta
- $0/yr ($0/mo · 0.0%)
ⓘ Screening estimate from a state-policy table — verify with the county assessor before closing.
Climate risk First Street
- Flood 5/10 Major FEMA zone AE · 24% chance over 30 yrs
- Wildfire 1/10 Low
- Heat 9/10 Extreme 7 d/yr ≥107°F today · 20 d/yr by 30 yrs out
- Wind 9/10 Extreme 99% chance of damaging wind over 30 yrs
- Air quality 5/10 Major 7 unhealthy d/yr today · 7 by 30 yrs out
Nearby sold comps map
Loading sold comps map…
Walkable amenities ~0.75 mi
Loading nearby amenities…
Taxation est. · year 1
- Rental income
- $12,053
- − Mortgage interest
- −$4,201
- − Property taxes
- −$1,004
- − Insurance
- −$5,494
- − Repairs & maintenance
- −$964
- − Management
- −$964
- − Depreciation
- −$2,182
- Taxable loss
- −$2,755
- Est. tax savings @ 24.0%
- +$661
- After-tax cash flow
- $-1,034/yr
For passive investors: Depreciation is non-cash, so a rental often shows a tax loss while cash-flowing — sheltering income. Rental losses are passive: they offset passive income freely, and up to $25,000/yr can offset ordinary (W-2) income if you actively participate and your MAGI is under $100k (phasing out to $0 by $150k); unused losses carry forward. On sale, claimed depreciation is recaptured at up to 25%, and gains may owe capital-gains tax (a 1031 exchange can defer both). Figures are a year-1 estimate at your 24.0% rate — not tax advice; consult a CPA.
Schools (NCES district)
- District
- Duval
- NCES district ID
- 1200480
- Math proficiency
- 46% ▼ -11.00%
- Reading proficiency
- 45% ▼ -4.00%
- Median HH income
- $48,987
- Composite
- 38.97/100
- National rank
- #4076
- State rank
- #48 of 73 in FL
Livability — Jacksonville
- Score
- 83/100
- State rank
- #50
- US rank
- #911
Category grades
Schools grade is shown separately in the Schools card above.
Census & demographics
- Census place
- Jacksonville, FL
- County
- Duval County · 1,015,274 people
- City population
- 979,034
- Metro
- Jacksonville, FL
- Population (ZIP)
- 13,927
- Household income
- $34,953
- Rent vs Own
- Severe rent burden
- 882.0
Population outlook (Duval County) Hauer SSP2
- Today (2025)
- 1,013,010 people
- By 2030
- 1,059,228 · +4.6%
- By 2040
- 1,141,439 · +12.7%
- By 2050
- 1,205,258 · +19.0%
- By 2075
- 1,324,282 · +30.7%
- By 2100
- 1,319,620 · +30.3%
Race, ethnicity, and origin ACS 2023
- Neighborhood character
- Diverse neighborhood (Simpson 0.56)
- Race & ethnicity
- Black 60% White 28% Two or more races 7% Hispanic / Latino 5%
- Hispanic origin (detail)
- Puerto Rican 1%
- Common ancestry
- Slovak 1% Hispanic 1% Lithuanian 1%
- Foreign-born
- 4% · Canada
- Languages at home
- 94% English-only · Spanish 4% French/Haitian/Cajun 2%
Political lean MEDSL · Duval
- 2024 margin
- Toss-up / Even · D 48.7% · R 50.1% · Other 1.2%
- 2008→2024 swing
- +0.4pp no change · 2008: -1.9pp · 2024: -1.5pp
- All cycles
- 2024: R+1.5 2020: D+3.8 2016: R+1.5 2012: R+3.6 2008: R+1.9
Not yet ingested
- Civics
- —
Market trends
- HPI YoY
- ▲ 3.41%
- Current HPI
- 282.2981
- Rent YoY
- ▲ 1.70%
- Metro
- Jacksonville, FL
- State GDP YoY
- ▲ 3.28%
- F500 in state
- 36
Industry mix (Fortune 500 HQ in FL)
| Industry | F500 HQs | Revenue |
|---|---|---|
| Industrial Technology | 2 | $29B |
|
||
| Insurance | 2 | $17B |
|
||
| Retail | 1 | $60B |
|
||
| Technology Distribution | 1 | $58B |
|
||
| Homebuilding | 1 | $35B |
|
||
| Technology Manufacturing | 1 | $35B |
|
||
Price history
+200.0% since first listed14 events — show timeline
- 2026-05-22 Listed $75,000 realMLS
- 2012-10-15 Sold (MLS) $13,600 realMLS
- 2012-08-07 Listed $11,000 realMLS
- 2010-07-31 Listing Removed — realMLS
- 2010-02-03 Listing Removed — realMLS
- 2010-02-03 Listed $29,900 realMLS
- 2010-01-14 Listed $29,900 realMLS
- 2007-02-01 Sold (Public Records) $45,000 Public Records
- 2007-01-29 Listing Removed — realMLS
- 2007-01-24 Sold (MLS) $45,000 realMLS
- 2006-01-04 Listed $46,500 realMLS
- 1996-10-02 Sold (Public Records) $28,900 Public Records
- 1996-08-15 Sold (Public Records) $40,000 Public Records
- 1995-09-07 Sold (Public Records) $25,000 Public Records
Property tax history
+5.3%/yrLatest (2025): $1,004 · +26.9% YoY. Source: county tax records.
Cash-flow waterfall
monthlySold comps — $/sqft
last 12 mo · ≤1 miLoading sold comps…