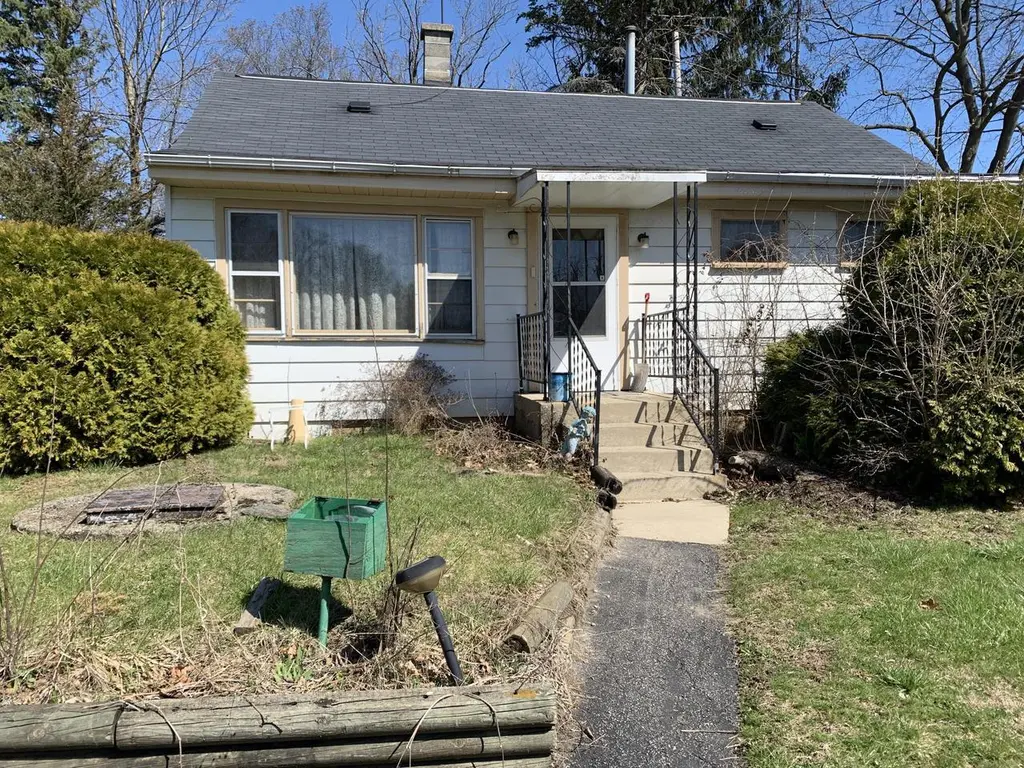
23514 124th St · Salem Lakes, WI
Flood risk 1/10 · Minimal
- FEMA flood zone
- X (unshaded)
- Chance of flooding over 30 yrs
- 0.0%
- Est. flood insurance / yr
- $507 – $1,088
Fire risk 1/10 · Minimal
- Est. fire insurance / yr
- $636 – $1,182
Heat risk 2/10 · Minimal
- Hot days now (above 100°F)
- 7 days/yr
- Hot days in 30 yrs
- 14 days/yr
Wind risk 2/10 · Minimal
- Chance of severe wind over 30 yrs
- —
Air-quality risk 2/10 · Minimal
- Unhealthy air days now
- 2 days/yr
- Unhealthy air days in 30 yrs
- 2 days/yr
Risk factors via First Street. Map © Google.
Why this score? — see what drove the C- grade
The composite is a weighted blend of 9 inputs, each scored 0–100. Each bar is that input's sub-score; the figure is the points it added to the 100-point composite (weight × sub-score).
- Cash flow +16.2/30.0
- ARV discount +15.0/15.0
- DSCR +5.0/10.0
- 1% rule +4.4/10.0
- Schools +3.2/10.0
- Rent growth +2.5/5.0
- Livability +2.5/5.0
- Condition / age +2.5/5.0
- Appreciation +0.0/10.0
$150,000
🖨 Deal sheet (PDF) 📄 Offer letter ✓ Due diligence
Listing remarks
Opportunity awaits for this 3-bed , 1.5 bath home to be brought back to life! Relax by the Cozy fireplace, Master bed, bath and Laundry on the 1st floor. 2 beds and Large half bath on upper level. A lot of storage! Needs updates and repairs. 2 Driveways. Plenty of land to build your own garage! Just 2 blocks from Cross Lake. Close to Illinois border, shopping and restaurants. Roof replaced in 2022. Boiler 2012. Beach association is optional. Property includes wooded lot behind house. Room sizes are estimated. Buyer to verify if important. Being sold ''As Is''
Key facts
- 0.31 acre lot
- Parking
- Built 1946
Property features AI
Finance
- Other: Refrigerator excluded from sale
Exterior
- Parking: One parking space
- Utilities: Municipal sewer; Well water
- Home design: Single-family, one-story home; Information source for year built: Assessor/Public Record
- Construction: Less than 1/2 acre lot (approximately 0.31 acre); Residential zoning
- Exterior features: Aluminum / Aluminum or steel exterior; Wooded lot; Garden shed; Deeded water access to a lake; Water access/rights
Interior
- Kitchen: Kitchen on main level approximately 15 x 11; Oven/Range included
- Bedrooms: Main floor primary bedroom approximately 12 x 12; Upper-level bedroom approximately 10 x 10; Upper-level bedroom approximately 11 x 11; Living room on main level approximately 15 x 17
- Bathrooms: One full bath with tub/shower over tub; One half bath
- Heating & cooling: Radiant/hot water heating; Other cooling/ventilation (see remarks)
- Interior features: Cable/Satellite available; High-speed internet; Crawl space
- Laundry & utility: Washer and dryer included
Neighborhood map
What this means for you Summary
Snapshot
- This is a 3-bed/1.5-bath single-family listed at $150k.
Deal economics
- At list price, monthly cash flow is $79 ($946/yr) — positive.
- The deal already cash-flows at list — no discount required.
- To meet the 1% rule (rent ≥ 1% of price), the offer needs to be $140k (6.4% below list).
- Recommended offer: $140k (6.4% below list) — sets the bar for 1% rule.
- Cap rate 6.9% vs local median 1.8% in Salem Lakes — top-decile yield for the area; either an underpriced asset or a hidden risk that comps aren't pricing in. Stress-test before assuming the spread holds.
Location & tenants
- Location reads: area grade C — affects rentability + tenant quality, not the cash-flow math above.
- Salem School District (suburban): math 34% / reading 37% proficiency, ranked #196 of 342 in WI (top 57%) — families likely to look elsewhere, expect single-tenant / working-renter base with shorter leases.
- Zoned schools: Salem Elementary (math 34% / reading 37%, grade F, #608 of 1,041 statewide, top 58%, 1,000 students, 33% FRL); Central High (math 36% / reading 43%, grade F, #99 of 483 statewide, top 24%, 1,219 students, 10% FRL) — zoned schools at 22% FRL track the district average.
- Market conditions: 30 active listings in the ZIP; 3 comparable units currently listed for rent nearby; rentals at typical pace (median 20d on market — plan ~3-4 weeks tenant-placement turnaround); 259 units permitted in Kenosha County in 2024 (8 in 5+ unit buildings).
Forward outlook
- Local home prices are declining (-3.0%/yr); year-one equity from $1k of loan paydown is wiped out by about $4k of value loss. Plan a longer hold.
Negotiation context
- It's been on market 52 days — a 3% lower offer ($146k) is reasonable based on typical stale-listing flexibility.
Risks & watch-outs
- Watch-outs: built in 1946 — expect roof / HVAC / electrical / plumbing capex.
Questions for the listing agent
- It's been on market 52 days. Have you received any prior offers? Is the seller open to a 6% concession, seller financing, or rate buy-down credit?
- Built in 1946 — when were the roof, HVAC, electrical panel, plumbing, and water heater last replaced?
- Is there a deadline driving the sale (1031 exchange, divorce, estate, relocation)? That informs how much negotiation room exists.
- What's the average days-on-market for RENTAL listings here right now (not sales)? A rising rental-DOM trend means longer vacancies and softer asking-rent achievability than the comps imply.
- What's the recent tenant-quality profile in this submarket — average credit score on applications, eviction rate, late-payment / NSF rate, and stable-employment percentage? A property-management company in the area should have these aggregated.
- How much new for-sale + rental construction is in the pipeline within 1–3 miles? Heavy new supply typically softens prices + rents 12–24 months out; constrained supply supports both.
Investment metrics
- 1% rule
- 0.94% ✗
- Cap rate
- 6.92%
- Cash-on-cash
- 2.25%
- DSCR
- 1.10
- GRM
- 8.9
CMA / ARV
- ARV (on-the-fly)
- $224,146
- Comps found
- 9
Show comp detail 9 sales within ~0.75 mi
| Address | Dist | Beds/Ba | Sqft | Sold | Price | $/sf | Match |
|---|---|---|---|---|---|---|---|
| 23619 124th St | 0.07mi | 3/2.0 | 1,000 (+4%) | 17mo | $285,000 | $285 | 74 |
| 23605 125th St | 0.13mi | 3/1.0 | 1,034 (+8%) | 18mo | $210,000 | $203 | 65 |
| 23433 124th Pl | 0.08mi | 2/1.0 (-1) | 1,076 (+12%) | 17mo | $187,500 | $174 | 55 |
| 23432 127th Pl | 0.29mi | 2/1.0 (-1) | 900 (-6%) | 21mo | $210,000 | $233 | 51 |
| 110 Lakewood Dr | 0.42mi | 3/1.0 | 1,091 (+13%) | 9mo | $200,000 | $183 | 48 |
| 394 Birchwood Dr | 0.72mi | 3/1.0 | 1,036 (+8%) | 5mo | $192,000 | $185 | 47 |
| 23919 126th St | 0.31mi | 2/1.0 (-1) | 1,056 (+10%) | 20mo | $250,000 | $237 | 46 |
| 269 Lakewood Dr | 0.69mi | 3/2.5 | 1,098 (+14%) | 4mo | $305,519 | $278 | 37 |
| 207 Forest Ct | 0.51mi | 3/1.0 | 1,092 (+14%) | 22mo | $265,000 | $243 | 33 |
Match score weights: distance 35% · size 25% · config 20% · recency 20%. Top-matched comps best support the ARV.
Projected returns pro-forma
-3.0% appreciation · 3.0% rent growth · sell at horizon
- IRR
- -12.7%
- Equity multiple
- 0.54×
- Total profit
- $-19,270
- Equity at exit
- $22,365
- IRR
- -3.7%
- Equity multiple
- 0.76×
- Total profit
- $-10,248
- Equity at exit
- $12,969
Cash invested: $42,000 (down + closing). Projections, not guarantees.
Landlord ↔ Tenant lean methodology
- Overall (STATE)
- 73 Landlord-Friendly
- State Wisconsin
- 73 Landlord-Friendly · R+2
- County
- — inherits STATE
- City
- — inherits STATE
ZIP-level market 53179
- Home prices YoY
- -30.6%
- Active inventory
- 30
- Price-to-rent
- 8.9×
Monthly cashflow live
- Estimated rent
- $1,404 medium interval (Pro) →
- Mortgage (P&I)
- −$787
- Tax from tax record
- −$181 /mo · $2,172/yr
- Insurance
- −$62
- HOA
- −$0
- Vacancy / Maint / Mgmt
- −$295
- Net cashflow
- $79
Break-even live
Sensitivity live
| Price | -10% $164 | -5% $121 | +0% $79 | +5% $36 | +10% $-6 |
|---|---|---|---|---|---|
| Rent | -10% $-32 | -5% $23 | +0% $79 | +5% $134 | +10% $190 |
| Rate | -1.0pp $154 | -0.5pp $117 | base $79 | +0.5pp $40 | +1.0pp $0 |
UW: 25.0% down · 7.5% · 30yr · 1.5% tax · 5.0% vac · 8.0% maint · 8.0% mgmt
Financing live
Cash to close
- Down payment
- $37,500
- Closing costs
- $4,500
- Reserves months
- —
- Total cash needed
- —
Loan-product check · same deal, 3 products live
Conventional
25% down · 7.5% · 30yr
- Down + closing
- —
- Monthly P&I
- —
- Monthly cashflow
- —
- DSCR
- —
- Eligible?
- —
Personal DTI + credit; lowest rate.
DSCR
20% down · 8.5% · 30yr
- Down + closing
- —
- Monthly P&I
- —
- Monthly cashflow
- —
- DSCR
- —
- Eligible?
- —
No personal income docs; deal must DSCR.
Hard money
10% down · 12.0% · 12mo
- Down + closing
- —
- Monthly P&I
- —
- Monthly cashflow
- —
- DSCR
- —
- Eligible?
- —
Short-term bridge; refi at stabilization.
Rent comps 3 comps
| Address | Beds | Baths | Sqft | Rent | $/sqft | DOM | Units | Dist |
|---|---|---|---|---|---|---|---|---|
| 441 Linden Ln Antioch, IL | 2.0 | 1.0 | 680 | $1,300 | $1.91 | 45d | 1 | 0.61mi |
| 556 Main St Antioch, IL | 2.0 | 1.0 | 1000 | $1,475 | $1.48 | 0d | 1 | 0.91mi |
| 565 Drom Ct Unit 2A Antioch, IL | 2.0 | 1.0 | 900 | $1,450 | $1.61 | 20d | 1 | 0.94mi |
Listing history 21 events
-
2026-06-21days on market $150,000 Active 52 DOM
-
2026-06-21days on market $150,000 Active 51 DOM
-
2026-06-18days on market $150,000 Active 49 DOM
-
2026-06-17days on market $150,000 Active 48 DOM
-
2026-06-16days on market $150,000 Active 47 DOM
-
2026-06-15days on market $150,000 Active 46 DOM
-
2026-06-15days on market $150,000 Active 45 DOM
-
2026-06-13days on market $150,000 Active 44 DOM
-
2026-06-13price $150,000 Active 43 DOM
-
2026-06-12days on market $180,000 Active 43 DOM
-
2026-06-09days on market $180,000 Active 40 DOM
-
2026-06-08days on market $180,000 Active 39 DOM
-
2026-06-07days on market $180,000 Active 38 DOM
-
2026-06-05days on market $180,000 Active 36 DOM
-
2026-06-04days on market $180,000 Active 35 DOM
-
2026-06-03days on market $180,000 Active 34 DOM
-
2026-06-02days on market $180,000 Active 33 DOM
-
2026-06-01days on market $180,000 Active 32 DOM
-
2026-05-31days on market $180,000 Active 31 DOM
-
2026-04-30$180,000 Active
-
2026-04-09historical $180,000
ⓘ Source: listings_history table (triggers on properties + properties_extension) + one-shot
backfill from property_details.listing_events for pre-trigger history.
Tax reassessment forecast WI · Partial reset (capped growth)
- Current annual tax
- $2,172 · $181/mo
- Projected year-2 tax
- $2,473 · $206/mo
- Expected delta
- +$302/yr (+$25/mo · 13.9%)
ⓘ Screening estimate from a state-policy table — verify with the county assessor before closing.
Climate risk First Street
- Flood 1/10 Low FEMA zone X (unshaded) · 0% chance over 30 yrs
- Wildfire 1/10 Low
- Heat 2/10 Low 7 d/yr ≥100°F today · 14 d/yr by 30 yrs out
- Wind 2/10 Low
- Air quality 2/10 Low 2 unhealthy d/yr today · 2 by 30 yrs out
Nearby sold comps map
Loading sold comps map…
Walkable amenities ~0.75 mi
Loading nearby amenities…
Taxation est. · year 1
- Rental income
- $16,844
- − Mortgage interest
- −$8,402
- − Property taxes
- −$2,172
- − Insurance
- −$750
- − Repairs & maintenance
- −$1,348
- − Management
- −$1,348
- − Depreciation
- −$4,364
- Taxable loss
- −$1,539
- Est. tax savings @ 24.0%
- +$369
- After-tax cash flow
- $1,315/yr
For passive investors: Depreciation is non-cash, so a rental often shows a tax loss while cash-flowing — sheltering income. Rental losses are passive: they offset passive income freely, and up to $25,000/yr can offset ordinary (W-2) income if you actively participate and your MAGI is under $100k (phasing out to $0 by $150k); unused losses carry forward. On sale, claimed depreciation is recaptured at up to 25%, and gains may owe capital-gains tax (a 1031 exchange can defer both). Figures are a year-1 estimate at your 24.0% rate — not tax advice; consult a CPA.
Schools (NCES district)
- District
- Salem School District
- NCES district ID
- 5513350
- Math proficiency
- 34% ▼ -13.00%
- Reading proficiency
- 37% ▼ -3.00%
- Median HH income
- $67,521
- Composite
- 32.43/100
- National rank
- #5725
- State rank
- #196 of 342 in WI
Livability — Salem Lakes
No livability data for this city. (Only ~50 U.S. cities are tracked.)
Census & demographics
- Census place
- Salem Lakes, WI
- City population
- 18,215
- Population (ZIP)
- 6,724
Population outlook (Kenosha County) Hauer SSP2
- Today (2025)
- 174,032 people
- By 2030
- 174,923 · +0.5%
- By 2040
- 173,895 · -0.1%
- By 2050
- 170,102 · -2.3%
- By 2075
- 162,952 · -6.4%
- By 2100
- 154,781 · -11.1%
Race, ethnicity, and origin ACS 2023
- Neighborhood character
- Predominantly White (82%)
- Race & ethnicity
- White 82% Hispanic / Latino 12% Two or more races 11% Black 1%
- Hispanic origin (detail)
- Mexican 8%
- Common ancestry
- Romanian 11% Portuguese 3% Italian 2%
- Foreign-born
- 6% · Canada
- Languages at home
- 91% English-only · Spanish 4% German/W. Germanic 2% Russian/Polish/Slavic 1%
Political lean MEDSL · Kenosha
- 2024 margin
- Lean R (+6.2) · D 46.2% · R 52.5% · Other 1.3%
- 2008→2024 swing
- -24.3pp toward R · 2008: 18.1pp · 2024: -6.2pp
- All cycles
- 2024: R+6.2 2020: R+3.1 2016: R+0.3 2012: D+12.3 2008: D+18.1
Not yet ingested
- Civics
- —
Market trends
- HPI YoY
- ▼ -127.13%
- Current HPI
- 288.6464
- Rent YoY
- —
- Metro
- —
- State GDP YoY
- ▲ 2.10%
- F500 in state
- 20
Industry mix (Fortune 500 HQ in WI)
| Industry | F500 HQs | Revenue |
|---|---|---|
| Industrial Machinery | 4 | $23B |
|
||
| Industrial Technology | 2 | $36B |
|
||
| Insurance | 1 | $36B |
|
||
| Professional Services | 1 | $19B |
|
||
| Utilities | 1 | $9B |
|
||
| Consumer Goods | 1 | $3B |
|
||
Price history
+0.0% since first listed2 events — show timeline
- 2026-04-30 Listed $180,000 METROMLS
- 2026-04-09 Coming Soon $180,000 METROMLS
Property tax history
+3.4%/yrLatest (2025): $2,172 · +7.4% YoY. Source: county tax records.
Cash-flow waterfall
monthlySold comps — $/sqft
last 12 mo · ≤1 miLoading sold comps…