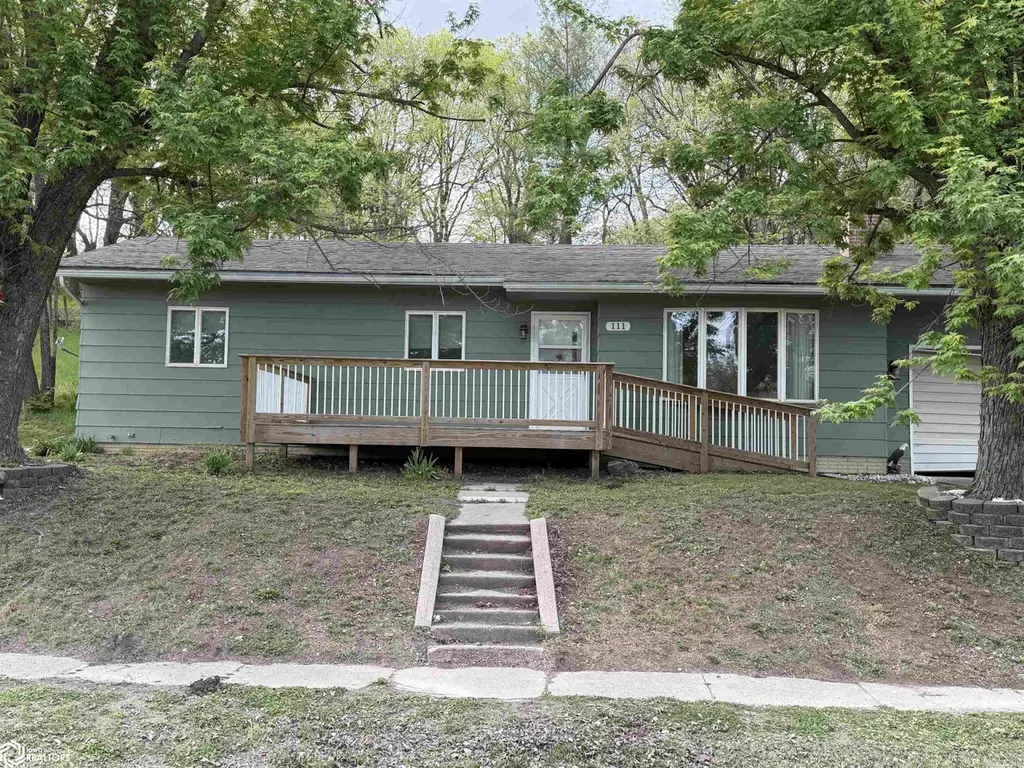
111 Kells Ave · Melrose, IA
Flood risk 3/10 · Minor
- FEMA flood zone
- X (unshaded)
- Chance of flooding over 30 yrs
- 0.2%
- Est. flood insurance / yr
- $507 – $1,088
Fire risk 4/10 · Minor
- Est. fire insurance / yr
- $902 – $1,676
Heat risk 3/10 · Minor
- Hot days now (above 104°F)
- 7 days/yr
- Hot days in 30 yrs
- 14 days/yr
Wind risk 2/10 · Minimal
- Chance of severe wind over 30 yrs
- —
Air-quality risk 2/10 · Minimal
- Unhealthy air days now
- 1 days/yr
- Unhealthy air days in 30 yrs
- 1 days/yr
Risk factors via First Street. Map © Google.
Why this score? — see what drove the C- grade
The composite is a weighted blend of 9 inputs, each scored 0–100. Each bar is that input's sub-score; the figure is the points it added to the 100-point composite (weight × sub-score).
- Cash flow +11.4/30.0
- ARV discount +10.8/15.0
- Appreciation +10.0/10.0
- Schools +6.1/10.0
- DSCR +3.3/10.0
- Livability +2.9/5.0
- Rent growth +2.5/5.0
- Condition / age +2.5/5.0
- 1% rule +2.4/10.0
$152,000
🖨 Deal sheet (PDF) 📄 Offer letter ✓ Due diligence
Listing remarks
This single level home located in Melrose is move-in ready. Three bedrooms, one bathroom, nice open layout, with everything on one level. Attached garage and nice deck overlooking the included lots across Kells Avenue provide for a nice view! Don't miss out on this affordable home in a great location!
Key facts
- Attached garage
- Nice deck
- Great location
Tags
Property features AI
Finance
- Other: Lot is approximately 0.11 acres (listed as 5 parcels totaling)
Exterior
- Parking: Attached garage (1 space) on concrete
- Utilities: Public sewer
- Home design: Single-family residence; Residential property
- Construction: HardiPlank exterior
- Exterior features: Public sewer
Interior
- Bathrooms: 1 full bathroom
- Heating & cooling: Central air conditioning; Forced air heating
- Interior features: Fireplace (1)
Neighborhood map
What this means for you Summary
Snapshot
- This is a 3-bed/1.0-bath other listed at $152k.
Deal economics
- At list price, monthly cash flow is $-54 ($-649/yr) — negative.
- To cash-flow at today's rent, offer at most $142k (6.3% below list).
- To meet the 1% rule (rent ≥ 1% of price), the offer needs to be $112k (26.3% below list).
- Recommended offer: $112k (26.3% below list) — sets the bar for 1% rule.
Location & tenants
- Location reads 57/100 on livability (#919 in IA) — a working-class tenant base; expect higher turnover. Strengths: cost of living A+, housing A-; Watch: crime C-, amenities F, commute F.
- Albia Community School District (town): math 68% / reading 77% proficiency, ranked #117 of 289 in IA (top 40%) — strong family-tenant draw, lease renewals of 3-5y typical.
- Zoned schools: Lincoln Center (math 66% / reading 69%, grade B+, #270 of 616 statewide, top 44%, 293 students, 42% FRL); Albia Middle School (math 72% / reading 82%, grade A, #52 of 246 statewide, top 22%, 164 students, 40% FRL); Albia High School (math 68% / reading 83%, grade A-, #79 of 336 statewide, top 25%, 374 students, 38% FRL).
- Market conditions: 26 active listings in the ZIP; 13 units permitted in Monroe County in 2024 (0 in 5+ unit buildings).
Forward outlook
- In year one you build about $16k of equity ($1k loan paydown + $15k appreciation (10.0% local appreciation)).
- At projected returns (10.0% appreciation + 3.0% rent growth), your $43k cash investment doubles in ~3 years — after that, you're playing with house money.
- By year 3, paydown + projected appreciation supports a ~$41k cash-out refi (75% LTV) — recoverable capital for the next deal without selling this one.
Negotiation context
- It's been on market 30 days — a 2% lower offer ($150k) is reasonable based on typical stale-listing flexibility.
- Current owner paid $65k; list at $152k implies a 134% gain — meaningful room to come down on a strong offer.
Questions for the listing agent
- What do current leases actually rent for vs. the listed asking? Can we see a recent rent roll and the last 12 months of T-12 income?
- Built in 1979 — when were the roof, HVAC, electrical panel, plumbing, and water heater last replaced?
- Is there a deadline driving the sale (1031 exchange, divorce, estate, relocation)? That informs how much negotiation room exists.
- Schools are F-rated, which usually means shorter tenancies and higher turnover. Who's the typical renter profile here, and what's been the actual vacancy rate?
- What's the average days-on-market for RENTAL listings here right now (not sales)? A rising rental-DOM trend means longer vacancies and softer asking-rent achievability than the comps imply.
- What's the recent tenant-quality profile in this submarket — average credit score on applications, eviction rate, late-payment / NSF rate, and stable-employment percentage? A property-management company in the area should have these aggregated.
- How much new for-sale + rental construction is in the pipeline within 1–3 miles? Heavy new supply typically softens prices + rents 12–24 months out; constrained supply supports both.
Investment metrics
- 1% rule
- 0.74% ✗
- Cap rate
- 5.87%
- Cash-on-cash
- -1.52%
- DSCR
- 0.93
- GRM
- 11.3
CMA / ARV
- ARV (median comp)
- $164,195
- List price
- $152,000
- Delta
- -7.43%
- Verdict
- FAIR
- Comps
- 2 within 2.0 mi
Projected returns pro-forma
10.0% appreciation · 3.0% rent growth · sell at horizon
- IRR
- 23.2%
- Equity multiple
- 2.86×
- Total profit
- $79,290
- Equity at exit
- $136,934
- IRR
- 20.7%
- Equity multiple
- 6.55×
- Total profit
- $236,099
- Equity at exit
- $295,303
Cash invested: $42,560 (down + closing). Projections, not guarantees.
Landlord ↔ Tenant lean methodology
- Overall (STATE)
- 83 Strongly Landlord-Friendly
- State Iowa
- 83 Strongly Landlord-Friendly · R+6
- County
- — inherits STATE
- City
- — inherits STATE
ZIP-level market 52569
- Home prices YoY
- 5.3%
- Active inventory
- 26
- Price-to-rent
- 11.3×
Monthly cashflow live
- Estimated rent
- $1,120 medium interval (Pro) →
- Mortgage (P&I)
- −$797
- Tax from tax record
- −$79 /mo · $944/yr
- Insurance
- −$63
- HOA
- −$0
- Vacancy / Maint / Mgmt
- −$235
- Net cashflow
- $-54
Break-even live
Sensitivity live
| Price | -10% $32 | -5% $-11 | +0% $-54 | +5% $-97 | +10% $-140 |
|---|---|---|---|---|---|
| Rent | -10% $-143 | -5% $-98 | +0% $-54 | +5% $-10 | +10% $34 |
| Rate | -1.0pp $23 | -0.5pp $-15 | base $-54 | +0.5pp $-93 | +1.0pp $-134 |
UW: 25.0% down · 7.5% · 30yr · 1.5% tax · 5.0% vac · 8.0% maint · 8.0% mgmt
Financing live
Cash to close
- Down payment
- $38,000
- Closing costs
- $4,560
- Reserves months
- —
- Total cash needed
- —
Loan-product check · same deal, 3 products live
Conventional
25% down · 7.5% · 30yr
- Down + closing
- —
- Monthly P&I
- —
- Monthly cashflow
- —
- DSCR
- —
- Eligible?
- —
Personal DTI + credit; lowest rate.
DSCR
20% down · 8.5% · 30yr
- Down + closing
- —
- Monthly P&I
- —
- Monthly cashflow
- —
- DSCR
- —
- Eligible?
- —
No personal income docs; deal must DSCR.
Hard money
10% down · 12.0% · 12mo
- Down + closing
- —
- Monthly P&I
- —
- Monthly cashflow
- —
- DSCR
- —
- Eligible?
- —
Short-term bridge; refi at stabilization.
Listing history 9 events
-
2026-06-05statusdays on market $152,000 Pending 30 DOM
-
2026-06-04days on market $152,000 Active 29 DOM
-
2026-06-02days on market $152,000 Active 28 DOM
-
2026-06-01days on market $152,000 Active 27 DOM
-
2026-05-31days on market $152,000 Active 26 DOM
-
2026-05-31days on market $152,000 Active 25 DOM
-
2026-05-04$152,000 Active 303-char remark
-
2023-10-04soldstatus $65,000
-
2023-10-04soldstatus $65,000
ⓘ Source: listings_history table (triggers on properties + properties_extension) + one-shot
backfill from property_details.listing_events for pre-trigger history.
Tax reassessment forecast IA · Partial reset (capped growth)
- Current annual tax
- $944 · $79/mo
- Projected year-2 tax
- $1,665 · $139/mo
- Expected delta
- +$721/yr (+$60/mo · 76.4%)
ⓘ Screening estimate from a state-policy table — verify with the county assessor before closing.
Climate risk First Street
- Flood 3/10 Moderate FEMA zone X (unshaded) · 20% chance over 30 yrs
- Wildfire 4/10 Moderate
- Heat 3/10 Moderate 7 d/yr ≥104°F today · 14 d/yr by 30 yrs out
- Wind 2/10 Low
- Air quality 2/10 Low 1 unhealthy d/yr today · 1 by 30 yrs out
Nearby sold comps map
Loading sold comps map…
Walkable amenities ~0.75 mi
Loading nearby amenities…
Taxation est. · year 1
- Rental income
- $13,444
- − Mortgage interest
- −$8,514
- − Property taxes
- −$944
- − Insurance
- −$760
- − Repairs & maintenance
- −$1,076
- − Management
- −$1,076
- − Depreciation
- −$4,422
- Taxable loss
- −$3,347
- Est. tax savings @ 24.0%
- +$803
- After-tax cash flow
- $155/yr
For passive investors: Depreciation is non-cash, so a rental often shows a tax loss while cash-flowing — sheltering income. Rental losses are passive: they offset passive income freely, and up to $25,000/yr can offset ordinary (W-2) income if you actively participate and your MAGI is under $100k (phasing out to $0 by $150k); unused losses carry forward. On sale, claimed depreciation is recaptured at up to 25%, and gains may owe capital-gains tax (a 1031 exchange can defer both). Figures are a year-1 estimate at your 24.0% rate — not tax advice; consult a CPA.
Schools (NCES district)
- District
- Albia Community School District
- NCES district ID
- 1903270
- Math proficiency
- 68% ▼ -9.00%
- Reading proficiency
- 77% ▬ 0.00%
- Median HH income
- $44,429
- Composite
- 60.88/100
- National rank
- #814
- State rank
- #117 of 289 in IA
Livability — Melrose
- Score
- 57/100
- State rank
- #919
- US rank
- #22357
Category grades
Schools grade is shown separately in the Schools card above.
Census & demographics
- Census place
- Melrose, IA
- City population
- 541
- Population (ZIP)
- 541
Population outlook (Monroe County) Hauer SSP2
- Today (2025)
- 7,921 people
- By 2030
- 7,918 · +-0.0%
- By 2040
- 7,873 · -0.6%
- By 2050
- 7,776 · -1.8%
- By 2075
- 7,556 · -4.6%
- By 2100
- 7,055 · -10.9%
Race, ethnicity, and origin ACS 2023
- Neighborhood character
- Predominantly White (90%)
- Race & ethnicity
- White 90% Two or more races 10%
- Common ancestry
- Slovak 3% Romanian 3% Iranian 2%
- Foreign-born
- 0%
Political lean MEDSL · Monroe
- 2024 margin
- Solid R (+50.7) · D 24.2% · R 74.9%
- 2008→2024 swing
- -45.5pp toward R · 2008: -5.2pp · 2024: -50.7pp
- All cycles
- 2024: R+50.7 2020: R+46.4 2016: R+41.2 2012: R+7.7 2008: R+5.2
Not yet ingested
- Civics
- —
Market trends
- HPI YoY
- ▲ 10.12%
- Current HPI
- 199.977
- Rent YoY
- —
- Metro
- —
- State GDP YoY
- ▲ 2.48%
- F500 in state
- 4
Industry mix (Fortune 500 HQ in IA)
| Industry | F500 HQs | Revenue |
|---|---|---|
| Financial Services | 1 | $16B |
|
||
| Retail / Convenience | 1 | $15B |
|
||
Price history
+133.8% since first listed4 events — show timeline
- 2026-06-04 Pending — IAR
- 2026-05-04 Listed $152,000 IAR
- 2023-10-04 Sold (Public Records) $65,000 Public Records
- 2023-10-04 Sold (Public Records) $65,000 Public Records
Property tax history
+0.4%/yrLatest (2025): $944 · -5.6% YoY. Source: county tax records.
Cash-flow waterfall
monthlySold comps — $/sqft
last 12 mo · ≤1 miLoading sold comps…