 Multi-family
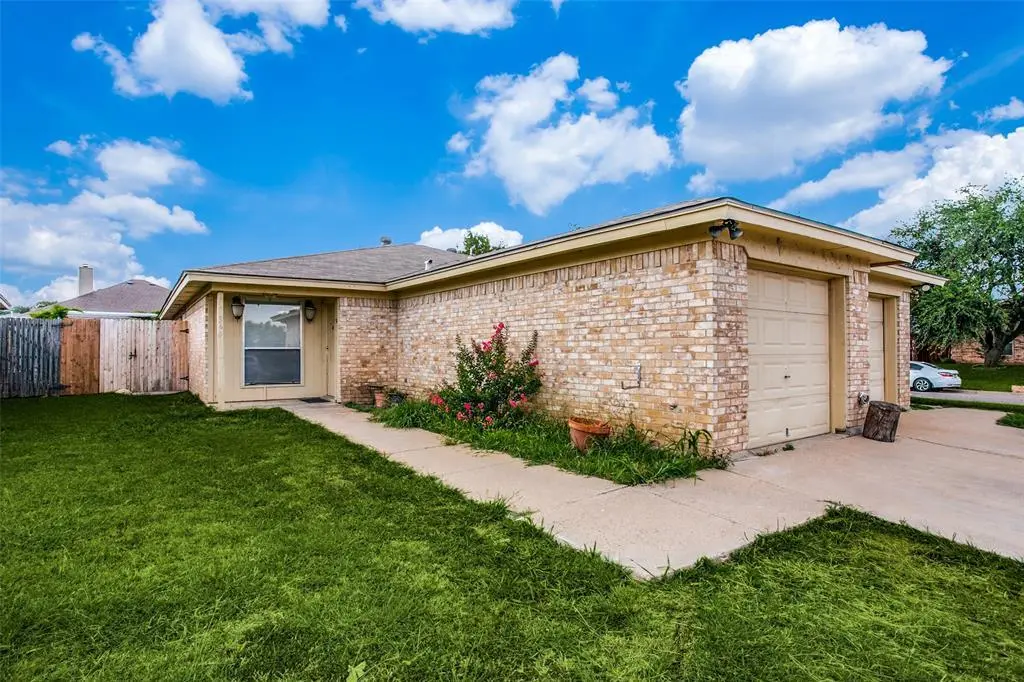
3600 Hulen Park Cir · Fort Worth, TX
Flood risk 1/10 · Minimal
- FEMA flood zone
- X (unshaded)
- Chance of flooding over 30 yrs
- 0.0%
- Est. flood insurance / yr
- $507 – $1,088
Fire risk 4/10 · Minor
- Est. fire insurance / yr
- $1,222 – $2,270
Heat risk 7/10 · Major
- Hot days now (above 108°F)
- 7 days/yr
- Hot days in 30 yrs
- 24 days/yr
Wind risk 4/10 · Minor
- Chance of severe wind over 30 yrs
- 22.0%
Air-quality risk 3/10 · Minor
- Unhealthy air days now
- 2 days/yr
- Unhealthy air days in 30 yrs
- 3 days/yr
Risk factors via First Street. Map © Google.
Why this score? — see what drove the C grade
The composite is a weighted blend of 9 inputs, each scored 0–100. Each bar is that input's sub-score; the figure is the points it added to the 100-point composite (weight × sub-score).
- Cash flow +24.8/30.0
- DSCR +8.0/10.0
- ARV discount +7.5/15.0
- 1% rule +5.6/10.0
- Livability +4.0/5.0
- Rent growth +2.8/5.0
- Schools +2.5/10.0
- Condition / age +2.5/5.0
- Appreciation +0.0/10.0
$899,000
🖨 Deal sheet (PDF) 📄 Offer letter ✓ Due diligence
Multi-family units
County records classify this as Multi-Family (2-4 Unit). Listing-text estimate: 1 unit. estimate disagrees with records
Listing remarks MLS
RARE 6-DOOR INVESTMENT PORTFOLIO! This unique package includes three well-maintained duplexes (6 total units) located on the same block in Fort Worth: 3600, 3602, 3616, 3618, and 3624, 3626 Hulen Park Circle. Priced at $960,000, this offering boasts a strong cap rate based on 2025 actual performance. The portfolio is 100% occupied with a total monthly gross rent of $8,745 ($104,940 per year) as of March 2026. Each unit features a spacious 1,005 sq. ft. layout with 2 bedrooms, 1 bathroom, a 1-car garage, and a private fenced backyard. Several units have been recently renovated with updated flooring and modern kitchens. The prime location near Hulen Mall ensures high tenant demand and easy access to shopping and dining. These properties are currently professionally managed by Ellis HomeSource, providing the option for a seamless management transition for the new owner. This is a true turn-key, immediate cash-flow opportunity. Sold as a single 3-duplex package only.
Key facts
- 8,364 sq ft lot
- Garage
- Built 1985
Neighborhood map
What this means for you Summary
Snapshot
- This is a 4-bed/2.0-bath multifamily listed at $899k.
Deal economics
- At list price, monthly cash flow is $2k ($23k/yr) — positive.
- The deal already cash-flows at list — no discount required.
- Meets the 1% rule at list price ($9k rent vs $899k).
- Recommended offer: $845k (6.0% below list) — sets the bar for market timing.
- Cap rate 8.8% vs local median 3.9% in Fort Worth — top-decile yield for the area; either an underpriced asset or a hidden risk that comps aren't pricing in. Stress-test before assuming the spread holds.
Location & tenants
- Location reads 80/100 on livability (#49 in TX, #1,954 nationally) — a professional / high-income tenant draw. Strengths: amenities A+, cost of living A+, housing A+; Watch: crime F.
- Crowley ISD (urban): math 23% / reading 32% proficiency, ranked #643 of 826 in TX (top 78%) — low school quality limits family demand, transient renter base, plan for 1-2y turnover.
- Zoned schools: Jackie Carden El (math 24% / reading 34%, grade F, #2,668 of 4,322 statewide, top 63%, 533 students, 84% FRL); Crowley Middle (math 17% / reading 28%, grade F, #1,341 of 1,662 statewide, top 82%, 977 students, 86% FRL); North Crowley H S (math 20% / reading 35%, grade F, #1,183 of 1,632 statewide, top 73%, 2,920 students, 71% FRL) — zoned schools average 80% FRL vs 52% district-wide (28 pts higher); higher-poverty schools than district average — tighter screening recommended.
- Market conditions: Rents rising (+1.1%/yr); 367 active listings in the ZIP; 40 comparable units currently listed for rent nearby; rentals at typical pace (median 26d on market — plan ~3-4 weeks tenant-placement turnaround); solid renter incomes; 18,938 units permitted in Tarrant County in 2024 (8,336 in 5+ unit buildings).
- At $9,494/mo this rent would consume 111% of the median local household income ($103k/yr) (locally 975% of renters already pay >50% of income on rent) — very limited rent-growth headroom before tenants either downsize or default.
Forward outlook
- Local home prices are declining (-3.0%/yr); year-one equity from $6k of loan paydown is wiped out by about $27k of value loss. Plan a longer hold.
- Tarrant County population projected at +41% by 2050 — long-run rental-demand tailwind backs the buy-and-hold thesis.
Negotiation context
- It's been on market 83 days — a 6% lower offer ($845k) is reasonable based on typical stale-listing flexibility.
- 4 sale attempts since 2y ago; this cycle's ask has dropped $61k (6%) from the opening price — seller is motivated, your offer sets the floor, not the list.
Risks & watch-outs
- Climate carrying-cost: extreme-heat days projected 7→24/yr by 2055 (HVAC capex compounding) — expect insurance premiums to compound above CPI over the hold.
Questions for the listing agent
- It's been on market 83 days. Have you received any prior offers? Is the seller open to a 6% concession, seller financing, or rate buy-down credit?
- Why hasn't it sold? Are there any deal-killer items the seller is aware of (foundation, flood, title, zoning, code violations)?
- Is there a deadline driving the sale (1031 exchange, divorce, estate, relocation)? That informs how much negotiation room exists.
- Schools are D-rated, which usually means shorter tenancies and higher turnover. Who's the typical renter profile here, and what's been the actual vacancy rate?
- Crime grade is F in this area — have there been break-ins, vandalism, or insurance claims at this property in the last 3 years? What carrier currently insures it and at what premium?
- What's the average days-on-market for RENTAL listings here right now (not sales)? A rising rental-DOM trend means longer vacancies and softer asking-rent achievability than the comps imply.
- What's the recent tenant-quality profile in this submarket — average credit score on applications, eviction rate, late-payment / NSF rate, and stable-employment percentage? A property-management company in the area should have these aggregated.
- How much new apartment / multifamily construction is in the pipeline within 1–3 miles? Heavy new supply (>2% of stock underway) typically softens rents 12–24 months out; light construction supports rent growth.
Investment metrics
- 1% rule
- 1.06% ✓
- Cap rate
- 8.82%
- Cash-on-cash
- 9.01%
- DSCR
- 1.40
- GRM
- 7.9
CMA / ARV
- ARV (median comp)
- $559,720
- List price
- $899,000
- Delta
- 60.62%
- Verdict
- OVERPRICED
- Comps
- 1 within 2.0 mi
Projected returns pro-forma
-3.0% appreciation · 1.07% rent growth · sell at horizon
- IRR
- -4.7%
- Equity multiple
- 0.83×
- Total profit
- $-43,558
- Equity at exit
- $134,044
- IRR
- 2.7%
- Equity multiple
- 1.18×
- Total profit
- $44,821
- Equity at exit
- $77,729
Cash invested: $251,720 (down + closing). Projections, not guarantees.
Landlord ↔ Tenant lean methodology
- Overall (STATE)
- 87 Strongly Landlord-Friendly
- State Texas
- 87 Strongly Landlord-Friendly · R+5
- County
- — inherits STATE
- City
- — inherits STATE
ZIP-level market 76123
- Home prices YoY
- -17.9%
- Rents YoY
- 1.1%
- Active inventory
- 367
- Price-to-rent
- 47.3×
Monthly cashflow live
- Estimated rent
- $9,494 medium interval (Pro) →
- Mortgage (P&I)
- −$4,714
- Tax from tax record
- −$520 /mo · $6,243/yr
- Insurance
- −$375
- HOA
- −$0
- Vacancy / Maint / Mgmt
- −$1,994
- Net cashflow
- $1,891
Break-even live
Sensitivity live
| Price | -10% $2,400 | -5% $2,145 | +0% $1,891 | +5% $1,637 | +10% $1,382 |
|---|---|---|---|---|---|
| Rent | -10% $1,141 | -5% $1,516 | +0% $1,891 | +5% $2,266 | +10% $2,641 |
| Rate | -1.0pp $2,344 | -0.5pp $2,120 | base $1,891 | +0.5pp $1,658 | +1.0pp $1,421 |
6-unit breakdown (identical units grouped — click to expand)
| Units | Beds | Baths | Est. rent |
|---|---|---|---|
| 6× units | 2 | 1 | $9,492 |
| #1 | 2 | 1 | $1,582 |
| #2 | 2 | 1 | $1,582 |
| #3 | 2 | 1 | $1,582 |
| #4 | 2 | 1 | $1,582 |
| #5 | 2 | 1 | $1,582 |
| #6 | 2 | 1 | $1,582 |
| Total (6 units) | $9,494 | ||
UW: 25.0% down · 7.5% · 30yr · 1.5% tax · 5.0% vac · 8.0% maint · 8.0% mgmt
Financing live
Cash to close
- Down payment
- $224,750
- Closing costs
- $26,970
- Reserves months
- —
- Total cash needed
- —
Loan-product check · same deal, 3 products live
Conventional
25% down · 7.5% · 30yr
- Down + closing
- —
- Monthly P&I
- —
- Monthly cashflow
- —
- DSCR
- —
- Eligible?
- —
Personal DTI + credit; lowest rate.
DSCR
20% down · 8.5% · 30yr
- Down + closing
- —
- Monthly P&I
- —
- Monthly cashflow
- —
- DSCR
- —
- Eligible?
- —
No personal income docs; deal must DSCR.
Hard money
10% down · 12.0% · 12mo
- Down + closing
- —
- Monthly P&I
- —
- Monthly cashflow
- —
- DSCR
- —
- Eligible?
- —
Short-term bridge; refi at stabilization.
Rent comps 40 comps
| Address | Beds | Baths | Sqft | Rent | $/sqft | DOM | Units | Dist |
|---|---|---|---|---|---|---|---|---|
| 3704 Fairhaven Dr Fort Worth, TX | 3.0 | 2.0 | 1528 | $1,995 | $1.31 | 45d | 1 | 0.12mi |
| 3704 Fairhaven Dr Fort Worth, TX | 3.0 | 2.0 | 1528 | $1,995 | $1.31 | 14d | 1 | 0.12mi |
| 3288 Raleigh Dr Fort Worth, TX | 5.0 | 2.5 | 2443 | $2,395 | $0.98 | 21d | 1 | 0.29mi |
| 3816 Ashley Ln Fort Worth, TX | 3.0 | 2.0 | 1464 | $2,060 | $1.41 | 4d | 1 | 0.30mi |
| 3309 Creekwood Ln Fort Worth, TX | 4.0 | 2.0 | 1748 | $2,055 | $1.18 | 0d | 1 | 0.31mi |
| 8217 Miami Springs Dr Fort Worth, TX | 3.0 | 2.0 | 1996 | $1,950 | $0.98 | 26d | 1 | 0.35mi |
| 8300 Auburn Dr Fort Worth, TX | 3.0 | 2.5 | 1857 | $1,850 | $1.00 | 0d | 1 | 0.36mi |
| 3416 Forest Creek Dr Fort Worth, TX | 3.0 | 2.0 | 1400 | $1,895 | $1.35 | 26d | 1 | 0.39mi |
| 3809 Bee Tree Ln Fort Worth, TX | 3.0 | 2.0 | 1458 | $1,810 | $1.24 | 0d | 1 | 0.40mi |
| 8328 Ohara Ln Fort Worth, TX | 3.0 | 2.5 | 1826 | $2,145 | $1.17 | 45d | 1 | 0.44mi |
| 3308 Clovermeadow Dr Fort Worth, TX | 3.0 | 2.0 | 1798 | $1,900 | $1.06 | 26d | 1 | 0.46mi |
| 8345 Ohara Ln Fort Worth, TX | 4.0 | 2.0 | 1793 | $1,906 | $1.06 | 45d | 1 | 0.49mi |
| 3704 Garden Springs Dr Fort Worth, TX | 3.0 | 2.0 | 1628 | $2,799 | $1.72 | 14d | 1 | 0.50mi |
| 8309 Orleans Ln Fort Worth, TX | 4.0 | 2.0 | 2506 | $2,305 | $0.92 | 45d | 1 | 0.53mi |
| 4013 Winter Springs Dr Fort Worth, TX | 4.0 | 2.0 | 1764 | $3,000 | $1.70 | 45d | 1 | 0.54mi |
| 8420 Cloverglen Ln Fort Worth, TX | 3.0 | 2.0 | 1445 | $1,980 | $1.37 | 0d | 1 | 0.56mi |
| 2729 Forest Creek Dr Fort Worth, TX | 3.0 | 2.5 | 2333 | $2,350 | $1.01 | 4d | 1 | 0.59mi |
| 3104 Woodlark Dr Fort Worth, TX | 4.0 | 2.5 | 2565 | $2,350 | $0.92 | 45d | 1 | 0.60mi |
| 7609 Xavier Dr Fort Worth, TX | 4.0 | 2.5 | 2239 | $2,060 | $0.92 | 23d | 1 | 0.60mi |
| 8508 Ohara Ln Fort Worth, TX | 3.0 | 2.0 | 2272 | $1,841 | $0.81 | 45d | 1 | 0.61mi |
| 8516 Auburn Dr Fort Worth, TX | 4.0 | 2.5 | 2279 | $2,095 | $0.92 | 22d | 1 | 0.62mi |
| 2616 Harvest Moon Dr Fort Worth, TX | 3.0 | 2.0 | 1436 | $2,350 | $1.64 | 3d | 1 | 0.63mi |
| 8525 Auburn Dr Fort Worth, TX | 3.0 | 2.5 | 1463 | $3,229 | $2.21 | 0d | 1 | 0.65mi |
| 2917 Joymeadow Dr Fort Worth, TX | 4.0 | 2.5 | 2253 | $2,210 | $0.98 | 22d | 1 | 0.65mi |
| 8317 Camellia Tree Ct Fort Worth, TX | 4.0 | 3.0 | 1947 | $2,340 | $1.20 | 45d | 1 | 0.65mi |
| 3905 Seven Gables St Fort Worth, TX | 3.0 | 2.0 | 1864 | $1,700 | $0.91 | 45d | 1 | 0.66mi |
| 2905 Joymeadow Dr Fort Worth, TX | 4.0 | 2.5 | 2272 | $2,200 | $0.97 | 7d | 1 | 0.67mi |
| 8308 Yaupon Holly Trl Fort Worth, TX | 4.0 | 2.5 | 1947 | $2,340 | $1.20 | 45d | 1 | 0.67mi |
| 3001 Vicksburg Ln Fort Worth, TX | 4.0 | 2.5 | 2393 | $2,650 | $1.11 | 12d | 1 | 0.68mi |
| 2701 Clovermeadow Dr Fort Worth, TX | 4.0 | 2.5 | 2225 | $2,500 | $1.12 | 4d | 1 | 0.68mi |
| 2701 Clovermeadow Dr Fort Worth, TX | 4.0 | 2.5 | 2225 | $2,500 | $1.12 | 0d | 1 | 0.68mi |
| 2913 Vicksburg Ln Fort Worth, TX | 3.0 | 2.0 | 1720 | $1,800 | $1.05 | 26d | 1 | 0.71mi |
| 8336 Yaupon Holly Trl Fort Worth, TX | 4.0 | 2.5 | 1751 | $2,180 | $1.25 | 26d | 1 | 0.71mi |
| 3990 Sarasota Springs Dr Fort Worth, TX | 3.0 | 2.5 | 1766 | $1,995 | $1.13 | 26d | 1 | 0.71mi |
| 8564 Charleston Ave Fort Worth, TX | 3.0 | 2.5 | 1463 | $1,875 | $1.28 | 26d | 1 | 0.74mi |
| 7329 Southridge Trl Fort Worth, TX | 3.0 | 2.0 | 1529 | $2,200 | $1.44 | 45d | 1 | 0.76mi |
| 7208 Southridge Trl Fort Worth, TX | 3.0 | 2.0 | 1506 | $1,950 | $1.29 | 3d | 1 | 0.76mi |
| 7208 Southridge Trl Fort Worth, TX | 3.0 | 2.0 | 1506 | $1,950 | $1.29 | 0d | 1 | 0.76mi |
| 7801 Summerglen Rd Fort Worth, TX | 3.0 | 1.0 | 1715 | $2,045 | $1.19 | 45d | 1 | 0.79mi |
| 2808 Adams Fall Ln Fort Worth, TX | 3.0 | 2.0 | 1545 | $2,100 | $1.36 | 45d | 1 | 0.80mi |
Listing history 26 events
-
2026-06-21days on market $899,000 Active 83 DOM
-
2026-06-18days on market $899,000 Active 80 DOM
-
2026-06-17days on market $899,000 Active 79 DOM
-
2026-06-16days on market $899,000 Active 78 DOM
-
2026-06-15days on market $899,000 Active 77 DOM
-
2026-06-13days on market $899,000 Active 75 DOM
-
2026-06-13pricedays on market $899,000 Active 74 DOM
-
2026-06-09days on market $960,000 Active 71 DOM
-
2026-06-08days on market $960,000 Active 70 DOM
-
2026-06-07days on market $960,000 Active 69 DOM
-
2026-06-04statusdays on market $960,000 Active 66 DOM
-
2026-06-03days on market $960,000 Active Option Contract 65 DOM
-
2026-06-02days on market $960,000 Active Option Contract 64 DOM
-
2026-06-01days on market $960,000 Active Option Contract 63 DOM
-
2026-05-31days on market $960,000 Active Option Contract 62 DOM
-
2026-03-30$960,000 Active 983-char remark
Show marketing remark (983 chars)
RARE 6-DOOR INVESTMENT PORTFOLIO! This unique package includes three well-maintained duplexes (6 total units) located on the same block in Fort Worth: 3600, 3602, 3616, 3618, and 3624, 3626 Hulen Park Circle. Priced at $960,000, this offering boasts a strong cap rate based on 2025 actual performance. The portfolio is 100% occupied with a total monthly gross rent of $8,745 ($104,940 per year) as of March 2026. Each unit features a spacious 1,005 sq. ft. layout with 2 bedrooms, 1 bathroom, a 1-car garage, and a private fenced backyard. Several units have been recently renovated with updated flooring and modern kitchens. The prime location near Hulen Mall ensures high tenant demand and easy access to shopping and dining. These properties are currently professionally managed by Ellis HomeSource, providing the option for a seamless management transition for the new owner. This is a true turn-key, immediate cash-flow opportunity. Sold as a single 3-duplex package only.
-
2025-12-30historical
-
2025-10-09$345,000 Active
-
2024-05-06historical $1,499
-
2024-05-03price $1,499
-
2024-04-24$1,549
-
2024-04-24historical $1,549
-
2024-04-23$1,549
-
2016-03-08soldstatus
-
1990-10-23soldstatus
-
1989-04-04soldstatus
ⓘ Source: listings_history table (triggers on properties + properties_extension) + one-shot
backfill from property_details.listing_events for pre-trigger history.
Tax reassessment forecast TX · Resets to sale price
- Current annual tax
- $6,243 · $520/mo
- Projected year-2 tax
- $16,452 · $1,371/mo
- Expected delta
- +$10,208/yr (+$851/mo · 163.5%)
ⓘ Screening estimate from a state-policy table — verify with the county assessor before closing.
Climate risk First Street
- Flood 1/10 Low FEMA zone X (unshaded) · 0% chance over 30 yrs
- Wildfire 4/10 Moderate
- Heat 7/10 Severe 7 d/yr ≥108°F today · 24 d/yr by 30 yrs out
- Wind 4/10 Moderate 22% chance of damaging wind over 30 yrs
- Air quality 3/10 Moderate 2 unhealthy d/yr today · 3 by 30 yrs out
Nearby sold comps map
Loading sold comps map…
Walkable amenities ~0.75 mi
Loading nearby amenities…
Taxation est. · year 1
- Rental income
- $113,928
- − Mortgage interest
- −$50,358
- − Property taxes
- −$6,243
- − Insurance
- −$4,495
- − Repairs & maintenance
- −$9,114
- − Management
- −$9,114
- − Depreciation
- −$26,153
- Taxable income
- $8,451
- Est. tax owed @ 24.0%
- −$2,028
- After-tax cash flow
- $20,663/yr
For passive investors: Depreciation is non-cash, so a rental often shows a tax loss while cash-flowing — sheltering income. Rental losses are passive: they offset passive income freely, and up to $25,000/yr can offset ordinary (W-2) income if you actively participate and your MAGI is under $100k (phasing out to $0 by $150k); unused losses carry forward. On sale, claimed depreciation is recaptured at up to 25%, and gains may owe capital-gains tax (a 1031 exchange can defer both). Figures are a year-1 estimate at your 24.0% rate — not tax advice; consult a CPA.
Schools (NCES district)
- District
- Crowley ISD
- NCES district ID
- 4815910
- Math proficiency
- 23% ▼ -15.00%
- Reading proficiency
- 32% ▼ -6.00%
- Median HH income
- $59,810
- Composite
- 25.04/100
- National rank
- #7549
- State rank
- #643 of 826 in TX
Livability — Fort Worth
- Score
- 80/100
- State rank
- #49
- US rank
- #1954
Category grades
Schools grade is shown separately in the Schools card above.
Census & demographics
- Census place
- Fort Worth, TX
- County
- Tarrant County · 2,033,669 people
- City population
- 911,619
- Metro
- Dallas-Fort Worth-Arlington, TX
- Population (ZIP)
- 42,957
- Household income
- $102,768
- Rent vs Own
- Severe rent burden
- 975.0
Population outlook (Tarrant County) Hauer SSP2
- Today (2025)
- 2,380,417 people
- By 2030
- 2,578,900 · +8.3%
- By 2040
- 2,974,995 · +25.0%
- By 2050
- 3,350,489 · +40.8%
- By 2075
- 4,216,909 · +77.2%
- By 2100
- 4,741,527 · +99.2%
Race, ethnicity, and origin ACS 2023
- Neighborhood character
- Highly diverse neighborhood (Simpson 0.73)
- Race & ethnicity
- Black 37% Hispanic / Latino 26% White 24% Two or more races 15% Asian 8%
- Hispanic origin (detail)
- Mexican 22%
- Common ancestry
- Italian 1% Romanian 1% Slovak 1%
- Foreign-born
- 17% · Canada, Vietnam, Jamaica
- Languages at home
- 75% English-only · Spanish 16% Other Indo-European 3% Vietnamese 2%
Political lean MEDSL · Tarrant
- 2024 margin
- Lean R (+5.1) · D 46.7% · R 51.9% · Other 1.4%
- 2008→2024 swing
- +6.6pp toward D · 2008: -11.7pp · 2024: -5.1pp
- All cycles
- 2024: R+5.1 2020: D+0.2 2016: R+8.7 2012: R+15.7 2008: R+11.7
Not yet ingested
- Civics
- —
Market trends
- HPI YoY
- ▼ -50.54%
- Current HPI
- 231.1377
- Rent YoY
- ▲ 1.07%
- Metro
- Dallas-Fort Worth-Arlington, TX
- State GDP YoY
- ▲ 3.95%
- F500 in state
- 110
Industry mix (Fortune 500 HQ in TX)
| Industry | F500 HQs | Revenue |
|---|---|---|
| Energy | 16 | $1,198B |
|
||
| Technology | 5 | $198B |
|
||
| Engineering / Construction | 4 | $72B |
|
||
| Energy Services | 3 | $60B |
|
||
| Utilities | 3 | $41B |
|
||
| Healthcare | 2 | $330B |
|
||
Price history
+61875.5% since first listed11 events — show timeline
- 2026-03-30 Listed $960,000 NTREIS
- 2025-12-30 Listing Removed — NTREIS
- 2025-10-09 Listed $345,000 NTREIS
- 2024-05-06 Rental Removed $1,499 NTREIS
- 2024-05-03 Price Changed $1,499 NTREIS
- 2024-04-24 Listed for Rent $1,549 NTREIS
- 2024-04-24 Rental Removed $1,549 APPFOLIO
- 2024-04-23 Listed for Rent $1,549 APPFOLIO
- 2016-03-08 Sold (Public Records) — Public Records
- 1990-10-23 Sold (Public Records) — Public Records
- 1989-04-04 Sold (Public Records) — Public Records
Property tax history
+4.6%/yrLatest (2025): $6,243 · -12.3% YoY. Source: county tax records.
Cash-flow waterfall
monthlySold comps — $/sqft
last 12 mo · ≤1 miLoading sold comps…