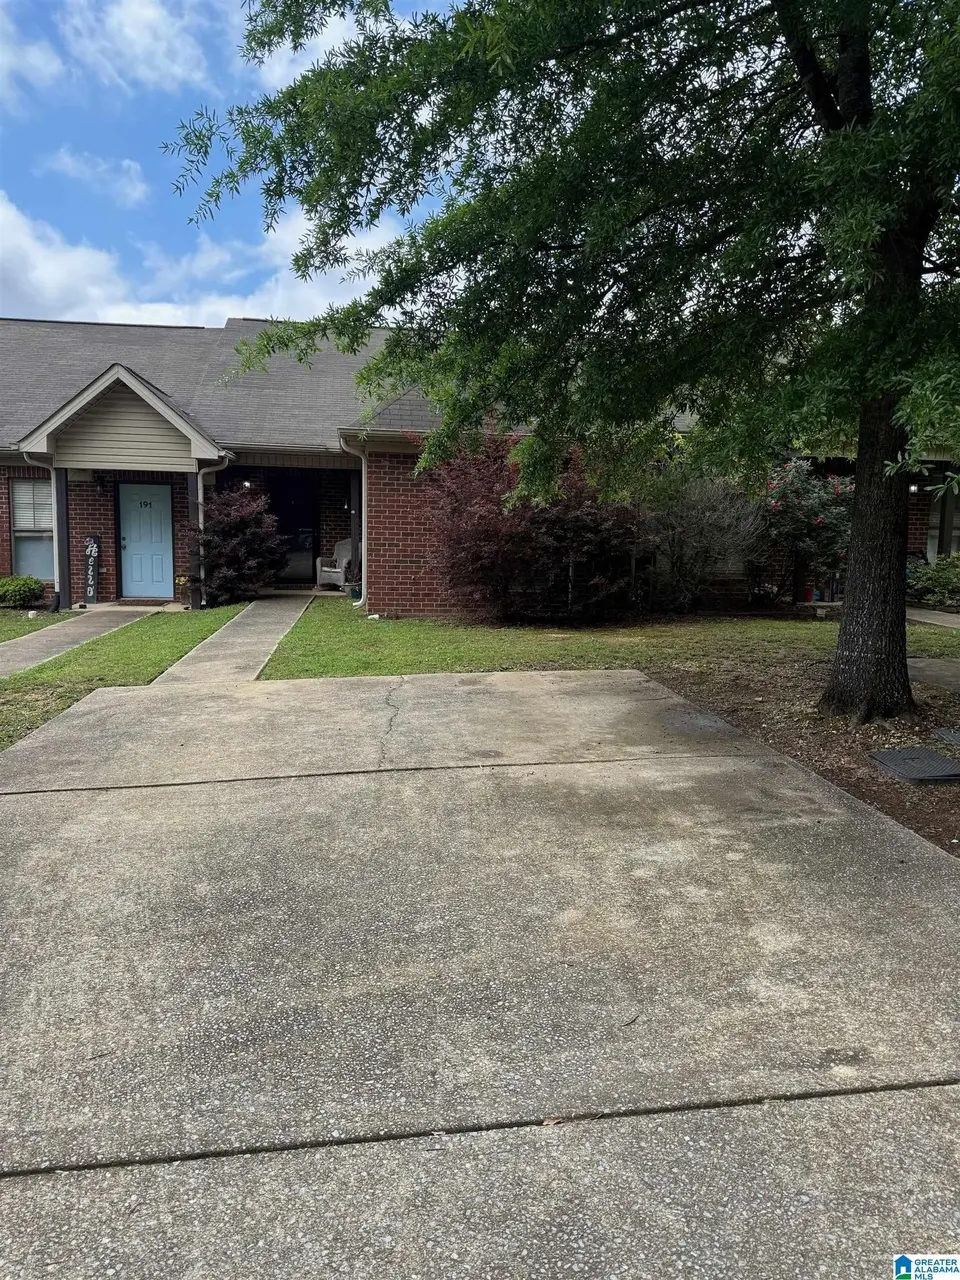
195 Apricot Ln · Calera, AL
Flood risk 1/10 · Minimal
- FEMA flood zone
- X (unshaded)
- Chance of flooding over 30 yrs
- 0.0%
- Est. flood insurance / yr
- $507 – $1,088
Fire risk 4/10 · Minor
- Est. fire insurance / yr
- $916 – $1,700
Heat risk 6/10 · Moderate
- Hot days now (above 107°F)
- 7 days/yr
- Hot days in 30 yrs
- 19 days/yr
Wind risk 6/10 · Moderate
- Chance of severe wind over 30 yrs
- 60.0%
Air-quality risk 2/10 · Minimal
- Unhealthy air days now
- 2 days/yr
- Unhealthy air days in 30 yrs
- 2 days/yr
Risk factors via First Street. Map © Google.
Why this score? — see what drove the D+ grade
The composite is a weighted blend of 9 inputs, each scored 0–100. Each bar is that input's sub-score; the figure is the points it added to the 100-point composite (weight × sub-score).
- Cash flow +15.9/30.0
- ARV discount +11.6/15.0
- DSCR +4.9/10.0
- Schools +3.9/10.0
- 1% rule +3.8/10.0
- Rent growth +3.4/5.0
- Livability +3.0/5.0
- Condition / age +2.5/5.0
- Appreciation +0.0/10.0
$169,900
🖨 Deal sheet 📄 Offer letter ✓ Due diligence
Listing remarks
Charming one-level townhouse in the heart of Calera offering 2 bedrooms and 2 full baths with an easy, low-maintenance lifestyle. This well-kept home features an open-concept living and dining area with vaulted ceilings, spacious bedrooms, and a functional kitchen with ample cabinet and counter space. The primary suite offers a private bath and generous closet space, while the second bedroom and bath provide flexibility for guests, roommates, or a home office. Whether you are a first-time buyer, looking to downsize, or searching for a strong investment opportunity, this townhouse is one you do not want to miss.
Key facts
- $13 HOA
- Built 2010
- Listed 36 days
Property features AI
Finance
- Other: Property access via paved public road; Located in Calera Commons subdivision
- HOA & community: Annual association fee of $150; HOA fees cover common grounds maintenance and utilities for common areas
Exterior
- Parking: Driveway parking
- Utilities: Public water; Connected sewer; Underground utilities; Electric water heater; Ceiling fans; Double-pane windows; Internet availability unknown
- Home design: Single-family property (existing construction); One-level living (rooms listed on main level)
- Construction: One-side brick and vinyl siding exterior; Slab foundation
- Exterior features: Covered patio; Porch; Garden/patio area; Interior lot in a subdivision; Curb and gutters
Interior
- Kitchen: Eating area; Laminate countertops; Built-in dishwasher; Built-in microwave; Refrigerator; Electric stove
- Bedrooms: Bedrooms on main level; Master bedroom on main level with walk-in closets
- Flooring: Carpet; Vinyl
- Bathrooms: Two full bathrooms; Separate shower in at least one bath; Tub/shower combo in at least one bath
- Heating & cooling: Central heating; Central air
- Interior features: Cathedral/vaulted and smooth ceilings; Some window treatments to remain; No additional interior features listed
- Laundry & utility: Laundry on main level; Washer hookup; Electric dryer hookup; Laundry located in a closet
Neighborhood map
What this means for you Summary
Snapshot
- This is a 2-bed/2.0-bath townhouse listed at $170k.
Deal economics
- At list price, monthly cash flow is $81 ($971/yr) — positive.
- The deal already cash-flows at list — no discount required.
- To meet the 1% rule (rent ≥ 1% of price), the offer needs to be $149k (12.4% below list).
- Recommended offer: $149k (12.4% below list) — sets the bar for 1% rule.
- Cap rate 6.9% vs local median 4.5% in Calera — top-decile yield for the area; either an underpriced asset or a hidden risk that comps aren't pricing in. Stress-test before assuming the spread holds.
Location & tenants
- Location reads 59/100 on livability (#325 in AL) — a working-class tenant base; expect higher turnover. Strengths: cost of living A+, housing A+, employment A-; Watch: amenities F, commute F, health & safety F.
- Shelby County (suburban): math 30% / reading 58% proficiency, ranked #16 of 129 in AL (top 12%) — families likely to look elsewhere, expect single-tenant / working-renter base with shorter leases.
- Zoned schools: Calera Elementary (752 students, 64% FRL); Calera High (math 18% / reading 21%, grade F, #169 of 305 statewide, top 59%, 1,066 students, 59% FRL) — zoned schools average 62% FRL vs 26% district-wide (36 pts higher); higher-poverty schools than district average — tighter screening recommended.
- Zoned-school proficiency averages 20% at this address vs 44% district-wide (-24 pts) — the specific schools serving this property underperform the Shelby County average; the district grade overstates school quality for this exact location.
- Market conditions: Rents rising (+3.7%/yr); 374 active listings in the ZIP; 2 comparable units currently listed for rent nearby; solid renter incomes; 987 units permitted in Shelby County in 2024 (0 in 5+ unit buildings).
Forward outlook
- Local home prices are declining (-3.0%/yr); year-one equity from $1k of loan paydown is wiped out by about $5k of value loss. Plan a longer hold.
- Shelby County population projected at +23% by 2050 — long-run rental-demand tailwind backs the buy-and-hold thesis.
Negotiation context
- It's been on market 36 days — a 3% lower offer ($165k) is reasonable based on typical stale-listing flexibility.
Risks & watch-outs
- Climate carrying-cost: major wind risk, 60% chance of damaging wind over 30y; extreme-heat days projected 7→19/yr by 2055 (HVAC capex compounding) — expect insurance premiums to compound above CPI over the hold.
Questions for the listing agent
- It's been on market 36 days. Have you received any prior offers? Is the seller open to a 12% concession, seller financing, or rate buy-down credit?
- What does the HOA fee cover, when was the last increase, and are there any pending special assessments or reserve-fund shortfalls?
- Is there a deadline driving the sale (1031 exchange, divorce, estate, relocation)? That informs how much negotiation room exists.
- Schools are D-rated, which usually means shorter tenancies and higher turnover. Who's the typical renter profile here, and what's been the actual vacancy rate?
- The area grade is low — what's the realistic commute time and amenity access for the typical tenant pool here? Any planned neighborhood developments (good or bad) we should know about?
- What's the average days-on-market for RENTAL listings here right now (not sales)? A rising rental-DOM trend means longer vacancies and softer asking-rent achievability than the comps imply.
- What's the recent tenant-quality profile in this submarket — average credit score on applications, eviction rate, late-payment / NSF rate, and stable-employment percentage? A property-management company in the area should have these aggregated.
- How much new for-sale + rental construction is in the pipeline within 1–3 miles? Heavy new supply typically softens prices + rents 12–24 months out; constrained supply supports both.
Investment metrics
- 1% rule
- 0.88% ✗
- Cap rate
- 6.86%
- Cash-on-cash
- 2.04%
- DSCR
- 1.09
- GRM
- 9.5
CMA / ARV
- ARV (median comp)
- $186,885
- List price
- $169,900
- Delta
- -9.09%
- Verdict
- FAIR
- Comps
- 13 within 1.0 mi
Show comp detail 1 sale within ~0.75 mi
| Address | Dist | Beds/Ba | Sqft | Sold | Price | $/sf | Match |
|---|---|---|---|---|---|---|---|
| 165 Danbury Ln | 0.10mi | 2/2.0 | 1,023 (+4%) | 1mo | $169,900 | $166 | 87 |
Match score weights: distance 35% · size 25% · config 20% · recency 20%. Top-matched comps best support the ARV.
Projected returns pro-forma
-3.0% appreciation · 3.67% rent growth · sell at horizon
- IRR
- -12.4%
- Equity multiple
- 0.55×
- Total profit
- $-21,392
- Equity at exit
- $25,333
- IRR
- -2.4%
- Equity multiple
- 0.83×
- Total profit
- $-7,897
- Equity at exit
- $14,690
Cash invested: $47,572 (down + closing). Projections, not guarantees.
Landlord ↔ Tenant lean methodology
- Overall (STATE)
- 90 Strongly Landlord-Friendly
- State Alabama
- 90 Strongly Landlord-Friendly · R+15
- County
- — inherits STATE
- City
- — inherits STATE
ZIP-level market 35040
- Home prices YoY
- -16.5%
- Rents YoY
- 3.7%
- Active inventory
- 374
- Price-to-rent
- 9.5×
Monthly cashflow live
- Estimated rent
- $1,488 medium interval (Pro) →
- Mortgage (P&I)
- −$891
- Tax from tax record
- −$120 /mo · $1,434/yr
- Insurance
- −$71
- HOA
- −$13
- Vacancy / Maint / Mgmt
- −$312
- Net cashflow
- $81
Break-even live
Sensitivity live
| Price | -10% $177 | -5% $129 | +0% $81 | +5% $33 | +10% $-15 |
|---|---|---|---|---|---|
| Rent | -10% $-37 | -5% $22 | +0% $81 | +5% $140 | +10% $198 |
| Rate | -1.0pp $167 | -0.5pp $124 | base $81 | +0.5pp $37 | +1.0pp $-8 |
UW: 25.0% down · 7.5% · 30yr · 1.5% tax · 5.0% vac · 8.0% maint · 8.0% mgmt
Financing live
Cash to close
- Down payment
- $42,475
- Closing costs
- $5,097
- Reserves months
- —
- Total cash needed
- —
Loan-product check · same deal, 3 products live
Conventional
25% down · 7.5% · 30yr
- Down + closing
- —
- Monthly P&I
- —
- Monthly cashflow
- —
- DSCR
- —
- Eligible?
- —
Personal DTI + credit; lowest rate.
DSCR
20% down · 8.5% · 30yr
- Down + closing
- —
- Monthly P&I
- —
- Monthly cashflow
- —
- DSCR
- —
- Eligible?
- —
No personal income docs; deal must DSCR.
Hard money
10% down · 12.0% · 12mo
- Down + closing
- —
- Monthly P&I
- —
- Monthly cashflow
- —
- DSCR
- —
- Eligible?
- —
Short-term bridge; refi at stabilization.
Rent comps 2 comps
| Address | Beds | Baths | Sqft | Rent | $/sqft | DOM | Units | Dist |
|---|---|---|---|---|---|---|---|---|
| 2027 Rossburg Pl Calera, AL | 2.0 | 2.0 | 1073 | $1,300 | $1.21 | 24d | 1 | 0.84mi |
| 699 The Heights Ln Calera, AL | 2.0 | 2.5 | 1100 | $1,400 | $1.27 | 11d | 1 | 1.07mi |
HOA detail
- Monthly dues
- $13 · $156/yr
Listing history 19 events
-
2026-06-18days on market $169,900 Active 36 DOM
-
2026-06-17days on market $169,900 Active 35 DOM
-
2026-06-16days on market $169,900 Active 34 DOM
-
2026-06-15days on market $169,900 Active 33 DOM
-
2026-06-13days on market $169,900 Active 31 DOM
-
2026-06-13days on market $169,900 Active 30 DOM
-
2026-06-10pricedays on market $169,900 Active 28 DOM
-
2026-06-09days on market $177,000 Active 27 DOM
-
2026-06-08days on market $177,000 Active 26 DOM
-
2026-06-07days on market $177,000 Active 25 DOM
-
2026-06-05days on market $177,000 Active 22 DOM
-
2026-06-03days on market $177,000 Active 21 DOM
-
2026-06-02days on market $177,000 Active 20 DOM
-
2026-06-01days on market $177,000 Active 19 DOM
-
2026-05-31days on market $177,000 Active 18 DOM
-
2026-05-16price $177,000 618-char remark
-
2026-05-14$179,000 Active 618-char remark
-
2024-03-22soldstatus $153,000
-
2018-07-19soldstatus $150,000
ⓘ Source: listings_history table (triggers on properties + properties_extension) + one-shot
backfill from property_details.listing_events for pre-trigger history.
Tax reassessment forecast AL · Resets to sale price
- Current annual tax
- $1,434 · $120/mo
- Projected year-2 tax
- $1,434 · $120/mo
- Expected delta
- $0/yr ($0/mo · 0.0%)
ⓘ Screening estimate from a state-policy table — verify with the county assessor before closing.
Climate risk First Street
- Flood 1/10 Low FEMA zone X (unshaded) · 0% chance over 30 yrs
- Wildfire 4/10 Moderate
- Heat 6/10 Major 7 d/yr ≥107°F today · 19 d/yr by 30 yrs out
- Wind 6/10 Major 60% chance of damaging wind over 30 yrs
- Air quality 2/10 Low 2 unhealthy d/yr today · 2 by 30 yrs out
Nearby sold comps map
Loading sold comps map…
Walkable amenities ~0.75 mi
Loading nearby amenities…
Taxation est. · year 1
- Rental income
- $17,852
- − Mortgage interest
- −$9,517
- − Property taxes
- −$1,434
- − Insurance
- −$850
- − Repairs & maintenance
- −$1,428
- − Management
- −$1,428
- − HOA
- −$156
- − Depreciation
- −$4,943
- Taxable loss
- −$1,904
- Est. tax savings @ 24.0%
- +$457
- After-tax cash flow
- $1,428/yr
For passive investors: Depreciation is non-cash, so a rental often shows a tax loss while cash-flowing — sheltering income. Rental losses are passive: they offset passive income freely, and up to $25,000/yr can offset ordinary (W-2) income if you actively participate and your MAGI is under $100k (phasing out to $0 by $150k); unused losses carry forward. On sale, claimed depreciation is recaptured at up to 25%, and gains may owe capital-gains tax (a 1031 exchange can defer both). Figures are a year-1 estimate at your 24.0% rate — not tax advice; consult a CPA.
Schools (NCES district)
- District
- Shelby County
- NCES district ID
- 0103030
- Math proficiency
- 30% ▼ -28.00%
- Reading proficiency
- 58% ▲ 2.00%
- Median HH income
- $66,672
- Composite
- 39.29/100
- National rank
- #3995
- State rank
- #16 of 129 in AL
Livability — Calera
- Score
- 59/100
- State rank
- #325
- US rank
- #19917
Category grades
Schools grade is shown separately in the Schools card above.
Census & demographics
- Census place
- Calera, AL
- County
- Shelby County · 188,970 people
- City population
- 19,304
- Metro
- Birmingham-Hoover, AL
- Population (ZIP)
- 19,304
- Household income
- $84,554
- Rent vs Own
- Severe rent burden
- 388.0
Population outlook (Shelby County) Hauer SSP2
- Today (2025)
- 237,024 people
- By 2030
- 249,868 · +5.4%
- By 2040
- 272,778 · +15.1%
- By 2050
- 291,062 · +22.8%
- By 2075
- 326,049 · +37.6%
- By 2100
- 335,870 · +41.7%
Race, ethnicity, and origin ACS 2023
- Neighborhood character
- Diverse neighborhood (Simpson 0.56)
- Race & ethnicity
- White 59% Black 30% Hispanic / Latino 9% Two or more races 3%
- Hispanic origin (detail)
- Mexican 7%
- Common ancestry
- Slovak 3% Italian 1% Serbian 1%
- Foreign-born
- 6% · Canada, China
- Languages at home
- 91% English-only · Spanish 6% Arabic 1% Chinese 1%
Political lean MEDSL · Shelby
- 2024 margin
- Solid R (+40.9) · D 29.0% · R 69.9% · Other 1.1%
- 2008→2024 swing
- +12.6pp toward D · 2008: -53.4pp · 2024: -40.9pp
- All cycles
- 2024: R+40.9 2020: R+40.4 2016: R+50.3 2012: R+55.6 2008: R+53.4
Not yet ingested
- Civics
- —
Market trends
- HPI YoY
- ▼ -43.58%
- Current HPI
- 220.2843
- Rent YoY
- ▲ 3.67%
- Metro
- Birmingham-Hoover, AL
- State GDP YoY
- ▲ 2.94%
- F500 in state
- 4
Industry mix (Fortune 500 HQ in AL)
| Industry | F500 HQs | Revenue |
|---|---|---|
| Financial Services | 1 | $8B |
|
||
| Healthcare | 1 | $5B |
|
||
Price history
+13.3% since first listed5 events — show timeline
- 2026-06-10 Price Changed $169,900 Greater Alabama MLS
- 2026-05-16 Price Changed $177,000 Greater Alabama MLS
- 2026-05-14 Listed $179,000 Greater Alabama MLS
- 2024-03-22 Sold (Public Records) $153,000 Public Records
- 2018-07-19 Sold (Public Records) $150,000 Public Records
Property tax history
+4.0%/yrLatest (2025): $1,434 · +0.2% YoY. Source: county tax records.
Cash-flow waterfall
monthlySold comps — $/sqft
last 12 mo · ≤1 miLoading sold comps…