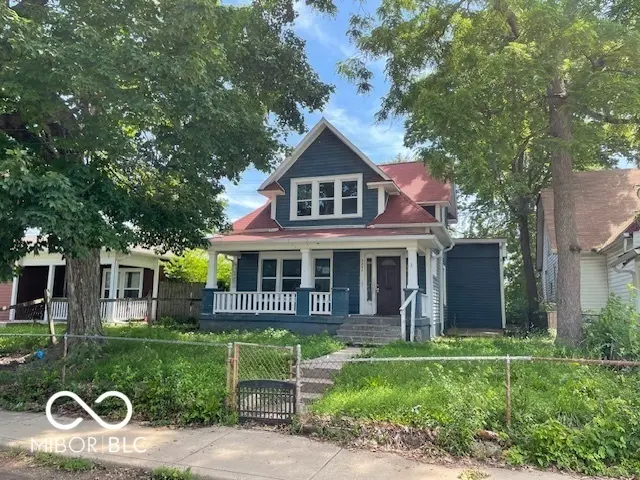
3247 Graceland Ave · Indianapolis city (balance), IN
Flood risk 1/10 · Minimal
- FEMA flood zone
- X (unshaded)
- Chance of flooding over 30 yrs
- 0.0%
- Est. flood insurance / yr
- $473 – $860
Fire risk 1/10 · Minimal
- Est. fire insurance / yr
- $717 – $1,331
Heat risk 4/10 · Minor
- Hot days now (above 101°F)
- 7 days/yr
- Hot days in 30 yrs
- 19 days/yr
Wind risk 2/10 · Minimal
- Chance of severe wind over 30 yrs
- 0.0%
Air-quality risk 4/10 · Minor
- Unhealthy air days now
- 5 days/yr
- Unhealthy air days in 30 yrs
- 7 days/yr
Risk factors via First Street. Map © Google.
Why this score? — see what drove the B- grade
The composite is a weighted blend of 9 inputs, each scored 0–100. Each bar is that input's sub-score; the figure is the points it added to the 100-point composite (weight × sub-score).
- Cash flow +30.0/30.0
- 1% rule +10.0/10.0
- DSCR +10.0/10.0
- ARV discount +7.5/15.0
- Rent growth +4.1/5.0
- Livability +2.5/5.0
- Condition / age +2.5/5.0
- Schools +1.4/10.0
- Appreciation +0.0/10.0
$95,000
🖨 Deal sheet 📄 Offer letter ✓ Due diligence
Listing remarks MLS
Welcome home to this adorable and move-in-ready property in the popular Crown Hill Neighborhood! You will love the updated kitchen and bathrooms, as well as, all the natural light from the many windows. This home features 5 bedrooms, with 3 upstairs and 2 downstairs on the main level. A wonderful perk to living here is the FREE memberships to both Newfields and the Indianapolis Children's Museum. Conveniently, you'll have a quick drive time to downtown, Midtown, Butler University, highway, parks, restaurants, and more! Book your showing today!
Key facts
- Private yard
- Welcoming porch
- 5,271 sq ft lot
Tags
Property features AI
Finance
- Other: Lot size approximately 0.12 acre (<1/4 acre)
Exterior
- Parking: Alley access
- Utilities: Public water; Municipal sewer connected; Solid waste service available
- Home design: Single-family residence; Two levels
- Construction: Vinyl siding; Block foundation
- Exterior features: Partial fencing; Not in a subdivision
Interior
- Kitchen: No appliances included
- Bedrooms: Five bedrooms (2 on the main level, 3 on the upper level); Bedroom sizes include 18x10, 13x13, 15x11, 12x11 (various rooms on main and upper levels)
- Bathrooms: Two full bathrooms (one on main level, one on upper level)
- Heating & cooling: Forced air heating (natural gas); Central air conditioning
- Interior features: Attic access; Unfinished basement
- Laundry & utility: Basement utility space
Neighborhood map
What this means for you Summary
Snapshot
- This is a 5-bed/2.0-bath single-family listed at $95k.
Deal economics
- At list price, monthly cash flow is $937 ($11k/yr) — positive.
- The deal already cash-flows at list — no discount required.
- Meets the 1% rule at list price ($2k rent vs $95k).
- Cap rate 18.1% vs local median 4.4% in Indianapolis city (balance) — top-decile yield for the area; either an underpriced asset or a hidden risk that comps aren't pricing in. Stress-test before assuming the spread holds.
Location & tenants
- Location reads: area grade B — affects rentability + tenant quality, not the cash-flow math above.
- Indianapolis Public Schools (urban): math 14% / reading 20% proficiency, ranked #286 of 301 in IN (top 95%) — low school quality limits family demand, transient renter base, plan for 1-2y turnover; 77% free/reduced lunch — lower-income household profile, screen leases tightly.
- Market conditions: Rents rising fast (+6.4%/yr); 279 active listings in the ZIP; 10 comparable units currently listed for rent nearby; rentals at typical pace (median 24d on market — plan ~3-4 weeks tenant-placement turnaround); 1,906 units permitted in Marion County in 2024 (621 in 5+ unit buildings).
- This rent runs 42% of the median local income ($60k/yr) — at the standard rent-burdened threshold; future hikes will face affordability resistance.
Forward outlook
- Local home prices are declining (-3.0%/yr); year-one equity from $657 of loan paydown is wiped out by about $3k of value loss. Plan a longer hold.
- Marion County population projected at +18% by 2050 — long-run rental-demand tailwind backs the buy-and-hold thesis.
- At projected returns (-3.0% appreciation + 6.4% rent growth), your $27k cash investment doubles in ~3 years — after that, you're playing with house money.
Negotiation context
- Only 5 days on market — expect competitive offers; lowballing is unlikely to land.
- 10 sale attempts since 23y ago with the ask held roughly flat each time — persistent listings suggest the price (not the market) is what's stuck; bring a comps-based counter.
Risks & watch-outs
- Watch-outs: built in 1920 — expect roof / HVAC / electrical / plumbing capex.
Questions for the listing agent
- Built in 1920 — when were the roof, HVAC, electrical panel, plumbing, and water heater last replaced?
- Is there a deadline driving the sale (1031 exchange, divorce, estate, relocation)? That informs how much negotiation room exists.
- What's the average days-on-market for RENTAL listings here right now (not sales)? A rising rental-DOM trend means longer vacancies and softer asking-rent achievability than the comps imply.
- What's the recent tenant-quality profile in this submarket — average credit score on applications, eviction rate, late-payment / NSF rate, and stable-employment percentage? A property-management company in the area should have these aggregated.
- How much new for-sale + rental construction is in the pipeline within 1–3 miles? Heavy new supply typically softens prices + rents 12–24 months out; constrained supply supports both.
Investment metrics
- 1% rule
- 2.22% ✓
- Cap rate
- 18.13%
- Cash-on-cash
- 42.29%
- DSCR
- 2.88
- GRM
- 3.8
CMA / ARV
- ARV (on-the-fly)
- $242,416
- Comps found
- 6
Show comp detail 6 sales within ~0.75 mi
| Address | Dist | Beds/Ba | Sqft | Sold | Price | $/sf | Match |
|---|---|---|---|---|---|---|---|
| 520 W 28th St | 0.67mi | 5/2.0 | 1,734 (-1%) | 4mo | $196,500 | $113 | 65 |
| 3160 Graceland Ave | 0.14mi | 4/2.0 (-1) | 1,936 (+11%) | 13mo | $130,000 | $67 | 59 |
| 3341 N Capitol Ave | 0.12mi | 4/2.0 (-1) | 1,562 (-10%) | 16mo | $210,000 | $134 | 59 |
| 3626 N Capitol Ave | 0.47mi | 4/2.5 (-1) | 1,632 (-6%) | 11mo | $261,500 | $160 | 52 |
| 3131 Boulevard Pl | 0.20mi | 4/3.0 (-1) | 1,956 (+12%) | 12mo | $271,500 | $139 | 51 |
| 2701 Boulevard Pl | 0.67mi | 4/3.0 (-1) | 1,558 (-11%) | 9mo | $320,000 | $205 | 35 |
Match score weights: distance 35% · size 25% · config 20% · recency 20%. Top-matched comps best support the ARV.
Projected returns pro-forma
-3.0% appreciation · 6.43% rent growth · sell at horizon
- IRR
- 43.0%
- Equity multiple
- 2.95×
- Total profit
- $51,899
- Equity at exit
- $14,165
- IRR
- 50.7%
- Equity multiple
- 6.84×
- Total profit
- $155,464
- Equity at exit
- $8,214
Cash invested: $26,600 (down + closing). Projections, not guarantees.
Landlord ↔ Tenant lean methodology
- Overall (STATE)
- 90 Strongly Landlord-Friendly
- State Indiana
- 90 Strongly Landlord-Friendly · R+11
- County
- — inherits STATE
- City
- — inherits STATE
ZIP-level market 46208
- Rents YoY
- 6.4%
- Active inventory
- 279
- Price-to-rent
- 3.8×
Monthly cashflow live
- Estimated rent
- $2,105 high interval (Pro) →
- Mortgage (P&I)
- −$498
- Tax from tax record
- −$188 /mo · $2,252/yr
- Insurance
- −$40
- HOA
- −$0
- Vacancy / Maint / Mgmt
- −$442
- Net cashflow
- $937
Break-even live
UW: 25.0% down · 7.5% · 30yr · 1.5% tax · 5.0% vac · 8.0% maint · 8.0% mgmt
Financing live
Cash to close
- Down payment
- $23,750
- Closing costs
- $2,850
- Reserves months
- —
- Total cash needed
- —
Loan-product check · same deal, 3 products live
Conventional
25% down · 7.5% · 30yr
- Down + closing
- —
- Monthly P&I
- —
- Monthly cashflow
- —
- DSCR
- —
- Eligible?
- —
Personal DTI + credit; lowest rate.
DSCR
20% down · 8.5% · 30yr
- Down + closing
- —
- Monthly P&I
- —
- Monthly cashflow
- —
- DSCR
- —
- Eligible?
- —
No personal income docs; deal must DSCR.
Hard money
10% down · 12.0% · 12mo
- Down + closing
- —
- Monthly P&I
- —
- Monthly cashflow
- —
- DSCR
- —
- Eligible?
- —
Short-term bridge; refi at stabilization.
Rent comps 10 comps
| Address | Beds | Baths | Sqft | Rent | $/sqft | DOM | Units | Dist |
|---|---|---|---|---|---|---|---|---|
| 3160 Graceland Ave Indianapolis, IN | 4.0 | 2.0 | 1936 | $2,000 | $1.03 | 24d | 1 | 0.14mi |
| 3655 N Kenwood Ave Indianapolis, IN | 4.0 | 2.0 | 1700 | $1,700 | $1.00 | 24d | 1 | 0.54mi |
| 3827 Graceland Ave Indianapolis, IN | 4.0 | 2.0 | 2195 | $1,595 | $0.73 | 44d | 1 | 0.73mi |
| 320 W 39th St Indianapolis, IN | 4.0 | 2.0 | 1216 | $2,200 | $1.81 | 7d | 1 | 0.81mi |
| 3128 Broadway St Indianapolis, IN | 4.0 | 1.5 | 1999 | $2,200 | $1.10 | 24d | 1 | 0.84mi |
| 445 W 25th St Indianapolis, IN | 4.0 | 2.0 | 1500 | $1,900 | $1.27 | 44d | 1 | 0.89mi |
| 4117 Byram Ave Indianapolis, IN | 4.0 | 2.0 | 1540 | $1,930 | $1.25 | 44d | 1 | 1.18mi |
| 1331 W 34th St Indianapolis, IN | 4.0 | 2.0 | 2160 | $1,800 | $0.83 | 15d | 1 | 1.29mi |
| 528 W 43rd St Indianapolis, IN | 4.0 | 2.0 | 2080 | $2,750 | $1.32 | 3d | 1 | 1.36mi |
| 731 W 43rd St Indianapolis, IN | 4.0 | 4.0 | 1600 | $3,350 | $2.09 | 18d | 1 | 1.40mi |
Listing history 5 events
-
2026-06-18status $95,000 Active 5 DOM
-
2026-06-07statusdays on market $95,000 Pending 5 DOM
-
2026-06-03days on market $95,000 Active 2 DOM
-
2026-06-01remarks 677-char remark
-
2026-06-01$95,000 Active 1 DOM
ⓘ Source: listings_history table (triggers on properties + properties_extension) + one-shot
backfill from property_details.listing_events for pre-trigger history.
Tax reassessment forecast IN · Partial reset (capped growth)
- Current annual tax
- $2,252 · $188/mo
- Projected year-2 tax
- $2,252 · $188/mo
- Expected delta
- $0/yr ($0/mo · 0.0%)
ⓘ Screening estimate from a state-policy table — verify with the county assessor before closing.
Climate risk First Street
- Flood 1/10 Low FEMA zone X (unshaded) · 0% chance over 30 yrs
- Wildfire 1/10 Low
- Heat 4/10 Moderate 7 d/yr ≥101°F today · 19 d/yr by 30 yrs out
- Wind 2/10 Low 0% chance of damaging wind over 30 yrs
- Air quality 4/10 Moderate 5 unhealthy d/yr today · 7 by 30 yrs out
Nearby sold comps map
Loading sold comps map…
Walkable amenities ~0.75 mi
Loading nearby amenities…
Taxation est. · year 1
- Rental income
- $25,259
- − Mortgage interest
- −$5,321
- − Property taxes
- −$2,252
- − Insurance
- −$475
- − Repairs & maintenance
- −$2,021
- − Management
- −$2,021
- − Depreciation
- −$2,764
- Taxable income
- $10,405
- Est. tax owed @ 24.0%
- −$2,497
- After-tax cash flow
- $8,752/yr
For passive investors: Depreciation is non-cash, so a rental often shows a tax loss while cash-flowing — sheltering income. Rental losses are passive: they offset passive income freely, and up to $25,000/yr can offset ordinary (W-2) income if you actively participate and your MAGI is under $100k (phasing out to $0 by $150k); unused losses carry forward. On sale, claimed depreciation is recaptured at up to 25%, and gains may owe capital-gains tax (a 1031 exchange can defer both). Figures are a year-1 estimate at your 24.0% rate — not tax advice; consult a CPA.
Schools (NCES district)
- District
- Indianapolis Public Schools
- NCES district ID
- 1804770
- Math proficiency
- 14% ▼ -7.00%
- Reading proficiency
- 20% ▼ -3.00%
- Median HH income
- $32,034
- Composite
- 13.69/100
- National rank
- #9499
- State rank
- #286 of 301 in IN
Livability — Indianapolis city (balance)
No livability data for this city. (Only ~50 U.S. cities are tracked.)
Census & demographics
- Census place
- Indianapolis city (balance), IN
- County
- Marion County · 998,460 people
- City population
- 881,119
- Metro
- Indianapolis-Carmel-Anderson, IN
- Population (ZIP)
- 22,379
- Household income
- $60,062
- Rent vs Own
- Severe rent burden
- 978.0
Population outlook (Marion County) Hauer SSP2
- Today (2025)
- 1,025,572 people
- By 2030
- 1,065,727 · +3.9%
- By 2040
- 1,141,577 · +11.3%
- By 2050
- 1,208,920 · +17.9%
- By 2075
- 1,367,288 · +33.3%
- By 2100
- 1,438,201 · +40.2%
Race, ethnicity, and origin ACS 2023
- Neighborhood character
- Diverse neighborhood (Simpson 0.62)
- Race & ethnicity
- White 46% Black 40% Hispanic / Latino 8% Two or more races 6% Asian 2%
- Hispanic origin (detail)
- Mexican 4%
- Common ancestry
- Romanian 2% Slovak 2% Italian 1%
- Foreign-born
- 4% · Canada
- Languages at home
- 93% English-only · Spanish 5% French/Haitian/Cajun 1% Other Indo-European 1%
Political lean MEDSL · Marion
- 2024 margin
- Strong D (+27.7) · D 63.0% · R 35.3% · Other 1.7%
- 2008→2024 swing
- -0.7pp no change · 2008: 28.4pp · 2024: 27.7pp
- All cycles
- 2024: D+27.7 2020: D+29.1 2016: D+22.8 2012: D+22.2 2008: D+28.4
Not yet ingested
- Civics
- —
Market trends
- HPI YoY
- ▼ -324.63%
- Current HPI
- 319.7725
- Rent YoY
- ▲ 6.43%
- Metro
- Indianapolis-Carmel-Anderson, IN
- State GDP YoY
- ▲ 2.90%
- F500 in state
- 18
Industry mix (Fortune 500 HQ in IN)
| Industry | F500 HQs | Revenue |
|---|---|---|
| Industrial Machinery | 2 | $37B |
|
||
| Healthcare | 1 | $177B |
|
||
| Pharmaceuticals | 1 | $45B |
|
||
| Metals / Steel | 1 | $18B |
|
||
| Agriculture | 1 | $17B |
|
||
| Packaging | 1 | $12B |
|
||
Price history
+322.2% since first listed28 events — show timeline
- 2026-05-31 Listed $95,000 MIBOR as Distributed by MLS Grid
- 2023-03-09 Sold (MLS) $204,900 MIBOR as Distributed by MLS Grid
- 2023-02-10 Pending — MIBOR as Distributed by MLS Grid
- 2023-01-31 Price Changed $209,900 MIBOR as Distributed by MLS Grid
- 2022-11-16 Listed $215,000 MIBOR as Distributed by MLS Grid
- 2018-05-11 Sold (MLS) $119,900 MIBOR as Distributed by MLS Grid
- 2018-04-08 Pending — MIBOR as Distributed by MLS Grid
- 2018-03-29 Contingent — MIBOR as Distributed by MLS Grid
- 2018-03-27 Listed $119,900 MIBOR as Distributed by MLS Grid
- 2017-12-28 Sold (Public Records) $24,000 Public Records
- 2016-10-03 Sold (Public Records) $16,000 Public Records
- 2016-09-22 Sold (MLS) $16,000 MIBOR as Distributed by MLS Grid
- 2016-09-13 Pending — MIBOR as Distributed by MLS Grid
- 2016-07-19 Price Changed $22,500 MIBOR as Distributed by MLS Grid
- 2016-07-19 Relisted — MIBOR as Distributed by MLS Grid
- 2016-07-16 Listing Removed — MIBOR as Distributed by MLS Grid
- 2016-05-11 Price Changed $30,000 MIBOR as Distributed by MLS Grid
- 2016-04-22 Listed $35,000 MIBOR as Distributed by MLS Grid
- 2016-03-24 Listing Removed — MIBOR as Distributed by MLS Grid
- 2016-01-04 Listed $35,000 MIBOR as Distributed by MLS Grid
- 2014-09-06 Listing Removed — MIBOR as Distributed by MLS Grid
- 2014-03-05 Listed $45,000 MIBOR as Distributed by MLS Grid
- 2013-09-10 Listing Removed — MIBOR as Distributed by MLS Grid
- 2013-05-28 Listed $25,000 MIBOR as Distributed by MLS Grid
- 2003-11-12 Sold (MLS) $16,500 MIBOR as Distributed by MLS Grid
- 2003-10-17 Listing Removed — MIBOR as Distributed by MLS Grid
- 2003-09-29 Listed $19,900 MIBOR as Distributed by MLS Grid
- 2003-07-17 Listed $22,500 MIBOR as Distributed by MLS Grid
Property tax history
+9.8%/yrLatest (2025): $2,252 · -2.1% YoY. Source: county tax records.
Cash-flow waterfall
monthlySold comps — $/sqft
last 12 mo · ≤1 miLoading sold comps…