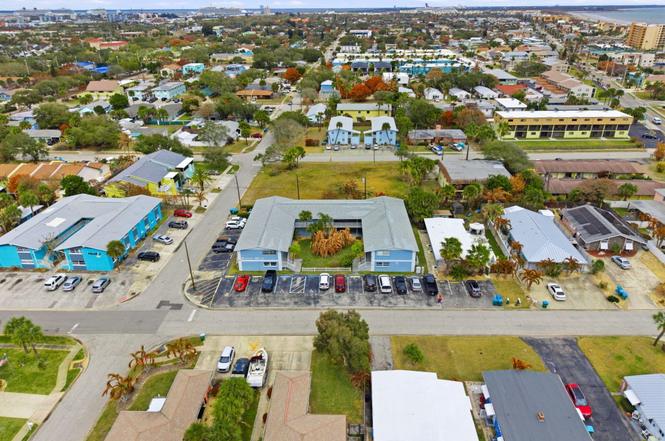
302 Lincoln Ave #12 · Cape Canaveral, FL
Flood risk 7/10 · Major
- FEMA flood zone
- AO
- Chance of flooding over 30 yrs
- 0.75%
- Est. flood insurance / yr
- $848 – $2,087
Fire risk 1/10 · Minimal
- Est. fire insurance / yr
- $947 – $1,759
Heat risk 10/10 · Severe
- Hot days now (above 105°F)
- 7 days/yr
- Hot days in 30 yrs
- 24 days/yr
Wind risk 10/10 · Severe
- Chance of severe wind over 30 yrs
- 99.0%
Air-quality risk 1/10 · Minimal
- Unhealthy air days now
- 0 days/yr
- Unhealthy air days in 30 yrs
- 0 days/yr
Risk factors via First Street. Map © Google.
Why this score? — see what drove the D+ grade
The composite is a weighted blend of 9 inputs, each scored 0–100. Each bar is that input's sub-score; the figure is the points it added to the 100-point composite (weight × sub-score).
- Cash flow +13.5/30.0
- 1% rule +7.7/10.0
- ARV discount +7.5/15.0
- Schools +4.7/10.0
- Livability +4.2/5.0
- DSCR +4.1/10.0
- Rent growth +3.5/5.0
- Condition / age +2.5/5.0
- Appreciation +0.0/10.0
$149,900
🖨 Deal sheet 📄 Offer letter ✓ Due diligence
Listing remarks
Welcome to this 2-bedroom, 1-bath corner unit in Ocean Mist Condos, located in the heart of Cape Canaveral. Situated on the second floor as an end unit, this condo offers added privacy, extra natural light, and a quiet coastal setting just a 5-minute walk to public beach access. The unit features newer hurricane impact windows and an assigned parking space. Rentals are allowed with a minimum 1-month lease, making this a flexible option for both full-time residents and investors. Conveniently located minutes from Port Canaveral and Cocoa Beach, you'll enjoy easy access to dining, shopping, cruise terminals, and all that the Space Coast has to offer. The condo is ready for a buyer's unique to
Key facts
- Public beach access
- $478 HOA
- Built 1964
Tags
Property features AI
Finance
- HOA & community: Part of Atlantic Horizon association; Monthly association fee of $365; Additional monthly fee of $113.50; Association covers insurance and grounds maintenance; Association amenities include laundry, grounds maintenance, structure maintenance, and off-site management
Exterior
- Parking: Assigned parking; Guest parking; Off-street parking; Parking lot
- Utilities: Public sewer; Cable available; Electricity available; Sewer connected; Water connected
- Home design: Condominium; 2 stories; Entry on level 2; Faces east
- Construction: Block construction
- Exterior features: Impact windows
Interior
- Kitchen: Electric cooktop; Electric oven; Freezer; Refrigerator
- Bedrooms: 2 bedrooms
- Flooring: Carpet; Laminate; Tile
- Bathrooms: 1 full bathroom
- Heating & cooling: Central heating; Electric heating; Hot water heating; Central air conditioning; Electric cooling
- Interior features: Open floorplan; Pantry
- Laundry & utility: Laundry on upper level; Electric water heater
Neighborhood map
What this means for you Summary
Snapshot
- This is a 2-bed/1.0-bath condo listed at $150k.
Deal economics
- At list price, monthly cash flow is $-115 ($-1k/yr) — negative.
- To cash-flow at today's rent, offer at most $130k (13.6% below list).
- Meets the 1% rule at list price ($2k rent vs $150k).
- Recommended offer: $130k (13.6% below list) — sets the bar for cash-flow.
Location & tenants
- Location reads 84/100 on livability (#34 in FL, #677 nationally) — a professional / high-income tenant draw. Strengths: crime A+, commute A+, housing A+; Watch: amenities F.
- Brevard (suburban): math 53% / reading 57% proficiency, ranked #19 of 73 in FL (top 26%) — acceptable for families but not a draw, mixed tenant base, ~2y average lease.
- Zoned schools: Cape View Elementary School (math 62% / reading 62%, grade B, #608 of 2,144 statewide, top 29%, 305 students, 61% FRL); Cocoa Beach Junior/Senior High School (math 65% / reading 66%, grade B, #75 of 667 statewide, top 11%, 982 students, 30% FRL) — zoned schools at 45% FRL track the district average.
- Market conditions: Rents rising fast (+4.0%/yr); 219 active listings in the ZIP; 40 comparable units currently listed for rent nearby; rentals at typical pace (median 23d on market — plan ~3-4 weeks tenant-placement turnaround); 4,602 units permitted in Brevard County in 2024 (702 in 5+ unit buildings).
- This rent runs 34% of the median local income ($67k/yr) — at the standard rent-burdened threshold; future hikes will face affordability resistance.
Forward outlook
- Local home prices are declining (-3.0%/yr); year-one equity from $1k of loan paydown is wiped out by about $4k of value loss. Plan a longer hold.
- Brevard County population projected at +15% by 2050 — modest demand growth; plan on rents tracking national, not racing it.
Negotiation context
- It's been on market 85 days — a 6% lower offer ($141k) is reasonable based on typical stale-listing flexibility.
- 2 sale attempts with the ask held roughly flat each time — persistent listings suggest the price (not the market) is what's stuck; bring a comps-based counter.
- Current owner paid $28k; list at $150k implies a 435% gain — meaningful room to come down on a strong offer.
Risks & watch-outs
- Watch-outs: flood insurance adds $122/mo; HOA is 25% of rent.
- Climate carrying-cost: in FEMA flood zone AO (mandatory federal flood insurance); severe wind risk, 99% chance of damaging wind over 30y; extreme-heat days projected 7→24/yr by 2055 (HVAC capex compounding) — expect insurance premiums to compound above CPI over the hold.
Questions for the listing agent
- What do current leases actually rent for vs. the listed asking? Can we see a recent rent roll and the last 12 months of T-12 income?
- It's been on market 85 days. Have you received any prior offers? Is the seller open to a 14% concession, seller financing, or rate buy-down credit?
- Built in 1964 — when were the roof, HVAC, electrical panel, plumbing, and water heater last replaced?
- What's the actual annual flood-insurance premium (NFIP or private), and is the property in a SFHA with mandatory coverage?
- What does the HOA fee cover, when was the last increase, and are there any pending special assessments or reserve-fund shortfalls?
- Any open or pending special assessments — roof, HVAC, plumbing, elevator, façade? What's the per-unit balance and payoff schedule, and is the seller paying it off at close or rolling it to the buyer?
- Why hasn't it sold? Are there any deal-killer items the seller is aware of (foundation, flood, title, zoning, code violations)?
- Is there a deadline driving the sale (1031 exchange, divorce, estate, relocation)? That informs how much negotiation room exists.
- Schools are B-rated — typically a magnet for longer-tenancy family renters. What's the average tenant stay here, and is there a school-zone premium baked into asking?
- The area grade is low — what's the realistic commute time and amenity access for the typical tenant pool here? Any planned neighborhood developments (good or bad) we should know about?
- What's the average days-on-market for RENTAL listings here right now (not sales)? A rising rental-DOM trend means longer vacancies and softer asking-rent achievability than the comps imply.
- What's the recent tenant-quality profile in this submarket — average credit score on applications, eviction rate, late-payment / NSF rate, and stable-employment percentage? A property-management company in the area should have these aggregated.
- How much new apartment / multifamily construction is in the pipeline within 1–3 miles? Heavy new supply (>2% of stock underway) typically softens rents 12–24 months out; light construction supports rent growth.
Investment metrics
- 1% rule
- 1.27% ✓
- Cap rate
- 6.35%
- Cash-on-cash
- 0.20%
- DSCR
- 1.01
- GRM
- 6.6
CMA / ARV
No comps found within radius.
Projected returns pro-forma
-3.0% appreciation · 4.02% rent growth · sell at horizon
- IRR
- -19.6%
- Equity multiple
- 0.30×
- Total profit
- $-29,284
- Equity at exit
- $22,351
- IRR
- -8.9%
- Equity multiple
- 0.40×
- Total profit
- $-25,138
- Equity at exit
- $12,961
Cash invested: $41,972 (down + closing). Projections, not guarantees.
Landlord ↔ Tenant lean methodology
- Overall (STATE)
- 87 Strongly Landlord-Friendly
- State Florida
- 87 Strongly Landlord-Friendly · R+3
- County
- — inherits STATE
- City
- — inherits STATE
ZIP-level market 32920
- Home prices YoY
- -29.5%
- Rents YoY
- 4.0%
- Active inventory
- 219
- Price-to-rent
- 6.6×
Monthly cashflow live
- Estimated rent
- $1,901 high interval (Pro) →
- Mortgage (P&I)
- −$786
- Tax from tax record
- −$169 /mo · $2,025/yr
- Insurance
- −$62
- Flood insurance flood zone
- −$122 /mo · $1,468/yr
- HOA
- −$478
- Vacancy / Maint / Mgmt
- −$399
- Net cashflow
- $-115
Break-even live
UW: 25.0% down · 7.5% · 30yr · 1.5% tax · 5.0% vac · 8.0% maint · 8.0% mgmt
Financing live
Cash to close
- Down payment
- $37,475
- Closing costs
- $4,497
- Reserves months
- —
- Total cash needed
- —
Loan-product check · same deal, 3 products live
Conventional
25% down · 7.5% · 30yr
- Down + closing
- —
- Monthly P&I
- —
- Monthly cashflow
- —
- DSCR
- —
- Eligible?
- —
Personal DTI + credit; lowest rate.
DSCR
20% down · 8.5% · 30yr
- Down + closing
- —
- Monthly P&I
- —
- Monthly cashflow
- —
- DSCR
- —
- Eligible?
- —
No personal income docs; deal must DSCR.
Hard money
10% down · 12.0% · 12mo
- Down + closing
- —
- Monthly P&I
- —
- Monthly cashflow
- —
- DSCR
- —
- Eligible?
- —
Short-term bridge; refi at stabilization.
Rent comps 40 comps
| Address | Beds | Baths | Sqft | Rent | $/sqft | DOM | Units | Dist |
|---|---|---|---|---|---|---|---|---|
| 7101 Ridgewood Ave #203 Cape Canaveral, FL | 2.0 | 1.5 | 1110 | $1,900 | $1.71 | 23d | 1 | 0.07mi |
| 330 Pierce Ave Cape Canaveral, FL | 1.0 | 1.0 | 800 | $1,800 | $2.25 | 23d | 1 | 0.11mi |
| 206 Pierce Ave Cape Canaveral, FL | 2.0 | 1.0 | 1000 | $2,000 | $2.00 | 14d | 1 | 0.15mi |
| 315 Grant Ave Cocoa Beach, FL | 2.0 | 2.0 | 720 | $1,795 | $2.49 | 13d | 1 | 0.16mi |
| 315 Grant Ave Cocoa Beach, FL | 2.0 | 2.0 | 720 | $1,795 | $2.49 | 23d | 1 | 0.16mi |
| 500 Fillmore Ave Unit 1320142P Cape Canaveral, FL | 2.0 | 2.0 | 968 | $4,115 | $4.25 | 21d | 1 | 0.18mi |
| 7301 Ridgewood Ave Unit A101 Cape Canaveral, FL | 2.0 | 2.0 | 1045 | $1,900 | $1.82 | 23d | 1 | 0.19mi |
| 310 Taylor Ave Unit C19 Cape Canaveral, FL | 2.0 | 1.0 | 921 | $1,525 | $1.66 | 14d | 1 | 0.22mi |
| 310 Taylor Ave Cape Canaveral, FL | 1.0–2.0 | 1.0 | 820 | $1,600 | $1.95 | 23d | 3 | 0.22mi |
| 515 Hayes Ave Unit 1543008P Cocoa Beach, FL | 1.0 | 1.0 | 613 | $3,011 | $4.91 | 14d | 1 | 0.22mi |
| 355 Polk Ave #8 Cape Canaveral, FL | 1.0 | 1.0 | 550 | $1,300 | $2.36 | 14d | 1 | 0.24mi |
| 375 Polk Ave Unit 12A4 Cape Canaveral, FL | 2.0 | 1.5 | 868 | $2,100 | $2.42 | 14d | 1 | 0.25mi |
| 375 Polk Ave Unit A18 Cape Canaveral, FL | 2.0 | 1.0 | 921 | $1,700 | $1.85 | 23d | 1 | 0.25mi |
| 415 Harrison Ave #4 Cape Canaveral, FL | 2.0 | 1.0 | 900 | $1,300 | $1.44 | 23d | 1 | 0.37mi |
| 209 Cleveland Ave Unit 4 Cocoa Beach, FL | 2.0 | 1.0 | 624 | $1,400 | $2.24 | 14d | 1 | 0.41mi |
| 209 Cleveland Ave Unit 4B Cocoa Beach, FL | 1.0 | 1.0 | 624 | $1,400 | $2.24 | 18d | 1 | 0.41mi |
| 205 Cleveland Ave #1 Cocoa Beach, FL | 2.0 | 1.0 | 675 | $1,595 | $2.36 | 23d | 1 | 0.41mi |
| 7777 Magnolia Ave Unit 8 Cape Canaveral, FL | 2.0 | 1.0 | 891 | $1,800 | $2.02 | 23d | 1 | 0.41mi |
| 408 Harrison Ave Unit 1346830P Cape Canaveral, FL | 1.0 | 1.0 | 947 | $4,114 | $4.34 | 18d | 1 | 0.41mi |
| 150 Intrepid Way Unit 8D Cape Canaveral, FL | 1.0 | 1.5 | 737 | $1,550 | $2.10 | 23d | 1 | 0.42mi |
| 467 Jackson Ave Unit Back Unit Cape Canaveral, FL | 1.0 | 1.0 | 528 | $1,500 | $2.84 | 23d | 1 | 0.44mi |
| 220 Cape Shores Cir Unit 12B Cape Canaveral, FL | 2.0 | 2.0 | 1034 | $1,650 | $1.60 | 14d | 1 | 0.46mi |
| 7801 Ridgewood Ave Cape Canaveral, FL | 1.0–3.0 | 1.0–2.0 | 893 | $1,850 | $2.07 | 21d | 3 | 0.47mi |
| 401 Monroe Ave Unit C201 Cape Canaveral, FL | 2.0 | 1.0 | 828 | $1,650 | $1.99 | 23d | 1 | 0.47mi |
| 230 Cape Shores Cir Unit 17G Cape Canaveral, FL | 2.0 | 2.0 | 1034 | $1,950 | $1.89 | 18d | 1 | 0.48mi |
| 300 Monroe Ave #21 Cape Canaveral, FL | 1.0 | 1.0 | 608 | $1,500 | $2.47 | 14d | 1 | 0.50mi |
| 135 Roosevelt Ave Unit A Cocoa Beach, FL | 2.0 | 1.0 | 730 | $1,550 | $2.12 | 23d | 1 | 0.53mi |
| 411 Madison Ave Unit N202 Cape Canaveral, FL | 1.0 | 1.0 | 672 | $1,650 | $2.46 | 23d | 1 | 0.53mi |
| 419 Madison Ave Unit 102 Cape Canaveral, FL | 1.0 | 1.0 | 672 | $1,450 | $2.16 | 23d | 1 | 0.54mi |
| 120 Madison Ave Cape Canaveral, FL | 2.0 | 2.5 | 1080 | $2,800 | $2.59 | 23d | 1 | 0.58mi |
| 201 International Dr #653 Cape Canaveral, FL | 2.0 | 2.0 | 1050 | $2,400 | $2.29 | 23d | 1 | 0.59mi |
| 411 Jefferson Ave Cape Canaveral, FL | 2.0 | 1.0 | 780 | $1,700 | $2.18 | 23d | 1 | 0.59mi |
| 523 Jefferson Ave Cape Canaveral, FL | 1.0 | 1.0 | 1000 | $2,300 | $2.30 | 23d | 1 | 0.62mi |
| 200 International Dr #510 Cape Canaveral, FL | 2.0 | 2.0 | 1023 | $2,000 | $1.96 | 23d | 1 | 0.64mi |
| 200 International Dr Unit CANB51 Cape Canaveral, FL | 2.0 | 2.0 | 1023 | $2,100 | $2.05 | 14d | 1 | 0.64mi |
| 610 Jefferson Ave Cape Canaveral, FL | 1.0 | 1.0 | 619 | $2,000 | $3.23 | 18d | 2 | 0.67mi |
| 610 Jefferson Ave Cape Canaveral, FL | 1.0 | 1.0 | 619 | $2,000 | $3.23 | 23d | 3 | 0.67mi |
| 128 Adams Ave Unit 1 Cape Canaveral, FL | 2.0 | 1.0 | 663 | $1,500 | $2.26 | 14d | 1 | 0.68mi |
| 8154 Ridgewood Ave Cape Canaveral, FL | 2.0 | 2.0 | 1104 | $2,500 | $2.26 | 23d | 1 | 0.69mi |
| 211 Caroline St Cape Canaveral, FL | 2.0 | 1.0 | 705 | $1,545 | $2.19 | 23d | 1 | 0.75mi |
HOA detail condo
- Monthly dues
- $478 · $5,736/yr
- Likely covers
- parking
- Assessments
- None detected in remarks — confirm with the listing agent.
Listing history 18 events
-
2026-06-18days on market $149,900 Active 85 DOM
-
2026-06-17days on market $149,900 Active 84 DOM
-
2026-06-16days on market $149,900 Active 83 DOM
-
2026-06-15days on market $149,900 Active 82 DOM
-
2026-06-14days on market $149,900 Active 80 DOM
-
2026-06-10days on market $149,900 Active 77 DOM
-
2026-06-08days on market $149,900 Active 75 DOM
-
2026-06-07days on market $149,900 Active 74 DOM
-
2026-06-05days on market $149,900 Active 71 DOM
-
2026-06-03days on market $149,900 Active 70 DOM
-
2026-06-02days on market $149,900 Active 69 DOM
-
2026-06-01days on market $149,900 Active 68 DOM
-
2026-05-31days on market $149,900 Active 67 DOM
-
2026-05-31days on market $149,900 Active 66 DOM
-
2026-04-01status Active
-
2026-02-25status Pending
-
2026-02-18$149,900 Active
-
1979-11-01soldstatus $28,000
ⓘ Source: listings_history table (triggers on properties + properties_extension) + one-shot
backfill from property_details.listing_events for pre-trigger history.
Tax reassessment forecast FL · Resets to sale price
- Current annual tax
- $2,025 · $169/mo
- Projected year-2 tax
- $2,025 · $169/mo
- Expected delta
- $0/yr ($0/mo · 0.0%)
ⓘ Screening estimate from a state-policy table — verify with the county assessor before closing.
Climate risk First Street
- Flood 7/10 Severe FEMA zone AO · 75% chance over 30 yrs
- Wildfire 1/10 Low
- Heat 10/10 Extreme 7 d/yr ≥105°F today · 24 d/yr by 30 yrs out
- Wind 10/10 Extreme 99% chance of damaging wind over 30 yrs
- Air quality 1/10 Low 0 unhealthy d/yr today · 0 by 30 yrs out
Nearby sold comps map
Loading sold comps map…
Walkable amenities ~0.75 mi
Loading nearby amenities…
Taxation est. · year 1
- Rental income
- $22,818
- − Mortgage interest
- −$8,397
- − Property taxes
- −$2,025
- − Insurance
- −$2,217
- − Repairs & maintenance
- −$1,825
- − Management
- −$1,825
- − HOA
- −$5,736
- − Depreciation
- −$4,361
- Taxable loss
- −$3,568
- Est. tax savings @ 24.0%
- +$856
- After-tax cash flow
- $-529/yr
For passive investors: Depreciation is non-cash, so a rental often shows a tax loss while cash-flowing — sheltering income. Rental losses are passive: they offset passive income freely, and up to $25,000/yr can offset ordinary (W-2) income if you actively participate and your MAGI is under $100k (phasing out to $0 by $150k); unused losses carry forward. On sale, claimed depreciation is recaptured at up to 25%, and gains may owe capital-gains tax (a 1031 exchange can defer both). Figures are a year-1 estimate at your 24.0% rate — not tax advice; consult a CPA.
Schools (NCES district)
- District
- Brevard
- NCES district ID
- 1200150
- Math proficiency
- 53% ▼ -9.00%
- Reading proficiency
- 57% ▼ -4.00%
- Median HH income
- $49,426
- Composite
- 46.86/100
- National rank
- #2370
- State rank
- #19 of 73 in FL
Livability — Cape Canaveral
- Score
- 84/100
- State rank
- #34
- US rank
- #677
Category grades
Schools grade is shown separately in the Schools card above.
Census & demographics
- Census place
- Cape Canaveral, FL
- County
- Brevard County · 602,871 people
- City population
- 10,005
- Metro
- Palm Bay-Melbourne-Titusville, FL
- Population (ZIP)
- 10,005
- Household income
- $66,955
- Rent vs Own
- Severe rent burden
- 477.0
Population outlook (Brevard County) Hauer SSP2
- Today (2025)
- 623,254 people
- By 2030
- 648,420 · +4.0%
- By 2040
- 690,009 · +10.7%
- By 2050
- 715,669 · +14.8%
- By 2075
- 775,744 · +24.5%
- By 2100
- 776,687 · +24.6%
Race, ethnicity, and origin ACS 2023
- Neighborhood character
- Predominantly White (86%)
- Race & ethnicity
- White 86% Hispanic / Latino 9% Two or more races 4%
- Hispanic origin (detail)
- Mexican 1% Puerto Rican 6%
- Common ancestry
- Romanian 5% Lithuanian 5% Serbian 2%
- Foreign-born
- 6% · Canada
- Languages at home
- 93% English-only · Spanish 4% Russian/Polish/Slavic 1% German/W. Germanic 1%
Political lean MEDSL · Brevard
- 2024 margin
- Strong R (+20.8) · D 39.1% · R 59.9% · Other 1.0%
- 2008→2024 swing
- -10.4pp toward R · 2008: -10.4pp · 2024: -20.8pp
- All cycles
- 2024: R+20.8 2020: R+16.4 2016: R+19.8 2012: R+12.7 2008: R+10.4
Not yet ingested
- Civics
- —
Market trends
- HPI YoY
- ▼ -125.71%
- Current HPI
- 300.9707
- Rent YoY
- ▲ 4.02%
- Metro
- Palm Bay-Melbourne-Titusville, FL
- State GDP YoY
- ▲ 3.28%
- F500 in state
- 36
Industry mix (Fortune 500 HQ in FL)
| Industry | F500 HQs | Revenue |
|---|---|---|
| Industrial Technology | 2 | $29B |
|
||
| Insurance | 2 | $17B |
|
||
| Retail | 1 | $60B |
|
||
| Technology Distribution | 1 | $58B |
|
||
| Homebuilding | 1 | $35B |
|
||
| Technology Manufacturing | 1 | $35B |
|
||
Price history
+435.4% since first listed4 events — show timeline
- 2026-04-01 Relisted — SCMLS
- 2026-02-25 Pending — SCMLS
- 2026-02-18 Listed $149,900 SCMLS
- 1979-11-01 Sold (Public Records) $28,000 Public Records
Property tax history
+9.0%/yrLatest (2025): $2,025 · +4.7% YoY. Source: county tax records.
Cash-flow waterfall
monthlySold comps — $/sqft
last 12 mo · ≤1 miLoading sold comps…