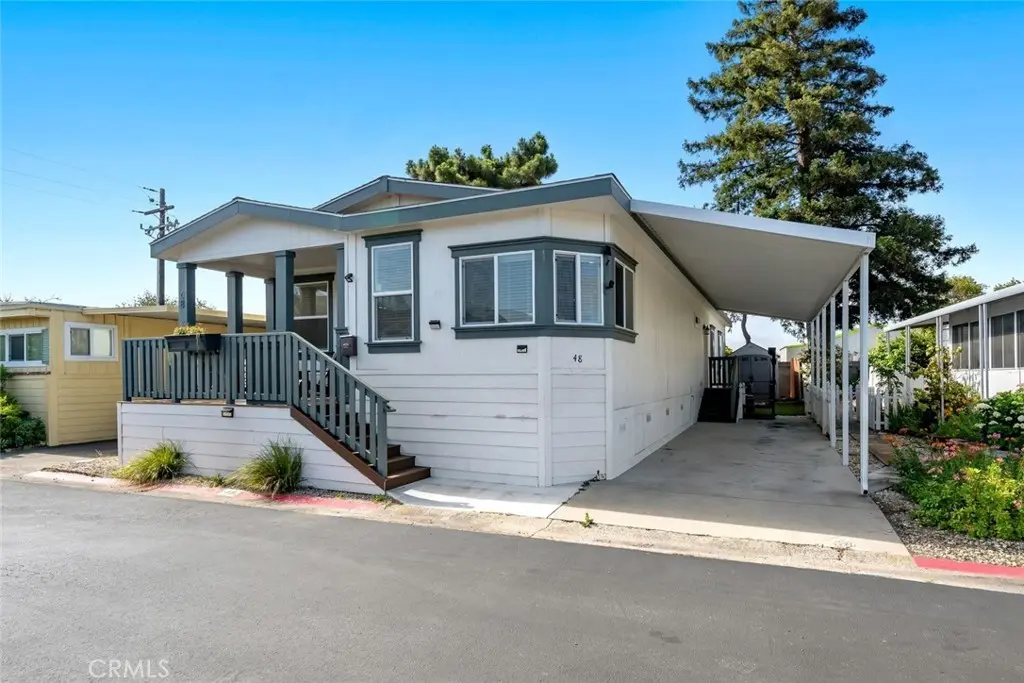
3395 S Higuera #48 · San Luis Obispo, CA
Flood risk 6/10 · Moderate
- FEMA flood zone
- X (unshaded)
- Chance of flooding over 30 yrs
- 0.68%
- Est. flood insurance / yr
- $507 – $1,088
Fire risk 6/10 · Moderate
- Est. fire insurance / yr
- $659 – $1,223
Heat risk 4/10 · Minor
- Hot days now (above 82°F)
- 4 days/yr
- Hot days in 30 yrs
- 10 days/yr
Wind risk 1/10 · Minimal
- Chance of severe wind over 30 yrs
- —
Air-quality risk 6/10 · Moderate
- Unhealthy air days now
- 11 days/yr
- Unhealthy air days in 30 yrs
- 11 days/yr
Risk factors via First Street. Map © Google.
Why this score? — see what drove the B- grade
The composite is a weighted blend of 9 inputs, each scored 0–100. Each bar is that input's sub-score; the figure is the points it added to the 100-point composite (weight × sub-score).
- Cash flow +24.3/30.0
- ARV discount +14.2/15.0
- DSCR +7.8/10.0
- 1% rule +5.4/10.0
- Schools +4.6/10.0
- Condition / age +4.0/5.0
- Livability +3.7/5.0
- Rent growth +3.6/5.0
- Appreciation +0.0/10.0
$415,000
🖨 Deal sheet 📄 Offer letter ✓ Due diligence
Listing remarks
Welcome to Rancho San Luis Mobile Estates, a welcoming 55+ community offering comfort and convenience. This beautifully updated home offers approximately 1,740 sq. ft. of bright, open living space with two spacious bedrooms, each with its own full bathroom, plus a third full guest bath. The open-concept layout features a stylish kitchen with marble countertops, white cabinetry, a large island, and a walk-in pantry, flowing seamlessly into the living and dining areas—perfect for everyday living and entertaining. A dedicated laundry room adds everyday convenience. The primary suite offers a spa-like retreat with a walk-in shower and relaxing freestanding tub. Enjoy time outdoors on the
Key facts
- Front deck
- Stylish kitchen
- Updated home
Tags
Property features AI
Finance
- Other: Rent includes trash, pool, water and sewer
- Financial info: Land lease amount is charged monthly
- HOA & community: Senior community; Park: Rancho Mobile Estates; Community amenities include biking, hiking, and mountainous surroundings; Land lease (park) with monthly fee
Exterior
- Parking: Concrete driveway; On-site parking; Attached carport (1 space); RV access/parking and RV potential; One total parking space / pad
- Security: Carbon monoxide detector(s); Smoke detector(s)
- Utilities: Public/district water; Public sewer; Electricity connected; Sewer connected; Water connected; Cable available; Telephone in street; Natural gas available
- Home design: Mobile home (model: Sun RID); One story; Entry at level 1
- Construction: Shingle roof; Pier jacks foundation; Year built per assessor
- Exterior features: Front porch; Porch; Patio; Shed (1); Fiberglass skirting; Association pool; Paved lot; Rectangular lot shape; North-facing; Has a view; Elevator; Grab bars in bathroom(s)
Interior
- Kitchen: Kitchen open to family room; Quartz counters; Kitchen island; Walk-in pantry; 6-burner stove; Gas cooktop; Gas range; Gas oven; Dishwasher; Microwave; Refrigerator; Water heater unit
- Bedrooms: Primary bedroom on the main floor; Walk-in closet
- Flooring: Laminate flooring
- Bathrooms: Three full bathrooms; Soaking tub; Separate tub and shower; Bathtub and shower(s); Main floor full bath
- Heating & cooling: Central cooling; Central furnace; Fireplace
- Interior features: Built-in shelving/cabinetry; Ceiling fan(s); Pantry; Open floor plan; Granite counters; Insulated windows with screens; Carbon monoxide and smoke detectors
- Laundry & utility: Individual laundry room; Gas and electric dryer hookups
Neighborhood map
What this means for you Summary
Snapshot
- This is a 3-bed/3.0-bath manufactured listed at $415k. Condition is rated good.
Deal economics
- At list price, monthly cash flow is $836 ($10k/yr) — positive.
- The deal already cash-flows at list — no discount required.
- Meets the 1% rule at list price ($4k rent vs $415k).
- Recommended offer: $403k (3.0% below list) — sets the bar for market timing.
- Cap rate 8.7% vs local median 2.1% in San Luis Obispo — top-decile yield for the area; either an underpriced asset or a hidden risk that comps aren't pricing in. Stress-test before assuming the spread holds.
Location & tenants
- Location reads 74/100 on livability (#132 in CA, #4,576 nationally) — a middle-class / working-renter tenant base. Strengths: amenities A+, commute A+, health & safety A+; Watch: crime F, cost of living F.
- San Luis Coastal Unified (urban): math 50% / reading 58% proficiency, ranked #118 of 517 in CA (top 23%) — acceptable for families but not a draw, mixed tenant base, ~2y average lease.
- Zoned schools: Hawthorne Elementary (math 42% / reading 47%, grade F, #496 of 1,571 statewide, top 34%, 430 students, 49% FRL); Laguna Middle (math 57% / reading 65%, grade B+, #57 of 498 statewide, top 12%, 789 students, 30% FRL); San Luis Obispo High (math 47% / reading 67%, grade C, #234 of 1,170 statewide, top 21%, 1,644 students, 27% FRL).
- Market conditions: Rents rising fast (+4.4%/yr); 143 active listings in the ZIP; 8 comparable units currently listed for rent nearby; rentals at typical pace (median 21d on market — plan ~3-4 weeks tenant-placement turnaround); solid renter incomes; 1,104 units permitted in San Luis Obispo County in 2024 (273 in 5+ unit buildings).
- At $4,310/mo this rent would consume 53% of the median local household income ($97k/yr) (locally 2050% of renters already pay >50% of income on rent) — very limited rent-growth headroom before tenants either downsize or default.
Forward outlook
- Local home prices are declining (-3.0%/yr); year-one equity from $3k of loan paydown is wiped out by about $12k of value loss. Plan a longer hold.
- San Luis Obispo County population projected at +20% by 2050 — long-run rental-demand tailwind backs the buy-and-hold thesis.
- At projected returns (-3.0% appreciation + 4.4% rent growth), your $116k cash investment doubles in ~10 years — after that, you're playing with house money.
Negotiation context
- It's been on market 31 days — a 3% lower offer ($403k) is reasonable based on typical stale-listing flexibility.
- 2 sale attempts with the ask held roughly flat each time — persistent listings suggest the price (not the market) is what's stuck; bring a comps-based counter.
Risks & watch-outs
- Climate carrying-cost: major flood risk; major wildfire risk — expect insurance premiums to compound above CPI over the hold.
Questions for the listing agent
- It's been on market 31 days. Have you received any prior offers? Is the seller open to a 3% concession, seller financing, or rate buy-down credit?
- Is there a deadline driving the sale (1031 exchange, divorce, estate, relocation)? That informs how much negotiation room exists.
- Schools are B-rated — typically a magnet for longer-tenancy family renters. What's the average tenant stay here, and is there a school-zone premium baked into asking?
- Crime grade is F in this area — have there been break-ins, vandalism, or insurance claims at this property in the last 3 years? What carrier currently insures it and at what premium?
- What's the average days-on-market for RENTAL listings here right now (not sales)? A rising rental-DOM trend means longer vacancies and softer asking-rent achievability than the comps imply.
- What's the recent tenant-quality profile in this submarket — average credit score on applications, eviction rate, late-payment / NSF rate, and stable-employment percentage? A property-management company in the area should have these aggregated.
- How much new for-sale + rental construction is in the pipeline within 1–3 miles? Heavy new supply typically softens prices + rents 12–24 months out; constrained supply supports both.
Investment metrics
- 1% rule
- 1.04% ✓
- Cap rate
- 8.71%
- Cash-on-cash
- 8.64%
- DSCR
- 1.38
- GRM
- 8.0
CMA / ARV
- ARV (on-the-fly)
- $487,200
- Comps found
- 8
Show comp detail 8 sales within ~0.75 mi
| Address | Dist | Beds/Ba | Sqft | Sold | Price | $/sf | Match |
|---|---|---|---|---|---|---|---|
| 3057 S Higuera #189 | 0.35mi | 3/2.0 | 1,728 (-1%) | 7mo | $399,000 | $231 | 72 |
| 3395 S Higuera St S #11 | 0.01mi | 3/2.0 | 1,560 (-10%) | 9mo | $425,000 | $272 | 71 |
| 3395 S Higuera St #13 | 0.00mi | 3/2.0 | 1,602 (-8%) | 15mo | $340,000 | $212 | 70 |
| 3057 S Higuera St #90 | 0.26mi | 3/2.0 | 1,564 (-10%) | 8mo | $438,000 | $280 | 61 |
| 3057 S Higuera St #73 | 0.25mi | 2/2.0 (-1) | 1,536 (-12%) | 8mo | $430,000 | $280 | 53 |
| 3395 S Higuera St #43 | 0.00mi | 2/2.0 (-1) | 1,485 (-15%) | 23mo | $369,000 | $248 | 47 |
| 3960 Higuera S #158 | 0.69mi | 3/2.0 | 1,560 (-10%) | 8mo | $520,000 | $333 | 40 |
| 3057 S Higuera St #28 | 0.29mi | 2/2.0 (-1) | 1,488 (-14%) | 17mo | $422,000 | $284 | 39 |
Match score weights: distance 35% · size 25% · config 20% · recency 20%. Top-matched comps best support the ARV.
Projected returns pro-forma
-3.0% appreciation · 4.41% rent growth · sell at horizon
- IRR
- -1.8%
- Equity multiple
- 0.93×
- Total profit
- $-7,903
- Equity at exit
- $61,878
- IRR
- 9.2%
- Equity multiple
- 1.75×
- Total profit
- $87,407
- Equity at exit
- $35,882
Cash invested: $116,200 (down + closing). Projections, not guarantees.
Landlord ↔ Tenant lean methodology
- Overall (STATE)
- 18 Strongly Tenant-Friendly
- State California
- 18 Strongly Tenant-Friendly · D+13
- County
- — inherits STATE
- City
- — inherits STATE
ZIP-level market 93401
- Rents YoY
- 4.4%
- Active inventory
- 143
- Price-to-rent
- 8.0×
Monthly cashflow live
- Estimated rent
- $4,310 high interval (Pro) →
- Mortgage (P&I)
- −$2,176
- Tax from tax record
- −$220 /mo · $2,635/yr
- Insurance
- −$173
- HOA
- −$0
- Vacancy / Maint / Mgmt
- −$905
- Net cashflow
- $836
Break-even live
UW: 25.0% down · 7.5% · 30yr · 1.5% tax · 5.0% vac · 8.0% maint · 8.0% mgmt
Financing live
Cash to close
- Down payment
- $103,750
- Closing costs
- $12,450
- Reserves months
- —
- Total cash needed
- —
Loan-product check · same deal, 3 products live
Conventional
25% down · 7.5% · 30yr
- Down + closing
- —
- Monthly P&I
- —
- Monthly cashflow
- —
- DSCR
- —
- Eligible?
- —
Personal DTI + credit; lowest rate.
DSCR
20% down · 8.5% · 30yr
- Down + closing
- —
- Monthly P&I
- —
- Monthly cashflow
- —
- DSCR
- —
- Eligible?
- —
No personal income docs; deal must DSCR.
Hard money
10% down · 12.0% · 12mo
- Down + closing
- —
- Monthly P&I
- —
- Monthly cashflow
- —
- DSCR
- —
- Eligible?
- —
Short-term bridge; refi at stabilization.
Rent comps 8 comps
| Address | Beds | Baths | Sqft | Rent | $/sqft | DOM | Units | Dist |
|---|---|---|---|---|---|---|---|---|
| 3070 Lucca Ln San Luis Obispo, CA | 3.0 | 3.0 | 1740 | $5,000 | $2.87 | 21d | 1 | 0.35mi |
| 1824 Homestead Pl San Luis Obispo, CA | 4.0 | 3.5 | 1869 | $5,300 | $2.84 | 43d | 1 | 0.78mi |
| 905 Madonna Rd San Luis Obispo, CA | 3.0 | 3.0–3.5 | 1459 | $4,825 | $3.31 | 13d | 2 | 0.91mi |
| 915 Madonna Rd #102 San Luis Obispo, CA | 3.0 | 2.0 | 1141 | $1,685 | $1.48 | 43d | 1 | 0.93mi |
| 925 Madonna Rd #302 San Luis Obispo, CA | 3.0 | 2.0 | 1075 | $3,500 | $3.26 | 21d | 1 | 0.94mi |
| 3335 Broad St #18 San Luis Obispo, CA | 2.0 | 1.5 | 1190 | $2,900 | $2.44 | 13d | 1 | 1.05mi |
| 3219 Fennel Ln #105 San Luis Obispo, CA | 3.0 | 4.0 | 1873 | $1,450 | $0.77 | 43d | 1 | 1.21mi |
| 1704 Tonini Dr San Luis Obispo, CA | 1.0–2.0 | 1.0–2.5 | 985 | $3,445 | $3.50 | 13d | 3 | 1.38mi |
Listing history 19 events
-
2026-06-18days on market $415,000 Active 31 DOM
-
2026-06-17days on market $415,000 Active 30 DOM
-
2026-06-16days on market $415,000 Active 29 DOM
-
2026-06-15days on market $415,000 Active 28 DOM
-
2026-06-14days on market $415,000 Active 26 DOM
-
2026-06-13days on market $415,000 Active 25 DOM
-
2026-06-10days on market $415,000 Active 23 DOM
-
2026-06-09days on market $415,000 Active 22 DOM
-
2026-06-08days on market $415,000 Active 21 DOM
-
2026-06-07days on market $415,000 Active 20 DOM
-
2026-06-03days on market $415,000 Active 16 DOM
-
2026-06-02days on market $415,000 Active 15 DOM
-
2026-06-01days on market $415,000 Active 14 DOM
-
2026-05-31days on market $415,000 Active 13 DOM
-
2026-05-30days on market $415,000 Active 12 DOM
-
2026-05-18$415,000 Active
-
2026-04-30historical
-
2026-04-03price
-
2026-01-01Active
ⓘ Source: listings_history table (triggers on properties + properties_extension) + one-shot
backfill from property_details.listing_events for pre-trigger history.
Tax reassessment forecast CA · Resets to sale price
- Current annual tax
- $2,635 · $220/mo
- Projected year-2 tax
- $3,154 · $263/mo
- Expected delta
- +$519/yr (+$43/mo · 19.7%)
ⓘ Screening estimate from a state-policy table — verify with the county assessor before closing.
Climate risk First Street
- Flood 6/10 Major FEMA zone X (unshaded) · 68% chance over 30 yrs
- Wildfire 6/10 Major
- Heat 4/10 Moderate 4 d/yr ≥82°F today · 10 d/yr by 30 yrs out
- Wind 1/10 Low
- Air quality 6/10 Major 11 unhealthy d/yr today · 11 by 30 yrs out
Nearby sold comps map
Loading sold comps map…
Walkable amenities ~0.75 mi
Loading nearby amenities…
Taxation est. · year 1
- Rental income
- $51,722
- − Mortgage interest
- −$23,246
- − Property taxes
- −$2,635
- − Insurance
- −$2,075
- − Repairs & maintenance
- −$4,138
- − Management
- −$4,138
- − Depreciation
- −$12,073
- Taxable income
- $3,418
- Est. tax owed @ 24.0%
- −$820
- After-tax cash flow
- $9,215/yr
For passive investors: Depreciation is non-cash, so a rental often shows a tax loss while cash-flowing — sheltering income. Rental losses are passive: they offset passive income freely, and up to $25,000/yr can offset ordinary (W-2) income if you actively participate and your MAGI is under $100k (phasing out to $0 by $150k); unused losses carry forward. On sale, claimed depreciation is recaptured at up to 25%, and gains may owe capital-gains tax (a 1031 exchange can defer both). Figures are a year-1 estimate at your 24.0% rate — not tax advice; consult a CPA.
Condition & rehab AI · 12 photos
This beautifully updated mobile home in Rancho San Luis Mobile Estates offers a modern, open-concept layout with good condition and minimal repairs needed. It's move-in ready with potential for further value increases through exterior painting and landscaping.
Value-add opportunities
- Both Painting exterior — Enhances curb appeal and value
- Both Landscaping — Improves curb appeal and rental value
- Both Add smart home features — Enhances convenience and marketability
Renovation cost estimate screening
Value-add ROI direction
- Both Painting exterior — Enhances curb appeal and value ↑
- Both Landscaping — Improves curb appeal and rental value ↑
- Both Add smart home features — Enhances convenience and marketability ↑
ⓘ Cost ranges are severity-bucket heuristics (US national rule-of-thumb). Get contractor quotes + a written scope before underwriting a rehab budget.
Schools (NCES district)
- District
- San Luis Coastal Unified
- NCES district ID
- 0634800
- Math proficiency
- 50% ▼ -14.00%
- Reading proficiency
- 58% ▼ -12.00%
- Median HH income
- $53,428
- Composite
- 46.4/100
- National rank
- #2455
- State rank
- #118 of 517 in CA
Livability — San Luis Obispo
- Score
- 74/100
- State rank
- #132
- US rank
- #4576
Category grades
Schools grade is shown separately in the Schools card above.
Census & demographics
- Census place
- San Luis Obispo, CA
- County
- San Luis Obispo County · 224,651 people
- City population
- 54,204
- Metro
- San Luis Obispo-Paso Robles, CA
- Population (ZIP)
- 29,202
- Household income
- $96,824
- Rent vs Own
- Severe rent burden
- 2050.0
Population outlook (San Luis Obispo County) Hauer SSP2
- Today (2025)
- 306,977 people
- By 2030
- 320,378 · +4.4%
- By 2040
- 343,933 · +12.0%
- By 2050
- 366,853 · +19.5%
- By 2075
- 428,329 · +39.5%
- By 2100
- 460,687 · +50.1%
Race, ethnicity, and origin ACS 2023
- Neighborhood character
- Predominantly White (71%)
- Race & ethnicity
- White 71% Hispanic / Latino 18% Two or more races 12% Asian 4% Black 2%
- Hispanic origin (detail)
- Mexican 14%
- Common ancestry
- Lithuanian 4% Italian 3% Portuguese 3%
- Foreign-born
- 9% · Canada, China, South Korea
- Languages at home
- 84% English-only · Spanish 10% Chinese 1% Other Asian/Pacific 1%
Political lean MEDSL · San Luis Obispo
- 2024 margin
- D (+10.9) · D 53.9% · R 43.1% · Other 3.0%
- 2008→2024 swing
- +5.5pp toward D · 2008: 5.4pp · 2024: 10.9pp
- All cycles
- 2024: D+10.9 2020: D+13.1 2016: D+8.3 2012: D+1.0 2008: D+5.4
Not yet ingested
- Civics
- —
Market trends
- HPI YoY
- ▼ -796.84%
- Current HPI
- 359.9248
- Rent YoY
- ▲ 4.41%
- Metro
- San Luis Obispo-Paso Robles, CA
- State GDP YoY
- ▲ 3.21%
- F500 in state
- 116
Industry mix (Fortune 500 HQ in CA)
| Industry | F500 HQs | Revenue |
|---|---|---|
| Technology | 27 | $1,492B |
|
||
| Financial Services | 3 | $174B |
|
||
| Retail | 3 | $44B |
|
||
| Insurance | 3 | $26B |
|
||
| Media / Entertainment | 2 | $115B |
|
||
| Pharmaceuticals / Biotech | 2 | $62B |
|
||
Price history
4 events — show timeline
- 2026-05-18 Listed $415,000 CRMLS
- 2026-04-30 Listing Removed — bridgeMLS, Bay East AOR, or Contra Costa AOR
- 2026-04-03 Price Changed — bridgeMLS, Bay East AOR, or Contra Costa AOR
- 2026-01-01 Listed — bridgeMLS, Bay East AOR, or Contra Costa AOR
Cash-flow waterfall
monthlySold comps — $/sqft
last 12 mo · ≤1 miLoading sold comps…