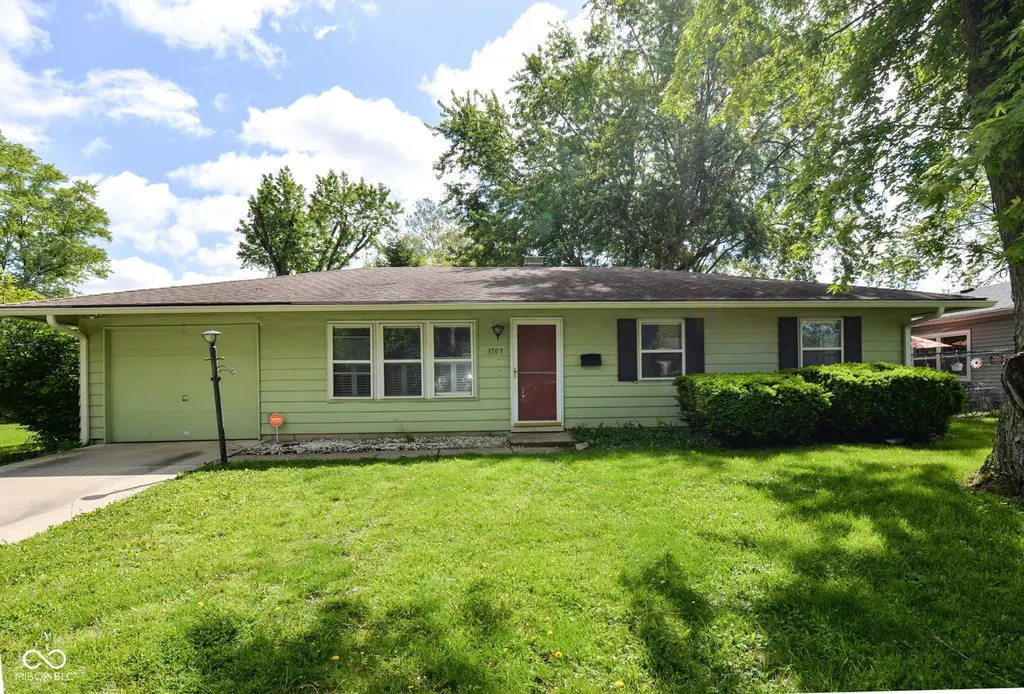
3509 N Mitchner Ave · Indianapolis city (balance), IN
Flood risk 6/10 · Moderate
- FEMA flood zone
- X (unshaded)
- Chance of flooding over 30 yrs
- 0.68%
- Est. flood insurance / yr
- $507 – $1,088
Fire risk 1/10 · Minimal
- Est. fire insurance / yr
- $717 – $1,331
Heat risk 3/10 · Minor
- Hot days now (above 101°F)
- 7 days/yr
- Hot days in 30 yrs
- 18 days/yr
Wind risk 2/10 · Minimal
- Chance of severe wind over 30 yrs
- 0.0%
Air-quality risk 3/10 · Minor
- Unhealthy air days now
- 3 days/yr
- Unhealthy air days in 30 yrs
- 4 days/yr
Risk factors via First Street. Map © Google.
Why this score? — see what drove the C grade
The composite is a weighted blend of 9 inputs, each scored 0–100. Each bar is that input's sub-score; the figure is the points it added to the 100-point composite (weight × sub-score).
- Cash flow +21.0/30.0
- ARV discount +14.2/15.0
- DSCR +6.7/10.0
- 1% rule +4.9/10.0
- Rent growth +4.2/5.0
- Livability +2.5/5.0
- Condition / age +2.5/5.0
- Schools +1.4/10.0
- Appreciation +0.0/10.0
$144,900
🖨 Deal sheet (PDF) 📄 Offer letter ✓ Due diligence
Listing remarks MLS
Unbelievable value on this well-maintained 3 Bed Ranch with no HOA in established neighborhood with mature trees! Easy interstate access & close to Fort Benjamin Harrison State Park. Updates include vinyl windows, water heater (2016) & A/C & coil (2015). Large bathroom has been updated with beadboard wainscoting & vinyl flooring. Great floorplan with spacious Living Room and Kitchen/Dining Room combo. Entertain on the back deck/stone patio area or the large fully fenced backyard, with storage shed. This home is ready for a few cosmetic updates, so bring your vision!
Key facts
- Attached garage
- Extensive storage
- Private yard
Tags
Property features AI
Exterior
- Parking: Attached garage (1 car); Approximately 250 sq ft garage; Guest street parking
- Security: Smoke alarm
- Utilities: Public water; Municipal sewer connected; No solid waste service listed
- Home design: Single-family residence; One story
- Construction: Aluminum siding; Slab foundation; Built as a one-level home
- Exterior features: Storage space; Full privacy fence; Mature trees; Sidewalks; Suburban setting; Has a view
Interior
- Kitchen: Dishwasher; Microwave; Gas oven; Eat-in kitchen
- Bedrooms: Three bedrooms, all on the main level
- Flooring: Luxury vinyl plank throughout main living areas
- Bathrooms: One full bathroom
- Heating & cooling: Forced air heating (natural gas); Central air conditioning
- Interior features: Attic with pull-down stairs; Eat-in kitchen; Utility room; Smoke alarm
- Laundry & utility: Utility room
Neighborhood map
What this means for you Summary
Snapshot
- This is a 3-bed/1.0-bath single-family listed at $145k.
Deal economics
- At list price, monthly cash flow is $205 ($2k/yr) — positive.
- The deal already cash-flows at list — no discount required.
- To meet the 1% rule (rent ≥ 1% of price), the offer needs to be $143k (1.0% below list).
- Recommended offer: $141k (3.0% below list) — sets the bar for market timing.
- Cap rate 8.0% vs local median 4.4% in Indianapolis city (balance) — top-decile yield for the area; either an underpriced asset or a hidden risk that comps aren't pricing in. Stress-test before assuming the spread holds.
Location & tenants
- Location reads: area grade C — affects rentability + tenant quality, not the cash-flow math above.
- Indianapolis Public Schools (urban): math 14% / reading 20% proficiency, ranked #286 of 301 in IN (top 95%) — low school quality limits family demand, transient renter base, plan for 1-2y turnover; 77% free/reduced lunch — lower-income household profile, screen leases tightly.
- Zoned schools: Center For Inquiry School 27 (math 25% / reading 29%, grade F, #737 of 994 statewide, top 76%, 525 students, 51% FRL); H L Harshman Middle School (math 3% / reading 16%, grade F, #316 of 330 statewide, top 96%, 549 students, 84% FRL).
- Market conditions: Rents rising fast (+6.8%/yr); 153 active listings in the ZIP; 34 comparable units currently listed for rent nearby; rentals at typical pace (median 20d on market — plan ~3-4 weeks tenant-placement turnaround); 1,906 units permitted in Marion County in 2024 (621 in 5+ unit buildings).
- This rent runs 34% of the median local income ($50k/yr) — at the standard rent-burdened threshold; future hikes will face affordability resistance.
Forward outlook
- Local home prices are declining (-3.0%/yr); year-one equity from $1k of loan paydown is wiped out by about $4k of value loss. Plan a longer hold.
- Marion County population projected at +18% by 2050 — long-run rental-demand tailwind backs the buy-and-hold thesis.
- At projected returns (-3.0% appreciation + 6.8% rent growth), your $41k cash investment doubles in ~10 years — after that, you're playing with house money.
Negotiation context
- It's been on market 39 days — a 3% lower offer ($141k) is reasonable based on typical stale-listing flexibility.
- 3 sale attempts since 6y ago; this cycle's ask has dropped $30k (17%) from the opening price — seller is motivated, your offer sets the floor, not the list.
- Current owner paid $89k; list at $145k implies a 63% gain — meaningful room to come down on a strong offer.
Risks & watch-outs
- Climate carrying-cost: major flood risk — expect insurance premiums to compound above CPI over the hold.
Questions for the listing agent
- It's been on market 39 days. Have you received any prior offers? Is the seller open to a 3% concession, seller financing, or rate buy-down credit?
- Built in 1960 — when were the roof, HVAC, electrical panel, plumbing, and water heater last replaced?
- Is there a deadline driving the sale (1031 exchange, divorce, estate, relocation)? That informs how much negotiation room exists.
- What's the average days-on-market for RENTAL listings here right now (not sales)? A rising rental-DOM trend means longer vacancies and softer asking-rent achievability than the comps imply.
- What's the recent tenant-quality profile in this submarket — average credit score on applications, eviction rate, late-payment / NSF rate, and stable-employment percentage? A property-management company in the area should have these aggregated.
- How much new for-sale + rental construction is in the pipeline within 1–3 miles? Heavy new supply typically softens prices + rents 12–24 months out; constrained supply supports both.
Investment metrics
- 1% rule
- 0.99% ✗
- Cap rate
- 7.99%
- Cash-on-cash
- 6.05%
- DSCR
- 1.27
- GRM
- 8.4
CMA / ARV
- ARV (median comp)
- $170,076
- List price
- $144,900
- Delta
- -14.80%
- Verdict
- UNDERPRICED
- Comps
- 20 within 1.0 mi
Show comp detail 12 sales within ~0.75 mi
| Address | Dist | Beds/Ba | Sqft | Sold | Price | $/sf | Match |
|---|---|---|---|---|---|---|---|
| 7533 Placing Rd | 0.03mi | 3/1.0 | 1,216 (+1%) | 8mo | $115,000 | $95 | 91 |
| 7617 E 35th St | 0.08mi | 3/1.5 | 1,216 (+1%) | 8mo | $100,000 | $82 | 87 |
| 7628 E 34th Pl | 0.11mi | 4/1.5 (+1) | 1,216 (+1%) | 2mo | $177,959 | $146 | 85 |
| 7233 E 34th Pl | 0.31mi | 3/1.0 | 1,181 (-2%) | 0mo | $148,000 | $125 | 82 |
| 7528 Placing Rd | 0.05mi | 3/1.5 | 1,248 (+4%) | 10mo | $153,000 | $123 | 82 |
| 7525 Ruskin Pl | 0.29mi | 3/1.5 | 1,246 (+3%) | 5mo | $155,000 | $124 | 75 |
| 7933 E 34th St | 0.41mi | 3/1.5 | 1,216 (+1%) | 3mo | $189,900 | $156 | 75 |
| 7250 E 34th Pl | 0.29mi | 4/1.0 (+1) | 1,305 (+8%) | 5mo | $170,000 | $130 | 63 |
| 8315 E 36th Pl | 0.73mi | 3/2.0 | 1,181 (-2%) | 10mo | $207,000 | $175 | 50 |
| 3733 Harvest Ave | 0.75mi | 3/1.0 | 1,055 (-12%) | 7mo | $119,500 | $113 | 38 |
| 8138 E 34th Pl | 0.59mi | 2/1.0 (-1) | 1,025 (-15%) | 5mo | $145,000 | $141 | 38 |
| 3525 Lombardy Pl | 0.75mi | 4/2.0 (+1) | 1,047 (-13%) | 7mo | $180,000 | $172 | 28 |
Match score weights: distance 35% · size 25% · config 20% · recency 20%. Top-matched comps best support the ARV.
Projected returns pro-forma
-3.0% appreciation · 6.76% rent growth · sell at horizon
- IRR
- -3.1%
- Equity multiple
- 0.88×
- Total profit
- $-4,841
- Equity at exit
- $21,605
- IRR
- 10.2%
- Equity multiple
- 1.92×
- Total profit
- $37,434
- Equity at exit
- $12,528
Cash invested: $40,572 (down + closing). Projections, not guarantees.
Landlord ↔ Tenant lean methodology
- Overall (STATE)
- 90 Strongly Landlord-Friendly
- State Indiana
- 90 Strongly Landlord-Friendly · R+11
- County
- — inherits STATE
- City
- — inherits STATE
ZIP-level market 46226
- Rents YoY
- 6.8%
- Active inventory
- 153
- Price-to-rent
- 8.4×
Monthly cashflow live
- Estimated rent
- $1,434 high interval (Pro) →
- Mortgage (P&I)
- −$760
- Tax from tax record
- −$108 /mo · $1,296/yr
- Insurance
- −$60
- HOA
- −$0
- Vacancy / Maint / Mgmt
- −$301
- Net cashflow
- $205
Break-even live
Sensitivity live
| Price | -10% $287 | -5% $246 | +0% $205 | +5% $164 | +10% $123 |
|---|---|---|---|---|---|
| Rent | -10% $91 | -5% $148 | +0% $205 | +5% $261 | +10% $318 |
| Rate | -1.0pp $278 | -0.5pp $241 | base $205 | +0.5pp $167 | +1.0pp $129 |
UW: 25.0% down · 7.5% · 30yr · 1.5% tax · 5.0% vac · 8.0% maint · 8.0% mgmt
Financing live
Cash to close
- Down payment
- $36,225
- Closing costs
- $4,347
- Reserves months
- —
- Total cash needed
- —
Loan-product check · same deal, 3 products live
Conventional
25% down · 7.5% · 30yr
- Down + closing
- —
- Monthly P&I
- —
- Monthly cashflow
- —
- DSCR
- —
- Eligible?
- —
Personal DTI + credit; lowest rate.
DSCR
20% down · 8.5% · 30yr
- Down + closing
- —
- Monthly P&I
- —
- Monthly cashflow
- —
- DSCR
- —
- Eligible?
- —
No personal income docs; deal must DSCR.
Hard money
10% down · 12.0% · 12mo
- Down + closing
- —
- Monthly P&I
- —
- Monthly cashflow
- —
- DSCR
- —
- Eligible?
- —
Short-term bridge; refi at stabilization.
Rent comps 34 comps
| Address | Beds | Baths | Sqft | Rent | $/sqft | DOM | Units | Dist |
|---|---|---|---|---|---|---|---|---|
| 7531 Penway St Indianapolis, IN | 3.0 | 1.5 | 1237 | $1,551 | $1.25 | 9d | 1 | 0.22mi |
| 3416 N Hartman Dr Indianapolis, IN | 3.0 | 1.0 | 1421 | $1,300 | $0.91 | 0d | 1 | 0.29mi |
| 3513 Roseway Dr Indianapolis, IN | 3.0 | 2.0 | 1216 | $1,600 | $1.32 | 19d | 1 | 0.41mi |
| 7171 Twin Oaks Dr Indianapolis, IN | 3.0 | 1.0–1.5 | 801 | $1,399 | $1.75 | 25d | 9 | 0.42mi |
| 7937 E 34th St Indianapolis, IN | 4.0 | 1.0 | 1450 | $2,000 | $1.38 | 25d | 1 | 0.43mi |
| 7838 Ridgewood Dr Indianapolis, IN | 3.0 | 2.0 | 936 | $1,540 | $1.65 | 45d | 1 | 0.43mi |
| 7838 Ridgewood Dr Indianapolis, IN | 3.0 | 2.0 | 936 | $1,540 | $1.65 | 25d | 1 | 0.43mi |
| 3226 Wellington Ave Indianapolis, IN | 3.0 | 1.0 | 900 | $1,149 | $1.28 | 12d | 1 | 0.46mi |
| 3775 Allerton Pl Indianapolis, IN | 1.0–4.0 | 2.0 | 1068 | $1,617 | $1.51 | 16d | 1 | 0.48mi |
| 7975 Red Mill Dr Indianapolis, IN | 2.0 | 1.0 | 576 | $975 | $1.69 | 45d | 1 | 0.52mi |
| 7925 Crossbridge Dr Indianapolis, IN | 2.0 | 2.0 | 1072 | $1,200 | $1.12 | 45d | 1 | 0.61mi |
| 8124 E 37th Pl Indianapolis, IN | 3.0 | 1.0 | 925 | $1,350 | $1.46 | 0d | 1 | 0.64mi |
| 8203 Penway St Indianapolis, IN | 3.0 | 1.5 | 1360 | $1,500 | $1.10 | 25d | 1 | 0.64mi |
| 3900 N Shadeland Ave Indianapolis, IN | 1.0–2.0 | 1.0 | 1070 | $1,075 | $1.00 | 5d | 6 | 0.86mi |
| 7845 Bonita Ct Indianapolis, IN | 3.0 | 1.0 | 1073 | $1,400 | $1.30 | 9d | 1 | 1.16mi |
| 3540 Dubarry Ct Indianapolis, IN | 3.0 | 2.0 | 1297 | $1,400 | $1.08 | 25d | 1 | 1.17mi |
| 7910 Roy Rd Indianapolis, IN | 3.0 | 1.0 | 1073 | $1,445 | $1.35 | 25d | 1 | 1.20mi |
| 3809 Biscayne Rd Indianapolis, IN | 2.0 | 1.5 | 992 | $1,020 | $1.03 | 16d | 1 | 1.21mi |
| 3815 Biscayne Rd Indianapolis, IN | 3.0 | 1.5 | 1188 | $1,220 | $1.03 | 16d | 1 | 1.21mi |
| 3631 Decamp Dr Indianapolis, IN | 3.0 | 1.0 | 1000 | $1,335 | $1.33 | 25d | 1 | 1.21mi |
| 3821 Biscayne Rd Indianapolis, IN | 4.0 | 1.5 | 1188 | $1,325 | $1.12 | 16d | 1 | 1.22mi |
| 3823 Biscayne Rd Indianapolis, IN | 4.0 | 1.5 | 1188 | $1,320 | $1.11 | 16d | 1 | 1.22mi |
| 8254 Meadowlark Dr Indianapolis, IN | 3.0 | 1.5 | 1320 | $1,150 | $0.87 | 24d | 1 | 1.22mi |
| 8254 Meadowlark Dr Unit 1 Indianapolis, IN | 3.0 | 1.5 | 1320 | $1,150 | $0.87 | 45d | 1 | 1.22mi |
| 3829 Biscayne Rd Indianapolis, IN | 4.0 | 1.5 | 1188 | $1,320 | $1.11 | 16d | 1 | 1.22mi |
| 3938 Biscayne Rd Indianapolis, IN | 3.0 | 1.0 | 1000 | $1,895 | $1.90 | 5d | 1 | 1.26mi |
| 8724 Montery Rd Indianapolis, IN | 3.0 | 1.0 | 925 | $1,500 | $1.62 | 45d | 1 | 1.29mi |
| 8501 Athens Ct Indianapolis, IN | 4.0 | 1.0 | 1225 | $1,475 | $1.20 | 16d | 1 | 1.29mi |
| 8501 Athens Ct Indianapolis, IN | 4.0 | 1.0 | 1225 | $1,400 | $1.14 | 0d | 1 | 1.29mi |
| 4307 N Edmondson Ave Indianapolis, IN | 3.0 | 1.0 | 900 | $1,299 | $1.44 | 4d | 1 | 1.30mi |
| 8738 Montery Rd Indianapolis, IN | 3.0 | 1.0 | 1421 | $1,331 | $0.94 | 0d | 1 | 1.31mi |
| 4315 Aspen Way Indianapolis, IN | 3.0 | 1.0 | 1080 | $1,380 | $1.28 | 45d | 1 | 1.31mi |
| 8862 Bel Air Ct Indianapolis, IN | 3.0 | 1.0 | 1073 | $1,264 | $1.18 | 19d | 1 | 1.34mi |
| 8914 Elmonte Dr Indianapolis, IN | 3.0 | 1.5 | 1500 | $1,600 | $1.07 | 25d | 1 | 1.44mi |
Listing history 21 events
-
2026-06-21days on market $144,900 Active 39 DOM
-
2026-06-18days on market $144,900 Active 36 DOM
-
2026-06-17price $144,900 Active 35 DOM
-
2026-06-17days on market $154,900 Active 35 DOM
-
2026-06-16days on market $154,900 Active 34 DOM
-
2026-06-15days on market $154,900 Active 33 DOM
-
2026-06-13days on market $154,900 Active 31 DOM
-
2026-06-13days on market $154,900 Active 30 DOM
-
2026-06-09days on market $154,900 Active 27 DOM
-
2026-06-08days on market $154,900 Active 26 DOM
-
2026-06-07days on market $154,900 Active 25 DOM
-
2026-06-03days on market $154,900 Active 21 DOM
-
2026-06-02days on market $154,900 Active 20 DOM
-
2026-06-01days on market $154,900 Active 19 DOM
-
2026-05-31days on market $154,900 Active 18 DOM
-
2026-05-13$174,900 Active 639-char remark
-
2021-01-27soldstatus $89,000 Closed 588-char remark
Show marketing remark (588 chars)
Unbelievable value on this well-maintained 3 Bed Ranch with no HOA in established neighborhood with mature trees! Easy interstate access & close to Fort Benjamin Harrison State Park. Updates include vinyl windows, water heater (2016) & A/C & coil (2015). Large bathroom has been updated with beadboard wainscoting & vinyl flooring. Great floorplan with spacious Living Room and Kitchen/Dining Room combo. Entertain on the back deck/stone patio area or the large fully fenced backyard, with storage shed. This home is ready for a few cosmetic updates, so bring your vision!
-
2021-01-06status Pending 588-char remark
Show marketing remark (588 chars)
Unbelievable value on this well-maintained 3 Bed Ranch with no HOA in established neighborhood with mature trees! Easy interstate access & close to Fort Benjamin Harrison State Park. Updates include vinyl windows, water heater (2016) & A/C & coil (2015). Large bathroom has been updated with beadboard wainscoting & vinyl flooring. Great floorplan with spacious Living Room and Kitchen/Dining Room combo. Entertain on the back deck/stone patio area or the large fully fenced backyard, with storage shed. This home is ready for a few cosmetic updates, so bring your vision!
-
2020-12-14status Active 588-char remark
Show marketing remark (588 chars)
Unbelievable value on this well-maintained 3 Bed Ranch with no HOA in established neighborhood with mature trees! Easy interstate access & close to Fort Benjamin Harrison State Park. Updates include vinyl windows, water heater (2016) & A/C & coil (2015). Large bathroom has been updated with beadboard wainscoting & vinyl flooring. Great floorplan with spacious Living Room and Kitchen/Dining Room combo. Entertain on the back deck/stone patio area or the large fully fenced backyard, with storage shed. This home is ready for a few cosmetic updates, so bring your vision!
-
2020-12-07status Pending 588-char remark
Show marketing remark (588 chars)
Unbelievable value on this well-maintained 3 Bed Ranch with no HOA in established neighborhood with mature trees! Easy interstate access & close to Fort Benjamin Harrison State Park. Updates include vinyl windows, water heater (2016) & A/C & coil (2015). Large bathroom has been updated with beadboard wainscoting & vinyl flooring. Great floorplan with spacious Living Room and Kitchen/Dining Room combo. Entertain on the back deck/stone patio area or the large fully fenced backyard, with storage shed. This home is ready for a few cosmetic updates, so bring your vision!
-
2020-12-04$97,500 Active 588-char remark
Show marketing remark (588 chars)
Unbelievable value on this well-maintained 3 Bed Ranch with no HOA in established neighborhood with mature trees! Easy interstate access & close to Fort Benjamin Harrison State Park. Updates include vinyl windows, water heater (2016) & A/C & coil (2015). Large bathroom has been updated with beadboard wainscoting & vinyl flooring. Great floorplan with spacious Living Room and Kitchen/Dining Room combo. Entertain on the back deck/stone patio area or the large fully fenced backyard, with storage shed. This home is ready for a few cosmetic updates, so bring your vision!
ⓘ Source: listings_history table (triggers on properties + properties_extension) + one-shot
backfill from property_details.listing_events for pre-trigger history.
Tax reassessment forecast IN · Partial reset (capped growth)
- Current annual tax
- $1,296 · $108/mo
- Projected year-2 tax
- $1,296 · $108/mo
- Expected delta
- $0/yr ($0/mo · 0.0%)
ⓘ Screening estimate from a state-policy table — verify with the county assessor before closing.
Climate risk First Street
- Flood 6/10 Major FEMA zone X (unshaded) · 68% chance over 30 yrs
- Wildfire 1/10 Low
- Heat 3/10 Moderate 7 d/yr ≥101°F today · 18 d/yr by 30 yrs out
- Wind 2/10 Low 0% chance of damaging wind over 30 yrs
- Air quality 3/10 Moderate 3 unhealthy d/yr today · 4 by 30 yrs out
Nearby sold comps map
Loading sold comps map…
Walkable amenities ~0.75 mi
Loading nearby amenities…
Taxation est. · year 1
- Rental income
- $17,208
- − Mortgage interest
- −$8,117
- − Property taxes
- −$1,296
- − Insurance
- −$724
- − Repairs & maintenance
- −$1,377
- − Management
- −$1,377
- − Depreciation
- −$4,215
- Taxable income
- $102
- Est. tax owed @ 24.0%
- −$25
- After-tax cash flow
- $2,431/yr
For passive investors: Depreciation is non-cash, so a rental often shows a tax loss while cash-flowing — sheltering income. Rental losses are passive: they offset passive income freely, and up to $25,000/yr can offset ordinary (W-2) income if you actively participate and your MAGI is under $100k (phasing out to $0 by $150k); unused losses carry forward. On sale, claimed depreciation is recaptured at up to 25%, and gains may owe capital-gains tax (a 1031 exchange can defer both). Figures are a year-1 estimate at your 24.0% rate — not tax advice; consult a CPA.
Schools (NCES district)
- District
- Indianapolis Public Schools
- NCES district ID
- 1804770
- Math proficiency
- 14% ▼ -7.00%
- Reading proficiency
- 20% ▼ -3.00%
- Median HH income
- $32,034
- Composite
- 13.69/100
- National rank
- #9499
- State rank
- #286 of 301 in IN
Livability — Indianapolis city (balance)
No livability data for this city. (Only ~50 U.S. cities are tracked.)
Census & demographics
- Census place
- Indianapolis city (balance), IN
- County
- Marion County · 998,460 people
- City population
- 881,119
- Metro
- Indianapolis-Carmel-Anderson, IN
- Population (ZIP)
- 47,099
- Household income
- $50,325
- Rent vs Own
- Severe rent burden
- 2742.0
Population outlook (Marion County) Hauer SSP2
- Today (2025)
- 1,025,572 people
- By 2030
- 1,065,727 · +3.9%
- By 2040
- 1,141,577 · +11.3%
- By 2050
- 1,208,920 · +17.9%
- By 2075
- 1,367,288 · +33.3%
- By 2100
- 1,438,201 · +40.2%
Race, ethnicity, and origin ACS 2023
- Neighborhood character
- Diverse neighborhood (Simpson 0.62)
- Race & ethnicity
- Black 53% White 25% Hispanic / Latino 17% Two or more races 9% Asian 2%
- Hispanic origin (detail)
- Mexican 11%
- Common ancestry
- Lithuanian 1% Italian 1% Romanian 1%
- Foreign-born
- 11% · Canada
- Languages at home
- 86% English-only · Spanish 10% French/Haitian/Cajun 1% Other Asian/Pacific 1%
Political lean MEDSL · Marion
- 2024 margin
- Strong D (+27.7) · D 63.0% · R 35.3% · Other 1.7%
- 2008→2024 swing
- -0.7pp no change · 2008: 28.4pp · 2024: 27.7pp
- All cycles
- 2024: D+27.7 2020: D+29.1 2016: D+22.8 2012: D+22.2 2008: D+28.4
Not yet ingested
- Civics
- —
Market trends
- HPI YoY
- ▼ -218.85%
- Current HPI
- 239.43
- Rent YoY
- ▲ 6.76%
- Metro
- Indianapolis-Carmel-Anderson, IN
- State GDP YoY
- ▲ 2.90%
- F500 in state
- 18
Industry mix (Fortune 500 HQ in IN)
| Industry | F500 HQs | Revenue |
|---|---|---|
| Industrial Machinery | 2 | $37B |
|
||
| Healthcare | 1 | $177B |
|
||
| Pharmaceuticals | 1 | $45B |
|
||
| Metals / Steel | 1 | $18B |
|
||
| Agriculture | 1 | $17B |
|
||
| Packaging | 1 | $12B |
|
||
Price history
+48.6% since first listed9 events — show timeline
- 2026-06-17 Price Changed $144,900 MIBOR as Distributed by MLS Grid
- 2026-05-27 Price Changed $154,900 MIBOR as Distributed by MLS Grid
- 2026-05-20 Price Changed $164,900 MIBOR as Distributed by MLS Grid
- 2026-05-13 Listed $174,900 MIBOR as Distributed by MLS Grid
- 2021-01-27 Sold (MLS) $89,000 MIBOR as Distributed by MLS Grid
- 2021-01-06 Pending — MIBOR as Distributed by MLS Grid
- 2020-12-14 Relisted — MIBOR as Distributed by MLS Grid
- 2020-12-07 Pending — MIBOR as Distributed by MLS Grid
- 2020-12-04 Listed $97,500 MIBOR as Distributed by MLS Grid
Property tax history
+37.2%/yrLatest (2025): $1,296 · +15.9% YoY. Source: county tax records.
Cash-flow waterfall
monthlySold comps — $/sqft
last 12 mo · ≤1 miLoading sold comps…