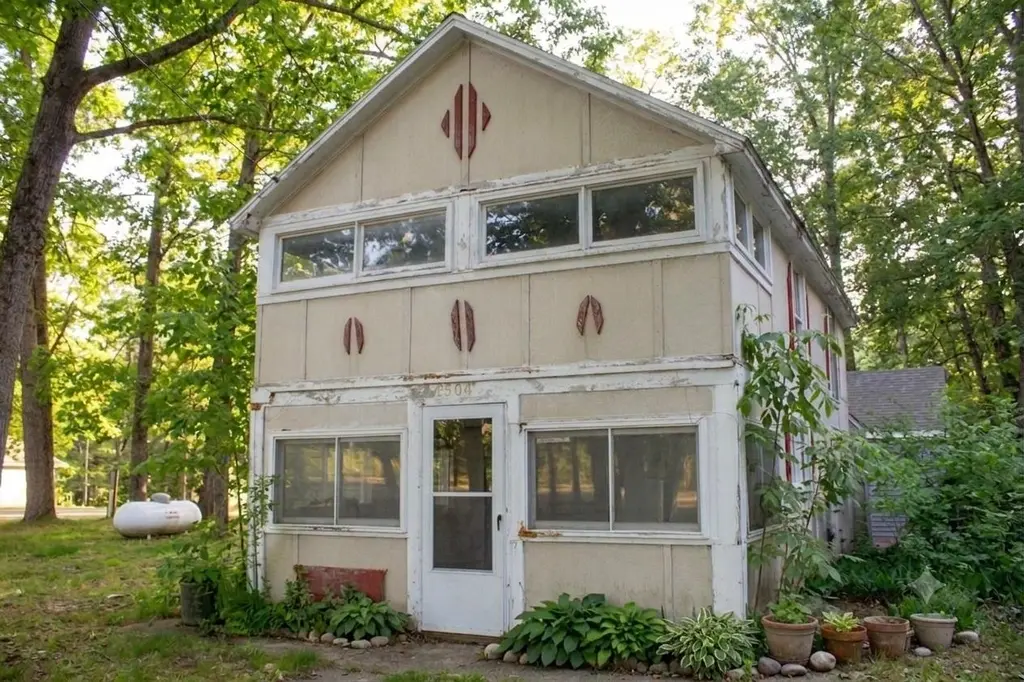
1504 Oak St · Norman, MI
Flood risk 1/10 · Minimal
- FEMA flood zone
- X (unshaded)
- Chance of flooding over 30 yrs
- 0.0%
- Est. flood insurance / yr
- $507 – $1,088
Fire risk 3/10 · Minor
- Est. fire insurance / yr
- $784 – $1,456
Heat risk 1/10 · Minimal
- Hot days now (above 95°F)
- 7 days/yr
- Hot days in 30 yrs
- 14 days/yr
Wind risk 1/10 · Minimal
- Chance of severe wind over 30 yrs
- —
Air-quality risk 2/10 · Minimal
- Unhealthy air days now
- 1 days/yr
- Unhealthy air days in 30 yrs
- 3 days/yr
Risk factors via First Street. Map © Google.
Why this score? — see what drove the B+ grade
The composite is a weighted blend of 9 inputs, each scored 0–100. Each bar is that input's sub-score; the figure is the points it added to the 100-point composite (weight × sub-score).
- Cash flow +30.0/30.0
- 1% rule +10.0/10.0
- DSCR +10.0/10.0
- Appreciation +10.0/10.0
- ARV discount +7.5/15.0
- Rent growth +2.5/5.0
- Livability +2.5/5.0
- Condition / age +2.5/5.0
- Schools +2.2/10.0
$53,000
🖨 Deal sheet (PDF) 📄 Offer letter ✓ Due diligence
Listing remarks MLS
This is a great opportunity to own an affordable 'Up North' cabin just steps from the beach at Crystal Lake in Wellston. While the cabin is in need of a complete renovation, it offers tremendous potential for buyers looking to embrace the very best of Northern Michigan. Enjoy effortless access to the region's premier outdoor recreation: hike the Manistee National Forest (1 mile away), fish at Tippy Dam (5 miles away), canoe the Pine River (10 miles away). Plus, you're just 15 miles from skiing and golfing at Caberfae Peaks, and only 30 miles from the shores of Lake Michigan. Bring your toolbelt and your vision!" Buyer to verify all measurements.
Key facts
- Effortless access
- Complete renovation
- Canoe the pine river
Tags
Property features AI
Exterior
- Utilities: LP/propane heating fuel; Propane hot water heater; Private well water; Septic system; Heating system described as 'Other - see remarks'
- Home design: Residential 2-story home; Built in 1940; Entry on main level
- Construction: Wood construction; Slab foundation
- Exterior features: Water view; Corner lot
Interior
- Kitchen: Kitchen on main level (15 x 7); Range/oven
- Bedrooms: First-floor bedroom; Main-level bedroom (10 x 8); Upper-level bedrooms (15 x 11; 8 ft wide)
- Bathrooms: One full bathroom on main level; Two bathrooms on upper level
- Interior features: Range/oven
Neighborhood map
What this means for you Summary
Snapshot
- This is a 3-bed/1.0-bath single-family listed at $53k.
Deal economics
- At list price, monthly cash flow is $431 ($5k/yr) — positive.
- The deal already cash-flows at list — no discount required.
- Meets the 1% rule at list price ($960 rent vs $53k).
- Recommended offer: $52k (1.5% below list) — sets the bar for market timing.
Location & tenants
- Location reads: area grade B — affects rentability + tenant quality, not the cash-flow math above.
- Kaleva Norman Dickson School District (rural): math 18% / reading 34% proficiency, ranked #423 of 540 in MI (top 78%) — low school quality limits family demand, transient renter base, plan for 1-2y turnover; 65% free/reduced lunch — lower-income household profile, screen leases tightly.
- Zoned schools: Knd Elementary (math 17% / reading 27%, grade F, #1,035 of 1,397 statewide, top 77%, 289 students, 80% FRL); Brethren Middle School (math 27% / reading 47%, grade F, #248 of 493 statewide, top 53%, 73 students, 75% FRL); Brethren High School (math 10% / reading 30%, grade F, #596 of 713 statewide, top 86%, 177 students, 64% FRL).
- Market conditions: 25 active listings in the ZIP; 109 units permitted in Manistee County in 2024 (0 in 5+ unit buildings).
Forward outlook
- In year one you build about $6k of equity ($366 loan paydown + $5k appreciation (10.0% local appreciation)).
- Manistee County population projected at -13% by 2050 — secular population decline; favor cash flow + early exit over multi-decade hold.
- At projected returns (10.0% appreciation + 3.0% rent growth), your $15k cash investment doubles in ~2 years — after that, you're playing with house money.
- By year 6, paydown + projected appreciation supports a ~$33k cash-out refi (75% LTV) — recoverable capital for the next deal without selling this one.
Negotiation context
- It's been on market 15 days — a 2% lower offer ($52k) is reasonable based on typical stale-listing flexibility.
- 5 sale attempts since 4y ago with the ask held roughly flat each time — persistent listings suggest the price (not the market) is what's stuck; bring a comps-based counter.
- Current owner paid $40k; 32% above their basis — modest negotiation headroom, anchor on the comps not their cost.
Risks & watch-outs
- Watch-outs: built in 1940 — expect roof / HVAC / electrical / plumbing capex.
Questions for the listing agent
- Built in 1940 — when were the roof, HVAC, electrical panel, plumbing, and water heater last replaced?
- Is there a deadline driving the sale (1031 exchange, divorce, estate, relocation)? That informs how much negotiation room exists.
- What's the average days-on-market for RENTAL listings here right now (not sales)? A rising rental-DOM trend means longer vacancies and softer asking-rent achievability than the comps imply.
- What's the recent tenant-quality profile in this submarket — average credit score on applications, eviction rate, late-payment / NSF rate, and stable-employment percentage? A property-management company in the area should have these aggregated.
- How much new for-sale + rental construction is in the pipeline within 1–3 miles? Heavy new supply typically softens prices + rents 12–24 months out; constrained supply supports both.
Investment metrics
- 1% rule
- 1.81% ✓
- Cap rate
- 16.04%
- Cash-on-cash
- 34.82%
- DSCR
- 2.55
- GRM
- 4.6
CMA / ARV
- ARV (on-the-fly)
- $172,716
- Comps found
- 4
Show comp detail 4 sales within ~0.75 mi
| Address | Dist | Beds/Ba | Sqft | Sold | Price | $/sf | Match |
|---|---|---|---|---|---|---|---|
| 1713 Spruce | 0.38mi | 2/1.0 (-1) | 800 (+3%) | 16mo | $177,565 | $222 | 59 |
| 1186 S Baker Rd Rd | 0.58mi | 2/1.5 (-1) | 800 (+3%) | 8mo | $285,000 | $356 | 55 |
| 17272 Hanna St | 0.34mi | 2/1.0 (-1) | 816 (+5%) | 22mo | $111,000 | $136 | 53 |
| 17423 Spring St | 0.52mi | 2/1.0 (-1) | 850 (+9%) | 6mo | $149,900 | $176 | 50 |
Match score weights: distance 35% · size 25% · config 20% · recency 20%. Top-matched comps best support the ARV.
Projected returns pro-forma
10.0% appreciation · 3.0% rent growth · sell at horizon
- IRR
- 51.0%
- Equity multiple
- 4.79×
- Total profit
- $56,282
- Equity at exit
- $47,747
- IRR
- 44.6%
- Equity multiple
- 10.71×
- Total profit
- $144,157
- Equity at exit
- $102,967
Cash invested: $14,840 (down + closing). Projections, not guarantees.
Landlord ↔ Tenant lean methodology
- Overall (STATE)
- 62 Landlord-Friendly
- State Michigan
- 62 Landlord-Friendly · EVEN
- County
- — inherits STATE
- City
- — inherits STATE
ZIP-level market 49689
- Home prices YoY
- 12.8%
- Active inventory
- 25
- Price-to-rent
- 4.6×
Monthly cashflow live
- Estimated rent
- $960 medium interval (Pro) →
- Mortgage (P&I)
- −$278
- Tax from tax record
- −$28 /mo · $337/yr
- Insurance
- −$22
- HOA
- −$0
- Vacancy / Maint / Mgmt
- −$202
- Net cashflow
- $431
Break-even live
Sensitivity live
| Price | -10% $461 | -5% $446 | +0% $431 | +5% $416 | +10% $401 |
|---|---|---|---|---|---|
| Rent | -10% $355 | -5% $393 | +0% $431 | +5% $469 | +10% $506 |
| Rate | -1.0pp $457 | -0.5pp $444 | base $431 | +0.5pp $417 | +1.0pp $403 |
UW: 25.0% down · 7.5% · 30yr · 1.5% tax · 5.0% vac · 8.0% maint · 8.0% mgmt
Financing live
Cash to close
- Down payment
- $13,250
- Closing costs
- $1,590
- Reserves months
- —
- Total cash needed
- —
Loan-product check · same deal, 3 products live
Conventional
25% down · 7.5% · 30yr
- Down + closing
- —
- Monthly P&I
- —
- Monthly cashflow
- —
- DSCR
- —
- Eligible?
- —
Personal DTI + credit; lowest rate.
DSCR
20% down · 8.5% · 30yr
- Down + closing
- —
- Monthly P&I
- —
- Monthly cashflow
- —
- DSCR
- —
- Eligible?
- —
No personal income docs; deal must DSCR.
Hard money
10% down · 12.0% · 12mo
- Down + closing
- —
- Monthly P&I
- —
- Monthly cashflow
- —
- DSCR
- —
- Eligible?
- —
Short-term bridge; refi at stabilization.
Listing history 12 events
-
2026-06-21days on market $53,000 Active 15 DOM
-
2026-06-21days on market $53,000 Active 14 DOM
-
2026-06-18days on market $53,000 Active 12 DOM
-
2026-06-17days on market $53,000 Active 11 DOM
-
2026-06-16days on market $53,000 Active 10 DOM
-
2026-06-15days on market $53,000 Active 9 DOM
-
2026-06-13days on market $53,000 Active 7 DOM
-
2026-06-12days on market $53,000 Active 6 DOM
-
2026-06-09days on market $53,000 Active 3 DOM
-
2026-06-08days on market $53,000 Active 2 DOM
-
2026-06-07remarks 653-char remark
-
2026-06-07$53,000 Active 1 DOM
ⓘ Source: listings_history table (triggers on properties + properties_extension) + one-shot
backfill from property_details.listing_events for pre-trigger history.
Tax reassessment forecast MI · Partial reset (capped growth)
- Current annual tax
- $337 · $28/mo
- Projected year-2 tax
- $576 · $48/mo
- Expected delta
- +$240/yr (+$20/mo · 71.3%)
ⓘ Screening estimate from a state-policy table — verify with the county assessor before closing.
Climate risk First Street
- Flood 1/10 Low FEMA zone X (unshaded) · 0% chance over 30 yrs
- Wildfire 3/10 Moderate
- Heat 1/10 Low 7 d/yr ≥95°F today · 14 d/yr by 30 yrs out
- Wind 1/10 Low
- Air quality 2/10 Low 1 unhealthy d/yr today · 3 by 30 yrs out
Nearby sold comps map
Loading sold comps map…
Walkable amenities ~0.75 mi
Loading nearby amenities…
Taxation est. · year 1
- Rental income
- $11,524
- − Mortgage interest
- −$2,969
- − Property taxes
- −$337
- − Insurance
- −$265
- − Repairs & maintenance
- −$922
- − Management
- −$922
- − Depreciation
- −$1,542
- Taxable income
- $4,568
- Est. tax owed @ 24.0%
- −$1,096
- After-tax cash flow
- $4,071/yr
For passive investors: Depreciation is non-cash, so a rental often shows a tax loss while cash-flowing — sheltering income. Rental losses are passive: they offset passive income freely, and up to $25,000/yr can offset ordinary (W-2) income if you actively participate and your MAGI is under $100k (phasing out to $0 by $150k); unused losses carry forward. On sale, claimed depreciation is recaptured at up to 25%, and gains may owe capital-gains tax (a 1031 exchange can defer both). Figures are a year-1 estimate at your 24.0% rate — not tax advice; consult a CPA.
Schools (NCES district)
- District
- Kaleva Norman Dickson School District
- NCES district ID
- 2620010
- Math proficiency
- 18% ▼ -4.00%
- Reading proficiency
- 34% ▼ -2.00%
- Median HH income
- $36,530
- Composite
- 21.54/100
- National rank
- #8314
- State rank
- #423 of 540 in MI
Livability — Norman
No livability data for this city. (Only ~50 U.S. cities are tracked.)
Census & demographics
- Census place
- Wellston, MI
- Population (ZIP)
- 1,791
Population outlook (Manistee County) Hauer SSP2
- Today (2025)
- 23,785 people
- By 2030
- 23,227 · -2.3%
- By 2040
- 21,795 · -8.4%
- By 2050
- 20,653 · -13.2%
- By 2075
- 18,833 · -20.8%
- By 2100
- 15,491 · -34.9%
Race, ethnicity, and origin ACS 2023
- Neighborhood character
- Predominantly White (92%)
- Race & ethnicity
- White 92% Hispanic / Latino 3% Two or more races 3% Black 1% Native American 1%
- Common ancestry
- Romanian 13% Iranian 5% Lithuanian 2%
- Foreign-born
- 0%
Political lean MEDSL · Manistee
- 2024 margin
- R (+15.9) · D 41.2% · R 57.2% · Other 1.6%
- 2008→2024 swing
- -29.2pp toward R · 2008: 13.3pp · 2024: -15.9pp
- All cycles
- 2024: R+15.9 2020: R+15.1 2016: R+15.4 2012: D+5.9 2008: D+13.3
Not yet ingested
- Civics
- —
Market trends
- HPI YoY
- ▲ 31.65%
- Current HPI
- 279.8512
- Rent YoY
- —
- Metro
- —
- State GDP YoY
- ▲ 1.37%
- F500 in state
- 28
Industry mix (Fortune 500 HQ in MI)
| Industry | F500 HQs | Revenue |
|---|---|---|
| Automotive Parts | 3 | $48B |
|
||
| Automotive | 2 | $372B |
|
||
| Chemicals | 1 | $45B |
|
||
| Automotive Retail | 1 | $29B |
|
||
| Healthcare / Medical Devices | 1 | $23B |
|
||
| Automotive Technology | 1 | $20B |
|
||
Price history
-24.2% since first listed13 events — show timeline
- 2026-06-06 Listed $53,000 REALCOMP
- 2026-06-06 Listed $53,000 MiRealSource-MiMLS
- 2023-01-27 Sold (Public Records) $40,000 Public Records
- 2023-01-27 Sold (MLS) $40,000 SW Michigan MLS
- 2023-01-27 Sold (MLS) $40,000 REALCOMP
- 2022-12-19 Pending — MiRealSource-MiMLS
- 2022-12-19 Pending — REALCOMP
- 2022-12-19 Pending — SW Michigan MLS
- 2022-09-30 Price Changed $52,900 REALCOMP
- 2022-09-30 Price Changed $52,900 SW Michigan MLS
- 2022-08-12 Listed $69,900 SW Michigan MLS
- 2022-08-12 Listed $52,900 MiRealSource-MiMLS
- 2022-08-12 Listed $69,900 REALCOMP
Property tax history
-3.8%/yrLatest (2025): $337 · -76.3% YoY. Source: county tax records.
Cash-flow waterfall
monthlySold comps — $/sqft
last 12 mo · ≤1 miLoading sold comps…