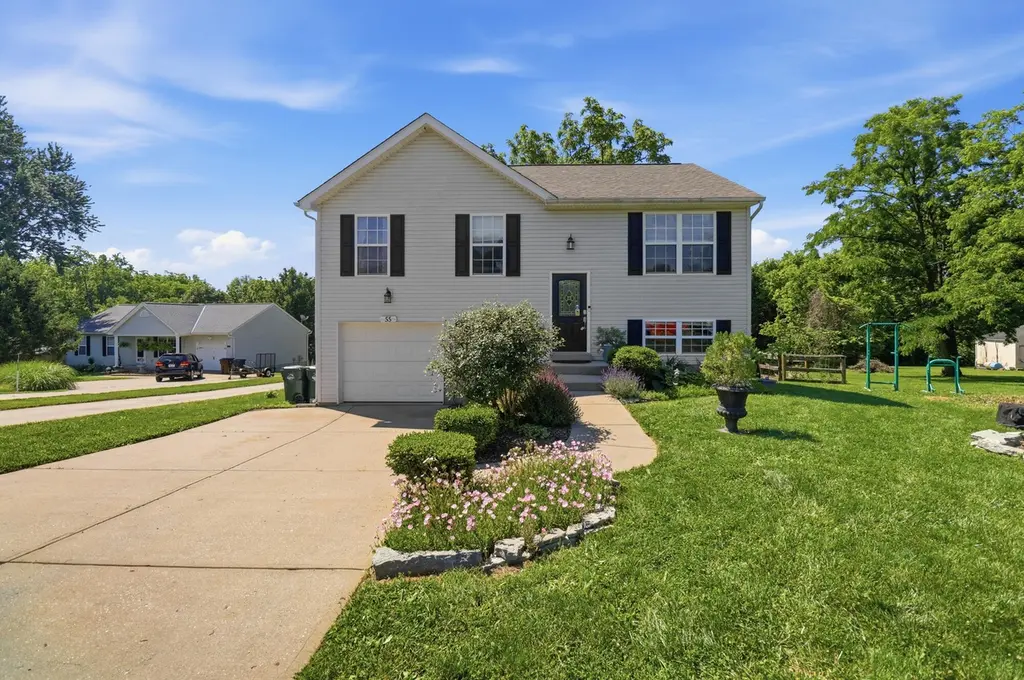
55 Wayman Dr · Independence, KY
Flood risk 1/10 · Minimal
- FEMA flood zone
- X (unshaded)
- Chance of flooding over 30 yrs
- 0.0%
- Est. flood insurance / yr
- $507 – $1,088
Fire risk 3/10 · Minor
- Est. fire insurance / yr
- $839 – $1,559
Heat risk 4/10 · Minor
- Hot days now (above 102°F)
- 7 days/yr
- Hot days in 30 yrs
- 19 days/yr
Wind risk 2/10 · Minimal
- Chance of severe wind over 30 yrs
- 1.0%
Air-quality risk 3/10 · Minor
- Unhealthy air days now
- 2 days/yr
- Unhealthy air days in 30 yrs
- 3 days/yr
Risk factors via First Street. Map © Google.
Why this score? — see what drove the F grade
The composite is a weighted blend of 9 inputs, each scored 0–100. Each bar is that input's sub-score; the figure is the points it added to the 100-point composite (weight × sub-score).
- Cash flow +12.7/30.0
- Schools +4.0/10.0
- DSCR +3.8/10.0
- Rent growth +3.8/5.0
- Livability +3.6/5.0
- 1% rule +2.9/10.0
- Condition / age +2.5/5.0
- ARV discount +0.4/15.0
- Appreciation +0.0/10.0
$279,900
🖨 Deal sheet (PDF) 📄 Offer letter ✓ Due diligence
Listing remarks MLS
Really nice newer home on quiet street. Brand new carpet and laminate flooring. Fresh paint, HUGE fenced rear yard with storage shed and play set. Deck with new steps to yard. 3 bedroom/3 full baths. Double driveway. 1 year warranty. HVAC is less than 1 year old. Great home, great opportunity. No down payment financing available.
Key facts
- New furnace and a/c
- Water softener
- Half an acre
Tags
Property features AI
Finance
- Financial info: Home warranty included
Exterior
- Parking: Driveway; Garage (1 space)
- Security: Security system; Smoke detectors
- Utilities: Public water; Public sewer; Water available
- Home design: Single family residence; Bi-level
- Construction: Built in 2007; Vinyl siding; Shingle roof; Poured concrete foundation
- Exterior features: Deck; Patio; Wood fencing; Shed(s) / storage; Has a view
Interior
- Kitchen: Electric oven; Electric range; Dishwasher; Microwave; Refrigerator
- Bedrooms: Primary bedroom (13 x 10); Bedroom 2 (11 x 9); Bedroom 3 (9 x 8)
- Bathrooms: 3 full bathrooms
- Heating & cooling: Heat pump and electric heating; Central air conditioning
- Interior features: Cathedral ceilings; Ceiling fans; Multi-panel doors; Recessed lighting; Full basement
- Laundry & utility: Washer; Dryer
Neighborhood map
What this means for you Summary
Snapshot
- This is a 3-bed/2.5-bath single-family listed at $280k.
Deal economics
- At list price, monthly cash flow is $-32 ($-382/yr) — negative.
- To cash-flow at today's rent, offer at most $274k (2.0% below list).
- To meet the 1% rule (rent ≥ 1% of price), the offer needs to be $222k (20.8% below list).
- Recommended offer: $222k (20.8% below list) — sets the bar for 1% rule.
- Cap rate 6.2% vs local median 3.7% in Independence — top-decile yield for the area; either an underpriced asset or a hidden risk that comps aren't pricing in. Stress-test before assuming the spread holds.
Location & tenants
- Location reads 72/100 on livability (#130 in KY) — a middle-class / working-renter tenant base. Strengths: crime A+, employment A+, cost of living A+; Watch: amenities F, commute F, health & safety F.
- Kenton County (suburban): math 42% / reading 48% proficiency, ranked #14 of 165 in KY (top 8%) — families likely to look elsewhere, expect single-tenant / working-renter base with shorter leases.
- Zoned schools: Woodland Middle School (math 38% / reading 50%, grade D, #40 of 217 statewide, top 19%, 616 students, 48% FRL); Simon Kenton High School (math 40% / reading 44%, grade F, #32 of 254 statewide, top 13%, 1,859 students, 37% FRL).
- Market conditions: Rents rising fast (+5.4%/yr); 258 active listings in the ZIP; 1 comparable units currently listed for rent nearby; solid renter incomes; 699 units permitted in Kenton County in 2024 (287 in 5+ unit buildings).
Forward outlook
- Local home prices are declining (-3.0%/yr); year-one equity from $2k of loan paydown is wiped out by about $8k of value loss. Plan a longer hold.
- Kenton County population projected at +5% by 2050 — modest demand growth; plan on rents tracking national, not racing it.
Negotiation context
- Only 5 days on market — expect competitive offers; lowballing is unlikely to land.
- 5 sale attempts since 21y ago with the ask held roughly flat each time — persistent listings suggest the price (not the market) is what's stuck; bring a comps-based counter.
- Current owner paid $154k; list at $280k implies a 82% gain — meaningful room to come down on a strong offer.
Questions for the listing agent
- What do current leases actually rent for vs. the listed asking? Can we see a recent rent roll and the last 12 months of T-12 income?
- Is there a deadline driving the sale (1031 exchange, divorce, estate, relocation)? That informs how much negotiation room exists.
- Schools are B-rated — typically a magnet for longer-tenancy family renters. What's the average tenant stay here, and is there a school-zone premium baked into asking?
- The area grade is low — what's the realistic commute time and amenity access for the typical tenant pool here? Any planned neighborhood developments (good or bad) we should know about?
- What's the average days-on-market for RENTAL listings here right now (not sales)? A rising rental-DOM trend means longer vacancies and softer asking-rent achievability than the comps imply.
- What's the recent tenant-quality profile in this submarket — average credit score on applications, eviction rate, late-payment / NSF rate, and stable-employment percentage? A property-management company in the area should have these aggregated.
- How much new for-sale + rental construction is in the pipeline within 1–3 miles? Heavy new supply typically softens prices + rents 12–24 months out; constrained supply supports both.
Investment metrics
- 1% rule
- 0.79% ✗
- Cap rate
- 6.16%
- Cash-on-cash
- -0.49%
- DSCR
- 0.98
- GRM
- 10.5
CMA / ARV
- ARV (on-the-fly)
- $241,920
- Comps found
- 11
Show comp detail 11 sales within ~0.75 mi
| Address | Dist | Beds/Ba | Sqft | Sold | Price | $/sf | Match |
|---|---|---|---|---|---|---|---|
| 70 Carrie Way | 0.25mi | 3/1.5 | 1,000 (-1%) | 13mo | $286,000 | $286 | 72 |
| 37 Sylvan Dr | 0.32mi | 3/2.0 | 1,025 (+2%) | 10mo | $275,000 | $268 | 72 |
| 48 Sherwood Dr | 0.31mi | 3/2.5 | 1,026 (+2%) | 19mo | $233,500 | $228 | 66 |
| 164 Friar Tuck Dr | 0.20mi | 3/2.0 | 1,098 (+9%) | 10mo | $235,000 | $214 | 66 |
| 5190 Christopher Dr | 0.24mi | 3/1.5 | 1,120 (+11%) | 1mo | $255,000 | $228 | 65 |
| 64 Sylvan Dr | 0.40mi | 3/1.5 | 1,080 (+7%) | 5mo | $269,000 | $249 | 61 |
| 5178 Christopher Dr | 0.25mi | 3/2.0 | 1,075 (+7%) | 20mo | $255,000 | $237 | 59 |
| 5228 Belle Dr | 0.53mi | 3/1.0 | 1,054 (+5%) | 14mo | $221,900 | $211 | 50 |
| 114 Sylvan Dr | 0.54mi | 3/2.0 | 1,125 (+12%) | 7mo | $270,000 | $240 | 48 |
| 21 Sylvan Dr | 0.30mi | 2/2.0 (-1) | 875 (-13%) | 20mo | $225,000 | $257 | 40 |
| 1968 Independence Rd | 0.57mi | 2/1.0 (-1) | 916 (-9%) | 23mo | $238,000 | $260 | 28 |
Match score weights: distance 35% · size 25% · config 20% · recency 20%. Top-matched comps best support the ARV.
Projected returns pro-forma
-3.0% appreciation · 5.37% rent growth · sell at horizon
- IRR
- -14.7%
- Equity multiple
- 0.46×
- Total profit
- $-42,028
- Equity at exit
- $41,734
- IRR
- -2.8%
- Equity multiple
- 0.79×
- Total profit
- $-16,125
- Equity at exit
- $24,201
Cash invested: $78,372 (down + closing). Projections, not guarantees.
Landlord ↔ Tenant lean methodology
- Overall (STATE)
- 83 Strongly Landlord-Friendly
- State Kentucky
- 83 Strongly Landlord-Friendly · R+16
- County
- — inherits STATE
- City
- — inherits STATE
ZIP-level market 41051
- Home prices YoY
- -32.6%
- Rents YoY
- 5.4%
- Active inventory
- 258
- Price-to-rent
- 10.5×
Monthly cashflow live
- Estimated rent
- $2,218 medium interval (Pro) →
- Mortgage (P&I)
- −$1,468
- Tax from tax record
- −$199 /mo · $2,394/yr
- Insurance
- −$117
- HOA
- −$0
- Vacancy / Maint / Mgmt
- −$466
- Net cashflow
- $-32
Break-even live
Sensitivity live
| Price | -10% $127 | -5% $47 | +0% $-32 | +5% $-111 | +10% $-190 |
|---|---|---|---|---|---|
| Rent | -10% $-207 | -5% $-119 | +0% $-32 | +5% $56 | +10% $143 |
| Rate | -1.0pp $109 | -0.5pp $39 | base $-32 | +0.5pp $-104 | +1.0pp $-178 |
UW: 25.0% down · 7.5% · 30yr · 1.5% tax · 5.0% vac · 8.0% maint · 8.0% mgmt
Financing live
Cash to close
- Down payment
- $69,975
- Closing costs
- $8,397
- Reserves months
- —
- Total cash needed
- —
Loan-product check · same deal, 3 products live
Conventional
25% down · 7.5% · 30yr
- Down + closing
- —
- Monthly P&I
- —
- Monthly cashflow
- —
- DSCR
- —
- Eligible?
- —
Personal DTI + credit; lowest rate.
DSCR
20% down · 8.5% · 30yr
- Down + closing
- —
- Monthly P&I
- —
- Monthly cashflow
- —
- DSCR
- —
- Eligible?
- —
No personal income docs; deal must DSCR.
Hard money
10% down · 12.0% · 12mo
- Down + closing
- —
- Monthly P&I
- —
- Monthly cashflow
- —
- DSCR
- —
- Eligible?
- —
Short-term bridge; refi at stabilization.
Rent comps 1 comps
| Address | Beds | Baths | Sqft | Rent | $/sqft | DOM | Units | Dist |
|---|---|---|---|---|---|---|---|---|
| 10702 Brent Ridge Cir Independence, KY | 2.0–3.0 | 2.0–3.0 | 1520 | $2,775 | $1.83 | 3d | 4 | 1.44mi |
Listing history 5 events
-
2026-06-13statusdays on market $279,900 Pending 5 DOM
-
2026-06-09days on market $279,900 Active 4 DOM
-
2026-06-08days on market $279,900 Active 3 DOM
-
2026-06-07remarks 699-char remark
-
2026-06-07$279,900 Active 2 DOM
ⓘ Source: listings_history table (triggers on properties + properties_extension) + one-shot
backfill from property_details.listing_events for pre-trigger history.
Tax reassessment forecast KY · Resets to sale price
- Current annual tax
- $2,394 · $199/mo
- Projected year-2 tax
- $2,407 · $201/mo
- Expected delta
- +$13/yr (+$1/mo · 0.6%)
ⓘ Screening estimate from a state-policy table — verify with the county assessor before closing.
Climate risk First Street
- Flood 1/10 Low FEMA zone X (unshaded) · 0% chance over 30 yrs
- Wildfire 3/10 Moderate
- Heat 4/10 Moderate 7 d/yr ≥102°F today · 19 d/yr by 30 yrs out
- Wind 2/10 Low 100% chance of damaging wind over 30 yrs
- Air quality 3/10 Moderate 2 unhealthy d/yr today · 3 by 30 yrs out
Nearby sold comps map
Loading sold comps map…
Walkable amenities ~0.75 mi
Loading nearby amenities…
Taxation est. · year 1
- Rental income
- $26,615
- − Mortgage interest
- −$15,679
- − Property taxes
- −$2,394
- − Insurance
- −$1,400
- − Repairs & maintenance
- −$2,129
- − Management
- −$2,129
- − Depreciation
- −$8,143
- Taxable loss
- −$5,259
- Est. tax savings @ 24.0%
- +$1,262
- After-tax cash flow
- $880/yr
For passive investors: Depreciation is non-cash, so a rental often shows a tax loss while cash-flowing — sheltering income. Rental losses are passive: they offset passive income freely, and up to $25,000/yr can offset ordinary (W-2) income if you actively participate and your MAGI is under $100k (phasing out to $0 by $150k); unused losses carry forward. On sale, claimed depreciation is recaptured at up to 25%, and gains may owe capital-gains tax (a 1031 exchange can defer both). Figures are a year-1 estimate at your 24.0% rate — not tax advice; consult a CPA.
Schools (NCES district)
- District
- Kenton County
- NCES district ID
- 2103090
- Math proficiency
- 42% ▼ -13.00%
- Reading proficiency
- 48% ▼ -14.00%
- Median HH income
- $66,183
- Composite
- 40.17/100
- National rank
- #3789
- State rank
- #14 of 165 in KY
Livability — Independence
- Score
- 72/100
- State rank
- #130
- US rank
- #6165
Category grades
Schools grade is shown separately in the Schools card above.
Census & demographics
- Census place
- Independence, KY
- County
- Kenton County · 142,881 people
- City population
- 33,054
- Metro
- Cincinnati, OH-KY-IN
- Population (ZIP)
- 33,054
- Household income
- $104,201
- Rent vs Own
- Severe rent burden
- 243.0
Population outlook (Kenton County) Hauer SSP2
- Today (2025)
- 174,205 people
- By 2030
- 177,897 · +2.1%
- By 2040
- 182,671 · +4.9%
- By 2050
- 183,543 · +5.4%
- By 2075
- 178,977 · +2.7%
- By 2100
- 159,920 · -8.2%
Race, ethnicity, and origin ACS 2023
- Neighborhood character
- Predominantly White (93%)
- Race & ethnicity
- White 93% Two or more races 3% Hispanic / Latino 2% Black 1% Asian 1%
- Common ancestry
- Italian 3% Lithuanian 3% Slovak 2%
- Foreign-born
- 3% · China, Canada
- Languages at home
- 96% English-only · Spanish 1% Chinese 1% Other Asian/Pacific 1%
Political lean MEDSL · Kenton
- 2024 margin
- Strong R (+21.7) · D 38.2% · R 59.9% · Other 1.9%
- 2008→2024 swing
- -0.9pp no change · 2008: -20.9pp · 2024: -21.7pp
- All cycles
- 2024: R+21.7 2020: R+19.3 2016: R+26.1 2012: R+24.3 2008: R+20.9
Not yet ingested
- Civics
- —
Market trends
- HPI YoY
- ▼ -105.60%
- Current HPI
- 218.492
- Rent YoY
- ▲ 5.37%
- Metro
- Cincinnati, OH-KY-IN
- State GDP YoY
- ▲ 1.81%
- F500 in state
- 4
Industry mix (Fortune 500 HQ in KY)
| Industry | F500 HQs | Revenue |
|---|---|---|
| Healthcare | 1 | $118B |
|
||
| Food / Beverage | 1 | $7B |
|
||
Price history
+976.5% since first listed11 events — show timeline
- 2026-06-05 Listed $279,900 NKMLS
- 2016-07-07 Sold (Public Records) $153,500 Public Records
- 2016-07-01 Sold (MLS) $153,500 NKMLS
- 2016-05-02 Listed $155,500 NKMLS
- 2007-10-12 Sold (MLS) $138,000 NKMLS
- 2007-08-18 Listed $141,500 NKMLS
- 2005-08-16 Listing Removed — NKMLS
- 2005-08-16 Listing Removed — NKMLS
- 2005-02-16 Listed $55,000 NKMLS
- 2005-02-16 Listed $55,000 NKMLS
- 1993-09-02 Sold (Public Records) $26,000 Public Records
Property tax history
+2.9%/yrLatest (2025): $2,394 · +7.1% YoY. Source: county tax records.
Cash-flow waterfall
monthlySold comps — $/sqft
last 12 mo · ≤1 miLoading sold comps…