3923 E-z St · Sherwood Shores, TX
Flood risk 1/10 · Minimal
- FEMA flood zone
- X
- Chance of flooding over 30 yrs
- 0.0%
- Est. flood insurance / yr
- $507 – $1,088
Fire risk 4/10 · Minor
- Est. fire insurance / yr
- $2,463 – $4,575
Heat risk 6/10 · Moderate
- Hot days now (above 110°F)
- 7 days/yr
- Hot days in 30 yrs
- 20 days/yr
Wind risk 4/10 · Minor
- Chance of severe wind over 30 yrs
- 18.0%
Air-quality risk 3/10 · Minor
- Unhealthy air days now
- 3 days/yr
- Unhealthy air days in 30 yrs
- 3 days/yr
Risk factors via First Street. Map © Google.
Why this score? — see what drove the B- grade
The composite is a weighted blend of 9 inputs, each scored 0–100. Each bar is that input's sub-score; the figure is the points it added to the 100-point composite (weight × sub-score).
- Cash flow +24.9/30.0
- Appreciation +10.0/10.0
- DSCR +8.1/10.0
- ARV discount +7.5/15.0
- 1% rule +6.5/10.0
- Rent growth +2.5/5.0
- Schools +2.5/10.0
- Livability +2.5/5.0
- Condition / age +2.5/5.0
$199,900
🖨 Deal sheet (PDF) 📄 Offer letter ✓ Due diligence
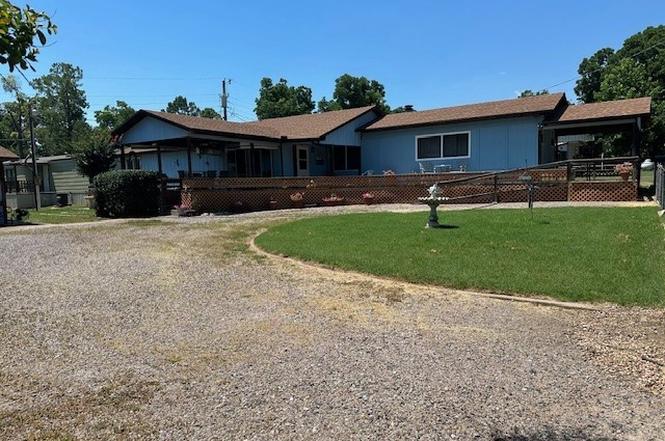
Listing remarks
Here is a great lake home in Buncombe Creek. Drive up to a large deck with plenty of room for entertaining. A fenced yard and a shop. It has a handicap ramp up to the deck. It is a single wide mobile home with 2 bedrooms and 2 bathrooms. It is within walking distance to the lake. Close to all that the Buncombe Creek area has to offer - boat ramp, store, and Twisted Anchor Grill and Patio. Fantastic, well-established neighborhood. Large kitchen and dining area with a wood burning fireplace. Lot of built-ins, pantry space and storage. All appliances and some of the furniture will stay with this one.
Key facts
- Large deck
- Fenced yard
- Lake home
Tags
Property features AI
Exterior
- Parking: Detached 2-car garage; Boat parking; RV access/parking; Workshop and shelving in garage
- Security: Smoke detector(s); No safety shelter
- Utilities: Electricity available; Phone available; Water available (rural); Septic tank
- Home design: Manufactured single-wide home; 2 stories; Faces east; Crawlspace/permanent foundation with tie downs
- Construction: HardiPlank-type exterior; Asphalt/fiberglass roof
- Exterior features: Covered patio/porch/deck; Deck; Patio; Porch; Satellite dish; Chain link fencing; Cul-de-sac lot with mature trees
Interior
- Kitchen: Microwave; Oven; Range; Stove; Refrigerator
- Flooring: Carpet; Laminate
- Bathrooms: 2 full bathrooms
- Heating & cooling: Central heating (electric); Central air conditioning
- Interior features: Aluminum frame windows; Laminate counters; Ceiling fan(s); Electric oven and range connections; Handicap access; Low-threshold shower, accessible approach with ramp, and accessible doors
- Laundry & utility: Washer hookup; Electric dryer hookup; Dryer; Washer; Electric water heater
Neighborhood map
What this means for you Summary
Snapshot
- This is a 3-bed/2.0-bath manufactured listed at $200k.
Deal economics
- At list price, monthly cash flow is $430 ($5k/yr) — positive.
- The deal already cash-flows at list — no discount required.
- Meets the 1% rule at list price ($2k rent vs $200k).
- Recommended offer: $182k (9.0% below list) — sets the bar for market timing.
- Cap rate 8.9% vs local median 2.9% in Sherwood Shores — top-decile yield for the area; either an underpriced asset or a hidden risk that comps aren't pricing in. Stress-test before assuming the spread holds.
Location & tenants
- Location reads 49/100 on livability (#1,519 in TX) — a working-class tenant base; expect higher turnover. Strengths: cost of living A+, housing A+; Watch: crime F, amenities F, commute F.
- Kingston (rural): math 27% / reading 32% proficiency, ranked #70 of 270 in OK (top 26%) — low school quality limits family demand, transient renter base, plan for 1-2y turnover; 76% free/reduced lunch — lower-income household profile, screen leases tightly.
- Zoned schools: Kingston Es (math 33% / reading 32%, grade F, #210 of 845 statewide, top 25%, 620 students, 0% FRL); Kingston Ms (math 23% / reading 34%, grade F, #57 of 345 statewide, top 18%, 286 students, 0% FRL); Kingston Hs (math 22% / reading 27%, grade F, #150 of 447 statewide, top 48%, 362 students, 0% FRL) — zoned schools average 0% FRL vs 76% district-wide (76 pts lower); this property's tenant base skews higher-income than the district average.
- Market conditions: 42 units permitted in Marshall County in 2024 (0 in 5+ unit buildings).
Forward outlook
- In year one you build about $21k of equity ($1k loan paydown + $20k appreciation (10.0% local appreciation)).
- Marshall County population projected at +22% by 2050 — long-run rental-demand tailwind backs the buy-and-hold thesis.
- At projected returns (10.0% appreciation + 3.0% rent growth), your $56k cash investment doubles in ~3 years — after that, you're playing with house money.
- By year 2, paydown + projected appreciation supports a ~$34k cash-out refi (75% LTV) — recoverable capital for the next deal without selling this one.
Negotiation context
- It's been on market 99 days — a 9% lower offer ($182k) is reasonable based on typical stale-listing flexibility.
- 5 sale attempts since 2y ago with the ask held roughly flat each time — persistent listings suggest the price (not the market) is what's stuck; bring a comps-based counter.
- Current owner paid $58k; list at $200k implies a 242% gain — meaningful room to come down on a strong offer.
Risks & watch-outs
- Climate carrying-cost: extreme-heat days projected 7→20/yr by 2055 (HVAC capex compounding) — expect insurance premiums to compound above CPI over the hold.
Questions for the listing agent
- It's been on market 99 days. Have you received any prior offers? Is the seller open to a 9% concession, seller financing, or rate buy-down credit?
- Why hasn't it sold? Are there any deal-killer items the seller is aware of (foundation, flood, title, zoning, code violations)?
- Is there a deadline driving the sale (1031 exchange, divorce, estate, relocation)? That informs how much negotiation room exists.
- Schools are F-rated, which usually means shorter tenancies and higher turnover. Who's the typical renter profile here, and what's been the actual vacancy rate?
- Crime grade is F in this area — have there been break-ins, vandalism, or insurance claims at this property in the last 3 years? What carrier currently insures it and at what premium?
- What's the average days-on-market for RENTAL listings here right now (not sales)? A rising rental-DOM trend means longer vacancies and softer asking-rent achievability than the comps imply.
- What's the recent tenant-quality profile in this submarket — average credit score on applications, eviction rate, late-payment / NSF rate, and stable-employment percentage? A property-management company in the area should have these aggregated.
- How much new for-sale + rental construction is in the pipeline within 1–3 miles? Heavy new supply typically softens prices + rents 12–24 months out; constrained supply supports both.
Investment metrics
- 1% rule
- 1.15% ✓
- Cap rate
- 8.87%
- Cash-on-cash
- 9.22%
- DSCR
- 1.41
- GRM
- 7.3
CMA / ARV
No comps found within radius.
Projected returns pro-forma
10.0% appreciation · 3.0% rent growth · sell at horizon
- IRR
- 31.0%
- Equity multiple
- 3.44×
- Total profit
- $136,298
- Equity at exit
- $180,086
- IRR
- 26.8%
- Equity multiple
- 7.79×
- Total profit
- $379,903
- Equity at exit
- $388,362
Cash invested: $55,972 (down + closing). Projections, not guarantees.
Landlord ↔ Tenant lean methodology
- Overall (STATE)
- 87 Strongly Landlord-Friendly
- State Texas
- 87 Strongly Landlord-Friendly · R+5
- County
- — inherits STATE
- City
- — inherits STATE
ZIP-level market 73439
- Home prices YoY
- 12.3%
- Price-to-rent
- 7.3×
Monthly cashflow live
- Estimated rent
- $2,293 medium interval (Pro) →
- Mortgage (P&I)
- −$1,048
- Tax est. 1.5%
- −$250 /mo · $2,998/yr
- Insurance
- −$83
- HOA
- −$0
- Vacancy / Maint / Mgmt
- −$482
- Net cashflow
- $430
Break-even live
Sensitivity live
| Price | -10% $568 | -5% $499 | +0% $430 | +5% $361 | +10% $292 |
|---|---|---|---|---|---|
| Rent | -10% $249 | -5% $340 | +0% $430 | +5% $521 | +10% $611 |
| Rate | -1.0pp $531 | -0.5pp $481 | base $430 | +0.5pp $378 | +1.0pp $326 |
UW: 25.0% down · 7.5% · 30yr · 1.5% tax · 5.0% vac · 8.0% maint · 8.0% mgmt
Financing live
Cash to close
- Down payment
- $49,975
- Closing costs
- $5,997
- Reserves months
- —
- Total cash needed
- —
Loan-product check · same deal, 3 products live
Conventional
25% down · 7.5% · 30yr
- Down + closing
- —
- Monthly P&I
- —
- Monthly cashflow
- —
- DSCR
- —
- Eligible?
- —
Personal DTI + credit; lowest rate.
DSCR
20% down · 8.5% · 30yr
- Down + closing
- —
- Monthly P&I
- —
- Monthly cashflow
- —
- DSCR
- —
- Eligible?
- —
No personal income docs; deal must DSCR.
Hard money
10% down · 12.0% · 12mo
- Down + closing
- —
- Monthly P&I
- —
- Monthly cashflow
- —
- DSCR
- —
- Eligible?
- —
Short-term bridge; refi at stabilization.
Listing history 29 events
-
2026-06-22days on market $199,900 Active 99 DOM
-
2026-06-19days on market $199,900 Active 97 DOM
-
2026-06-18days on market $199,900 Active 96 DOM
-
2026-06-17days on market $199,900 Active 95 DOM
-
2026-06-16days on market $199,900 Active 94 DOM
-
2026-06-15days on market $199,900 Active 93 DOM
-
2026-06-14days on market $199,900 Active 91 DOM
-
2026-06-13days on market $199,900 Active 90 DOM
-
2026-06-10days on market $199,900 Active 88 DOM
-
2026-06-09days on market $199,900 Active 87 DOM
-
2026-06-08days on market $199,900 Active 86 DOM
-
2026-06-07days on market $199,900 Active 85 DOM
-
2026-06-05days on market $199,900 Active 82 DOM
-
2026-06-02days on market $199,900 Active 80 DOM
-
2026-06-01days on market $199,900 Active 79 DOM
-
2026-05-31days on market $199,900 Active 78 DOM
-
2026-05-30days on market $199,900 Active 77 DOM
-
2026-03-14$199,900 Active
-
2026-02-05historical
-
2025-08-06$199,000 Active
-
2025-08-05historical
-
2025-05-28status Active
-
2025-05-13status Pending
-
2025-03-31price $199,900
-
2025-02-06$245,000 Active
-
2024-12-15historical
-
2024-08-04price $244,000
-
2024-06-15$249,000 Active
-
1993-04-23soldstatus $58,500
ⓘ Source: listings_history table (triggers on properties + properties_extension) + one-shot
backfill from property_details.listing_events for pre-trigger history.
Climate risk First Street
- Flood 1/10 Low FEMA zone X · 0% chance over 30 yrs
- Wildfire 4/10 Moderate
- Heat 6/10 Major 7 d/yr ≥110°F today · 20 d/yr by 30 yrs out
- Wind 4/10 Moderate 18% chance of damaging wind over 30 yrs
- Air quality 3/10 Moderate 3 unhealthy d/yr today · 3 by 30 yrs out
Nearby sold comps map
Loading sold comps map…
Walkable amenities ~0.75 mi
Loading nearby amenities…
Taxation est. · year 1
- Rental income
- $27,517
- − Mortgage interest
- −$11,198
- − Property taxes
- −$2,998
- − Insurance
- −$1,000
- − Repairs & maintenance
- −$2,201
- − Management
- −$2,201
- − Depreciation
- −$5,815
- Taxable income
- $2,104
- Est. tax owed @ 24.0%
- −$505
- After-tax cash flow
- $4,656/yr
For passive investors: Depreciation is non-cash, so a rental often shows a tax loss while cash-flowing — sheltering income. Rental losses are passive: they offset passive income freely, and up to $25,000/yr can offset ordinary (W-2) income if you actively participate and your MAGI is under $100k (phasing out to $0 by $150k); unused losses carry forward. On sale, claimed depreciation is recaptured at up to 25%, and gains may owe capital-gains tax (a 1031 exchange can defer both). Figures are a year-1 estimate at your 24.0% rate — not tax advice; consult a CPA.
Schools (NCES district)
- District
- Kingston
- NCES district ID
- 4016590
- Math proficiency
- 27% ▼ -7.00%
- Reading proficiency
- 32% ▼ -7.00%
- Median HH income
- $40,655
- Composite
- 24.88/100
- National rank
- #7585
- State rank
- #70 of 270 in OK
Livability — Sherwood Shores
- Score
- 49/100
- State rank
- #1519
- US rank
- #25941
Category grades
Schools grade is shown separately in the Schools card above.
Census & demographics
- Population (ZIP)
- 7,011
Population outlook (Marshall County) Hauer SSP2
- Today (2025)
- 17,405 people
- By 2030
- 18,038 · +3.6%
- By 2040
- 19,513 · +12.1%
- By 2050
- 21,283 · +22.3%
- By 2075
- 27,884 · +60.2%
- By 2100
- 35,435 · +103.6%
Race, ethnicity, and origin ACS 2023
- Neighborhood character
- Predominantly White (75%)
- Race & ethnicity
- White 75% Two or more races 16% Native American 5% Hispanic / Latino 4%
- Common ancestry
- Lithuanian 3% Italian 2% Serbian 1%
- Foreign-born
- 1% · Canada
- Languages at home
- 97% English-only · Spanish 3%
Political lean MEDSL · Marshall
- 2024 margin
- Solid R (+63.4) · D 17.7% · R 81.2% · Other 1.1%
- 2008→2024 swing
- -24.6pp toward R · 2008: -38.8pp · 2024: -63.4pp
- All cycles
- 2024: R+63.4 2020: R+62.5 2016: R+56.6 2012: R+45.7 2008: R+38.8
Not yet ingested
- Civics
- —
Market trends
- HPI YoY
- ▲ 26.96%
- Current HPI
- 246.2253
- Rent YoY
- —
- Metro
- —
- State GDP YoY
- ▲ 3.95%
- F500 in state
- 110
Industry mix (Fortune 500 HQ in TX)
| Industry | F500 HQs | Revenue |
|---|---|---|
| Energy | 16 | $1,198B |
|
||
| Technology | 5 | $198B |
|
||
| Engineering / Construction | 4 | $72B |
|
||
| Energy Services | 3 | $60B |
|
||
| Utilities | 3 | $41B |
|
||
| Healthcare | 2 | $330B |
|
||
Price history
+241.7% since first listed12 events — show timeline
- 2026-03-14 Listed $199,900 MLS Technology, Inc.
- 2026-02-05 Listing Removed — MLS Technology, Inc.
- 2025-08-06 Listed $199,000 MLS Technology, Inc.
- 2025-08-05 Listing Removed — MLS Technology, Inc.
- 2025-05-28 Relisted — MLS Technology, Inc.
- 2025-05-13 Pending — MLS Technology, Inc.
- 2025-03-31 Price Changed $199,900 MLS Technology, Inc.
- 2025-02-06 Listed $245,000 MLS Technology, Inc.
- 2024-12-15 Listing Removed — MLS Technology, Inc.
- 2024-08-04 Price Changed $244,000 MLS Technology, Inc.
- 2024-06-15 Listed $249,000 MLS Technology, Inc.
- 1993-04-23 Sold (Public Records) $58,500 Public Records
Property tax history
-1.1%/yrLatest (2025): $230 · +0.9% YoY. Source: county tax records.
Cash-flow waterfall
monthlySold comps — $/sqft
last 12 mo · ≤1 miLoading sold comps…