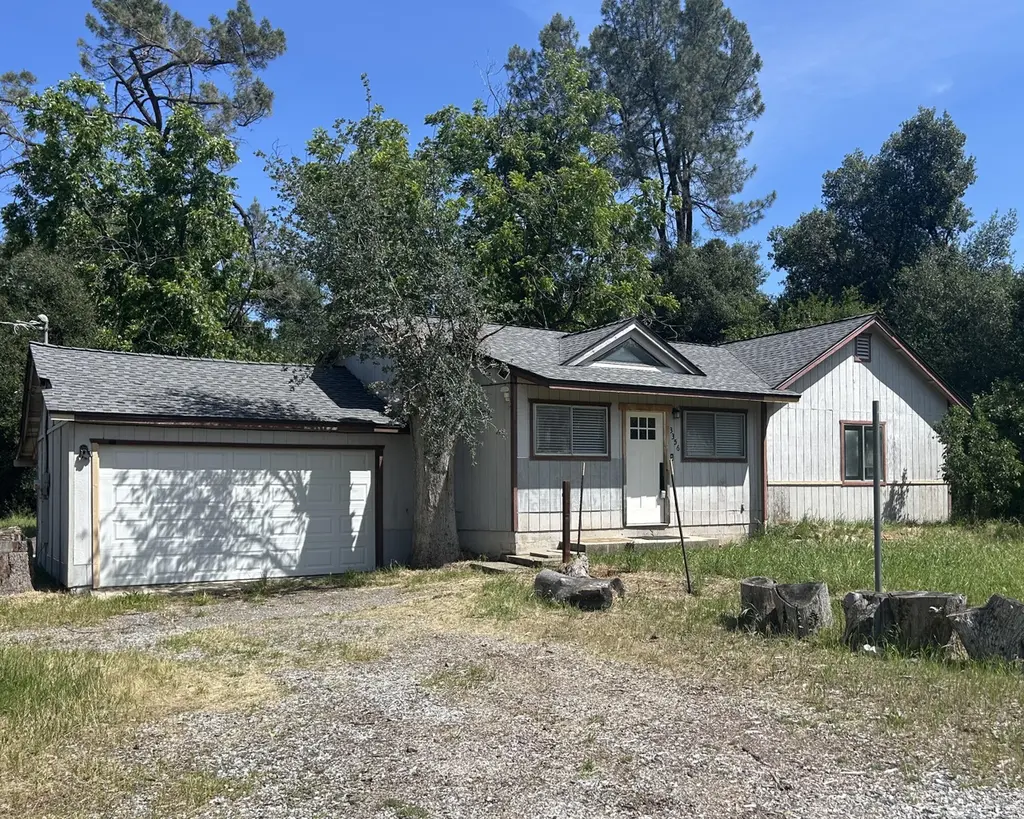
3356 Rancho Rd · Redding, CA
Flood risk 1/10 · Minimal
- FEMA flood zone
- X (unshaded)
- Chance of flooding over 30 yrs
- 0.0%
- Est. flood insurance / yr
- $507 – $1,088
Fire risk 8/10 · Major
- Est. fire insurance / yr
- $659 – $1,223
Heat risk 8/10 · Major
- Hot days now (above 105°F)
- 7 days/yr
- Hot days in 30 yrs
- 16 days/yr
Wind risk 1/10 · Minimal
- Chance of severe wind over 30 yrs
- —
Air-quality risk 10/10 · Severe
- Unhealthy air days now
- 35 days/yr
- Unhealthy air days in 30 yrs
- 42 days/yr
Risk factors via First Street. Map © Google.
Why this score? — see what drove the C grade
The composite is a weighted blend of 9 inputs, each scored 0–100. Each bar is that input's sub-score; the figure is the points it added to the 100-point composite (weight × sub-score).
- Cash flow +19.2/30.0
- ARV discount +15.0/15.0
- DSCR +6.1/10.0
- 1% rule +4.7/10.0
- Schools +4.6/10.0
- Livability +3.8/5.0
- Rent growth +3.0/5.0
- Condition / age +2.5/5.0
- Appreciation +0.0/10.0
$250,000
🖨 Deal sheet 📄 Offer letter ✓ Due diligence
Listing remarks MLS
Country feel with a property that is just minutes away from shopping and transportation. Over a acre property with charming older home with tons of potential here. Brand new roof. Open floor plan, wood stove in living room and all newer appliances in kitchen to stay. Inside laundry / mud room, shop or storage building, 2 car garage with circular driveway. Walnut and grapevines with fenced in property add to the appeal.
Key facts
- 1.2 acre lot
- Garage
- Built 1960
Property features AI
Exterior
- Parking: Off-street parking; 1-car garage
- Utilities: Well water; Septic tank
- Home design: Single-family residence; One story; Raised foundation
- Construction: Composition roof
- Exterior features: Level lot; Asphalt road access
Interior
- Kitchen: Dishwasher; Refrigerator
- Flooring: Tile flooring; Wood flooring
- Bathrooms: 2 full bathrooms
- Heating & cooling: Central air conditioning; Forced air heating; Wood stove
- Interior features: Fireplace in the living room (wood-burning); Dishwasher; Refrigerator
Neighborhood map
What this means for you Summary
Snapshot
- This is a 3-bed/1.0-bath single-family listed at $250k.
Deal economics
- At list price, monthly cash flow is $270 ($3k/yr) — positive.
- The deal already cash-flows at list — no discount required.
- To meet the 1% rule (rent ≥ 1% of price), the offer needs to be $242k (3.1% below list).
- Recommended offer: $242k (3.1% below list) — sets the bar for 1% rule.
- Cap rate 7.6% vs local median 3.3% in Redding — top-decile yield for the area; either an underpriced asset or a hidden risk that comps aren't pricing in. Stress-test before assuming the spread holds.
Location & tenants
- Location reads 76/100 on livability (#106 in CA, #3,726 nationally) — a middle-class / working-renter tenant base. Strengths: amenities A+, commute A+, health & safety A+; Watch: employment C-, crime F, cost of living F.
- Shasta Union High (urban): math 41% / reading 67% proficiency, ranked #122 of 517 in CA (top 24%) — acceptable for families but not a draw, mixed tenant base, ~2y average lease; only 16% free/reduced lunch — higher-income household profile.
- Market conditions: Rents rising (+1.9%/yr); 286 active listings in the ZIP; 3 comparable units currently listed for rent nearby; rentals leasing fast (median 13d on market — plan ~1-2 weeks tenant-placement turnaround); 246 units permitted in Shasta County in 2024 (0 in 5+ unit buildings).
- This rent runs 40% of the median local income ($73k/yr) — at the standard rent-burdened threshold; future hikes will face affordability resistance.
Forward outlook
- Local home prices are declining (-3.0%/yr); year-one equity from $2k of loan paydown is wiped out by about $8k of value loss. Plan a longer hold.
- Shasta County population projected to shrink 9% by 2050 — rents likely to lag national; underwrite the cash flow, not the appreciation.
Negotiation context
- It's been on market 33 days — a 3% lower offer ($242k) is reasonable based on typical stale-listing flexibility.
- 4 sale attempts since 5y ago with the ask held roughly flat each time — persistent listings suggest the price (not the market) is what's stuck; bring a comps-based counter.
Risks & watch-outs
- Climate carrying-cost: severe wildfire risk; extreme-heat days projected 7→16/yr by 2055 (HVAC capex compounding) — expect insurance premiums to compound above CPI over the hold.
Questions for the listing agent
- It's been on market 33 days. Have you received any prior offers? Is the seller open to a 3% concession, seller financing, or rate buy-down credit?
- Built in 1960 — when were the roof, HVAC, electrical panel, plumbing, and water heater last replaced?
- Is there a deadline driving the sale (1031 exchange, divorce, estate, relocation)? That informs how much negotiation room exists.
- Schools are B-rated — typically a magnet for longer-tenancy family renters. What's the average tenant stay here, and is there a school-zone premium baked into asking?
- Crime grade is F in this area — have there been break-ins, vandalism, or insurance claims at this property in the last 3 years? What carrier currently insures it and at what premium?
- What's the average days-on-market for RENTAL listings here right now (not sales)? A rising rental-DOM trend means longer vacancies and softer asking-rent achievability than the comps imply.
- What's the recent tenant-quality profile in this submarket — average credit score on applications, eviction rate, late-payment / NSF rate, and stable-employment percentage? A property-management company in the area should have these aggregated.
- How much new for-sale + rental construction is in the pipeline within 1–3 miles? Heavy new supply typically softens prices + rents 12–24 months out; constrained supply supports both.
Investment metrics
- 1% rule
- 0.97% ✗
- Cap rate
- 7.59%
- Cash-on-cash
- 4.63%
- DSCR
- 1.21
- GRM
- 8.6
CMA / ARV
- ARV (on-the-fly)
- $381,696
- Comps found
- 12
Show comp detail 12 sales within ~0.75 mi
| Address | Dist | Beds/Ba | Sqft | Sold | Price | $/sf | Match |
|---|---|---|---|---|---|---|---|
| 20250 Demac Dr | 0.36mi | 2/2.0 (-1) | 1,248 (-7%) | 1mo | $365,000 | $292 | 61 |
| 2901 Hopkins Ave | 0.56mi | 3/2.0 | 1,501 (+12%) | 2mo | $415,000 | $276 | 48 |
| 2939 Hopkins Ave | 0.53mi | 3/2.0 | 1,501 (+12%) | 5mo | $433,490 | $289 | 48 |
| 3028 Legend Ln | 0.57mi | 3/2.0 | 1,501 (+12%) | 3mo | $426,990 | $284 | 47 |
| 3056 Renault Ct | 0.52mi | 3/2.0 | 1,501 (+12%) | 6mo | $440,000 | $293 | 47 |
| 3012 Legend Ln | 0.59mi | 3/2.0 | 1,501 (+12%) | 3mo | $400,000 | $266 | 46 |
| 5240 Monaco Pkwy | 0.52mi | 3/1.0 | 1,501 (+12%) | 12mo | $438,490 | $292 | 46 |
| 3021 Legend Ln | 0.60mi | 3/2.0 | 1,501 (+12%) | 3mo | $400,000 | $266 | 46 |
| 3049 Renault Ct | 0.54mi | 3/2.0 | 1,501 (+12%) | 6mo | $440,490 | $293 | 46 |
| 3029 Renault Ct | 0.56mi | 3/2.0 | 1,501 (+12%) | 6mo | $425,490 | $283 | 46 |
| 3003 Legend Ln | 0.62mi | 3/2.0 | 1,501 (+12%) | 3mo | $415,990 | $277 | 45 |
| 3009 Renault Ct | 0.58mi | 3/2.0 | 1,501 (+12%) | 7mo | $420,000 | $280 | 44 |
Match score weights: distance 35% · size 25% · config 20% · recency 20%. Top-matched comps best support the ARV.
Projected returns pro-forma
-3.0% appreciation · 1.88% rent growth · sell at horizon
- IRR
- -10.3%
- Equity multiple
- 0.63×
- Total profit
- $-26,006
- Equity at exit
- $37,276
- IRR
- -2.5%
- Equity multiple
- 0.84×
- Total profit
- $-11,365
- Equity at exit
- $21,615
Cash invested: $70,000 (down + closing). Projections, not guarantees.
Landlord ↔ Tenant lean methodology
- Overall (STATE)
- 18 Strongly Tenant-Friendly
- State California
- 18 Strongly Tenant-Friendly · D+13
- County
- — inherits STATE
- City
- — inherits STATE
ZIP-level market 96002
- Rents YoY
- 1.9%
- Active inventory
- 286
- Price-to-rent
- 8.6×
Monthly cashflow live
- Estimated rent
- $2,422 medium interval (Pro) →
- Mortgage (P&I)
- −$1,311
- Tax from tax record
- −$228 /mo · $2,734/yr
- Insurance
- −$104
- HOA
- −$0
- Vacancy / Maint / Mgmt
- −$509
- Net cashflow
- $270
Break-even live
UW: 25.0% down · 7.5% · 30yr · 1.5% tax · 5.0% vac · 8.0% maint · 8.0% mgmt
Financing live
Cash to close
- Down payment
- $62,500
- Closing costs
- $7,500
- Reserves months
- —
- Total cash needed
- —
Loan-product check · same deal, 3 products live
Conventional
25% down · 7.5% · 30yr
- Down + closing
- —
- Monthly P&I
- —
- Monthly cashflow
- —
- DSCR
- —
- Eligible?
- —
Personal DTI + credit; lowest rate.
DSCR
20% down · 8.5% · 30yr
- Down + closing
- —
- Monthly P&I
- —
- Monthly cashflow
- —
- DSCR
- —
- Eligible?
- —
No personal income docs; deal must DSCR.
Hard money
10% down · 12.0% · 12mo
- Down + closing
- —
- Monthly P&I
- —
- Monthly cashflow
- —
- DSCR
- —
- Eligible?
- —
Short-term bridge; refi at stabilization.
Rent comps 3 comps
| Address | Beds | Baths | Sqft | Rent | $/sqft | DOM | Units | Dist |
|---|---|---|---|---|---|---|---|---|
| 5449 Thumb Rock Rd Redding, CA | 4.0 | 2.0 | 1809 | $2,800 | $1.55 | 13d | 1 | 0.57mi |
| 3491 Carlsbad Ln Redding, CA | 3.0 | 2.0 | 1830 | $2,595 | $1.42 | 13d | 1 | 1.30mi |
| 2326 Corona St Redding, CA | 3.0 | 1.0 | 950 | $1,695 | $1.78 | 21d | 1 | 1.48mi |
Listing history 28 events
-
2026-06-19days on market $250,000 Active 33 DOM
-
2026-06-18days on market $250,000 Active 32 DOM
-
2026-06-17days on market $250,000 Active 31 DOM
-
2026-06-16days on market $250,000 Active 30 DOM
-
2026-06-15days on market $250,000 Active 29 DOM
-
2026-06-14days on market $250,000 Active 27 DOM
-
2026-06-12days on market $250,000 Active 26 DOM
-
2026-06-10days on market $250,000 Active 24 DOM
-
2026-06-09days on market $250,000 Active 23 DOM
-
2026-06-08days on market $250,000 Active 22 DOM
-
2026-06-07days on market $250,000 Active 21 DOM
-
2026-06-05days on market $250,000 Active 19 DOM
-
2026-06-03days on market $250,000 Active 17 DOM
-
2026-06-02days on market $250,000 Active 16 DOM
-
2026-06-01days on market $250,000 Active 15 DOM
-
2026-05-31days on market $250,000 Active 14 DOM
-
2026-05-30days on market $250,000 Active 13 DOM
-
2026-05-23status Active
-
2026-05-03status Pending
-
2026-04-27$250,000 Active
-
2025-09-11price $285,000
-
2025-08-26$299,900 Active
-
2021-06-08soldstatus $235,000 423-char remark
Show marketing remark (423 chars)
Country feel with a property that is just minutes away from shopping and transportation. Over a acre property with charming older home with tons of potential here. Brand new roof. Open floor plan, wood stove in living room and all newer appliances in kitchen to stay. Inside laundry / mud room, shop or storage building, 2 car garage with circular driveway. Walnut and grapevines with fenced in property add to the appeal.
-
2021-06-08soldstatus $235,000
Show marketing remark (423 chars)
Country feel with a property that is just minutes away from shopping and transportation. Over a acre property with charming older home with tons of potential here. Brand new roof. Open floor plan, wood stove in living room and all newer appliances in kitchen to stay. Inside laundry / mud room, shop or storage building, 2 car garage with circular driveway. Walnut and grapevines with fenced in property add to the appeal.
-
2021-01-11$259,000 423-char remark
Show marketing remark (423 chars)
Country feel with a property that is just minutes away from shopping and transportation. Over a acre property with charming older home with tons of potential here. Brand new roof. Open floor plan, wood stove in living room and all newer appliances in kitchen to stay. Inside laundry / mud room, shop or storage building, 2 car garage with circular driveway. Walnut and grapevines with fenced in property add to the appeal.
-
2013-10-17soldstatus $160,500
-
2001-06-08soldstatus $119,000
-
1992-04-09soldstatus $88,500
ⓘ Source: listings_history table (triggers on properties + properties_extension) + one-shot
backfill from property_details.listing_events for pre-trigger history.
Tax reassessment forecast CA · Resets to sale price
- Current annual tax
- $2,734 · $228/mo
- Projected year-2 tax
- $2,734 · $228/mo
- Expected delta
- $0/yr ($0/mo · 0.0%)
ⓘ Screening estimate from a state-policy table — verify with the county assessor before closing.
Climate risk First Street
- Flood 1/10 Low FEMA zone X (unshaded) · 0% chance over 30 yrs
- Wildfire 8/10 Severe
- Heat 8/10 Severe 7 d/yr ≥105°F today · 16 d/yr by 30 yrs out
- Wind 1/10 Low
- Air quality 10/10 Extreme 35 unhealthy d/yr today · 42 by 30 yrs out
Nearby sold comps map
Loading sold comps map…
Walkable amenities ~0.75 mi
Loading nearby amenities…
Taxation est. · year 1
- Rental income
- $29,065
- − Mortgage interest
- −$14,004
- − Property taxes
- −$2,734
- − Insurance
- −$1,250
- − Repairs & maintenance
- −$2,325
- − Management
- −$2,325
- − Depreciation
- −$7,273
- Taxable loss
- −$847
- Est. tax savings @ 24.0%
- +$203
- After-tax cash flow
- $3,448/yr
For passive investors: Depreciation is non-cash, so a rental often shows a tax loss while cash-flowing — sheltering income. Rental losses are passive: they offset passive income freely, and up to $25,000/yr can offset ordinary (W-2) income if you actively participate and your MAGI is under $100k (phasing out to $0 by $150k); unused losses carry forward. On sale, claimed depreciation is recaptured at up to 25%, and gains may owe capital-gains tax (a 1031 exchange can defer both). Figures are a year-1 estimate at your 24.0% rate — not tax advice; consult a CPA.
Schools (NCES district)
- District
- Shasta Union High
- NCES district ID
- 0636600
- Math proficiency
- 41% ▲ 3.00%
- Reading proficiency
- 67% ▲ 9.00%
- Median HH income
- $50,080
- Composite
- 46.01/100
- National rank
- #2532
- State rank
- #122 of 517 in CA
Livability — Redding
- Score
- 76/100
- State rank
- #106
- US rank
- #3726
Category grades
Schools grade is shown separately in the Schools card above.
Census & demographics
- County
- Shasta County · 147,641 people
- City population
- 112,523
- Metro
- Redding, CA
- Population (ZIP)
- 33,783
- Household income
- $73,222
- Rent vs Own
- Severe rent burden
- 1026.0
Population outlook (Shasta County) Hauer SSP2
- Today (2025)
- 179,231 people
- By 2030
- 176,953 · -1.3%
- By 2040
- 169,982 · -5.2%
- By 2050
- 162,547 · -9.3%
- By 2075
- 145,649 · -18.7%
- By 2100
- 123,025 · -31.4%
Race, ethnicity, and origin ACS 2023
- Neighborhood character
- Predominantly White (72%)
- Race & ethnicity
- White 72% Hispanic / Latino 13% Two or more races 12% Asian 6% Native American 2% Black 1%
- Hispanic origin (detail)
- Mexican 10%
- Common ancestry
- Italian 4% Lithuanian 2% Slovak 2%
- Foreign-born
- 5% · Canada
- Languages at home
- 91% English-only · Spanish 4% Other Asian/Pacific 2% Other Indo-European 1%
Political lean MEDSL · Shasta
- 2024 margin
- Solid R (+36.5) · D 30.5% · R 67.0% · Other 2.5%
- 2008→2024 swing
- -10.7pp toward R · 2008: -25.8pp · 2024: -36.5pp
- All cycles
- 2024: R+36.5 2020: R+33.1 2016: R+37.4 2012: R+30.3 2008: R+25.8
Not yet ingested
- Civics
- —
Market trends
- HPI YoY
- ▼ -248.70%
- Current HPI
- 319.713
- Rent YoY
- ▲ 1.88%
- Metro
- Redding, CA
- State GDP YoY
- ▲ 3.21%
- F500 in state
- 116
Industry mix (Fortune 500 HQ in CA)
| Industry | F500 HQs | Revenue |
|---|---|---|
| Technology | 27 | $1,492B |
|
||
| Financial Services | 3 | $174B |
|
||
| Retail | 3 | $44B |
|
||
| Insurance | 3 | $26B |
|
||
| Media / Entertainment | 2 | $115B |
|
||
| Pharmaceuticals / Biotech | 2 | $62B |
|
||
Price history
+182.5% since first listed11 events — show timeline
- 2026-05-23 Relisted — SAOR
- 2026-05-03 Pending — SAOR
- 2026-04-27 Listed $250,000 SAOR
- 2025-09-11 Price Changed $285,000 SAOR
- 2025-08-26 Listed $299,900 SAOR
- 2021-06-08 Sold (Public Records) $235,000 Public Records
- 2021-06-08 Sold (MLS) $235,000 SAOR
- 2021-01-11 Listed $259,000 SAOR
- 2013-10-17 Sold (Public Records) $160,500 Public Records
- 2001-06-08 Sold (Public Records) $119,000 Public Records
- 1992-04-09 Sold (Public Records) $88,500 Public Records
Property tax history
+4.4%/yrLatest (2025): $2,734 · +1.2% YoY. Source: county tax records.
Cash-flow waterfall
monthlySold comps — $/sqft
last 12 mo · ≤1 miLoading sold comps…