2211 W 3rd St · Waterloo, IA
Flood risk 1/10 · Minimal
- FEMA flood zone
- X (unshaded)
- Chance of flooding over 30 yrs
- 0.0%
- Est. flood insurance / yr
- $473 – $860
Fire risk 3/10 · Minor
- Est. fire insurance / yr
- $902 – $1,676
Heat risk 3/10 · Minor
- Hot days now (above 101°F)
- 7 days/yr
- Hot days in 30 yrs
- 16 days/yr
Wind risk 2/10 · Minimal
- Chance of severe wind over 30 yrs
- —
Air-quality risk 1/10 · Minimal
- Unhealthy air days now
- 0 days/yr
- Unhealthy air days in 30 yrs
- 0 days/yr
Risk factors via First Street. Map © Google.
Why this score? — see what drove the D grade
The composite is a weighted blend of 9 inputs, each scored 0–100. Each bar is that input's sub-score; the figure is the points it added to the 100-point composite (weight × sub-score).
- Cash flow +11.7/30.0
- ARV discount +9.9/15.0
- Schools +4.4/10.0
- Livability +4.0/5.0
- 1% rule +3.6/10.0
- Rent growth +3.5/5.0
- DSCR +3.4/10.0
- Condition / age +2.5/5.0
- Appreciation +0.0/10.0
$164,000
🖨 Deal sheet (PDF) 📄 Offer letter ✓ Due diligence
Listing remarks MLS
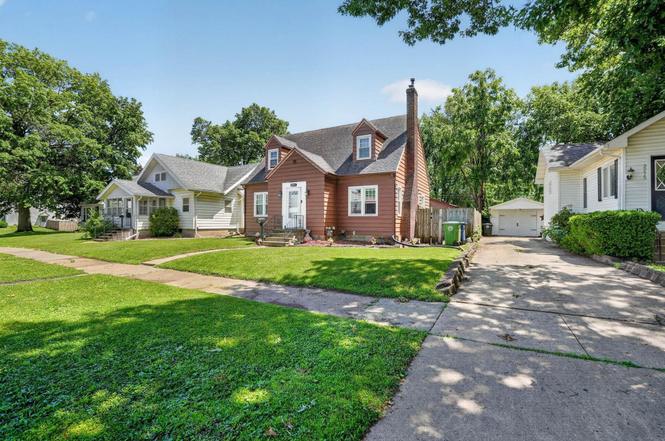
Check out this 3 bedroom 2 bath home walking distance to the local park, public pool, and golf course. This home has everything you want from the inviting living room with beautiful hardwood floors, coved ceilings and a charming fireplace to the spacious dining room to host all your friends and family. The spectacular primary suite on the second floor with vaulted ceilings, an attached bath, a separate sitting room with additional space for an office, offers that perfect oasis to end your day or enjoy your morning coffee. Updates include: Rainsoft water softener and filtration system, vinyl windows, furnace/central air, garage doors, and spray foam insulation in the attic and upstairs walls.
Key facts
- Spacious dining room
- Cozy fireplace
- Coved ceilings
Tags
Property features AI
Exterior
- Parking: Detached carport with 2 spaces
- Utilities: Public water; Public sewer
- Home design: Residential single-family home; R-2 zoning
- Construction: Aluminum siding; Asphalt roof; Basement: block construction, unfinished
- Exterior features: Fenced yard; Alley access with paved road
Interior
- Flooring: Hardwood
- Bathrooms: 2 full bathrooms
- Heating & cooling: Central air conditioning; Forced air heating (natural gas)
- Interior features: Hardwood flooring; Fireplace (1)
- Laundry & utility: Laundry located on the lower level; Unfinished block basement
Neighborhood map
What this means for you Summary
Snapshot
- This is a 4-bed/2.0-bath single-family listed at $164k.
Deal economics
- At list price, monthly cash flow is $-48 ($-580/yr) — negative.
- To cash-flow at today's rent, offer at most $155k (5.2% below list).
- To meet the 1% rule (rent ≥ 1% of price), the offer needs to be $141k (13.8% below list).
- Recommended offer: $141k (13.8% below list) — sets the bar for 1% rule.
- Cap rate 5.9% vs local median 4.2% in Waterloo — top-decile yield for the area; either an underpriced asset or a hidden risk that comps aren't pricing in. Stress-test before assuming the spread holds.
Location & tenants
- Location reads 81/100 on livability (#74 in IA, #1,589 nationally) — a professional / high-income tenant draw. Strengths: commute A+, cost of living A+, housing A+; Watch: crime F, employment D-.
- Waterloo Community School District (urban): math 50% / reading 54% proficiency, ranked #276 of 289 in IA (top 96%) — acceptable for families but not a draw, mixed tenant base, ~2y average lease.
- Zoned schools: Kingsley Elementary School (math 67% / reading 67%, grade B+, #273 of 616 statewide, top 51%, 343 students, 53% FRL); Hoover Middle School (math 68% / reading 72%, grade A, #112 of 246 statewide, top 45%, 883 students, 59% FRL); West High School (math 55% / reading 63%, grade C+, #273 of 336 statewide, top 81%, 1,652 students, 62% FRL) — zoned schools at 58% FRL track the district average.
- Zoned-school proficiency averages 65% at this address vs 52% district-wide (+13 pts) — the actual schools serving this property are materially stronger than the Waterloo Community School District average implies; a family-tenant draw the district grade alone would hide.
- Market conditions: Rents rising (+3.8%/yr); 285 active listings in the ZIP; 11 comparable units currently listed for rent nearby; rentals lingering (median 45d on market — plan ~5-8 weeks vacancy on turnover, expect pricing pressure); 64% of comp listings sitting > 30 days — soft ceiling on asking rent; 287 units permitted in Black Hawk County in 2024 (67 in 5+ unit buildings).
Forward outlook
- Local home prices are declining (-3.0%/yr); year-one equity from $1k of loan paydown is wiped out by about $5k of value loss. Plan a longer hold.
- Black Hawk County population projected at +10% by 2050 — modest demand growth; plan on rents tracking national, not racing it.
Negotiation context
- Only 2 days on market — expect competitive offers; lowballing is unlikely to land.
- 3 sale attempts since 11y ago with the ask held roughly flat each time — persistent listings suggest the price (not the market) is what's stuck; bring a comps-based counter.
Risks & watch-outs
- Watch-outs: built in 1942 — expect roof / HVAC / electrical / plumbing capex.
Questions for the listing agent
- What do current leases actually rent for vs. the listed asking? Can we see a recent rent roll and the last 12 months of T-12 income?
- Built in 1942 — when were the roof, HVAC, electrical panel, plumbing, and water heater last replaced?
- Is there a deadline driving the sale (1031 exchange, divorce, estate, relocation)? That informs how much negotiation room exists.
- Crime grade is F in this area — have there been break-ins, vandalism, or insurance claims at this property in the last 3 years? What carrier currently insures it and at what premium?
- The area grade is low — what's the realistic commute time and amenity access for the typical tenant pool here? Any planned neighborhood developments (good or bad) we should know about?
- What's the average days-on-market for RENTAL listings here right now (not sales)? A rising rental-DOM trend means longer vacancies and softer asking-rent achievability than the comps imply.
- What's the recent tenant-quality profile in this submarket — average credit score on applications, eviction rate, late-payment / NSF rate, and stable-employment percentage? A property-management company in the area should have these aggregated.
- How much new for-sale + rental construction is in the pipeline within 1–3 miles? Heavy new supply typically softens prices + rents 12–24 months out; constrained supply supports both.
Investment metrics
- 1% rule
- 0.86% ✗
- Cap rate
- 5.94%
- Cash-on-cash
- -1.26%
- DSCR
- 0.94
- GRM
- 9.7
CMA / ARV
- ARV (on-the-fly)
- $173,201
- Comps found
- 12
Show comp detail 12 sales within ~0.75 mi
| Address | Dist | Beds/Ba | Sqft | Sold | Price | $/sf | Match |
|---|---|---|---|---|---|---|---|
| 520 Kingsley Ave | 0.27mi | 4/2.0 | 1,655 (+4%) | 3mo | $162,000 | $98 | 78 |
| 411 Kingsley Ave | 0.38mi | 4/3.0 | 1,541 (-3%) | 7mo | $167,500 | $109 | 68 |
| 928 Kingsley Ave Ave | 0.14mi | 3/1.0 (-1) | 1,412 (-11%) | 1mo | $89,000 | $63 | 65 |
| 217 Reber Ave | 0.50mi | 3/1.0 (-1) | 1,582 (-0%) | 8mo | $123,000 | $78 | 61 |
| 203 Kingbard Blvd | 0.43mi | 3/1.0 (-1) | 1,632 (+3%) | 7mo | $154,900 | $95 | 60 |
| 215 Frederic Ave | 0.64mi | 3/1.5 (-1) | 1,506 (-5%) | 3mo | $210,500 | $140 | 52 |
| 418 Bayard St | 0.62mi | 3/1.0 (-1) | 1,456 (-8%) | 5mo | $35,000 | $24 | 44 |
| 928 Kimball Ave. Ave | 0.60mi | 3/1.5 (-1) | 1,425 (-10%) | 5mo | $183,000 | $128 | 44 |
| 1318 W 2nd St | 0.64mi | 4/2.0 | 1,804 (+14%) | 6mo | $53,000 | $29 | 42 |
| 129 Graceline Blvd | 0.57mi | 3/2.0 (-1) | 1,796 (+13%) | 8mo | $210,000 | $117 | 40 |
| 150 Hawthorne Ave | 0.74mi | 3/1.0 (-1) | 1,363 (-14%) | 3mo | $187,000 | $137 | 30 |
| 2033 Casper Ave | 0.69mi | 3/1.0 (-1) | 1,360 (-14%) | 8mo | $159,000 | $117 | 28 |
Match score weights: distance 35% · size 25% · config 20% · recency 20%. Top-matched comps best support the ARV.
Projected returns pro-forma
-3.0% appreciation · 3.8% rent growth · sell at horizon
- IRR
- -17.4%
- Equity multiple
- 0.38×
- Total profit
- $-28,469
- Equity at exit
- $24,453
- IRR
- -8.0%
- Equity multiple
- 0.48×
- Total profit
- $-23,810
- Equity at exit
- $14,180
Cash invested: $45,920 (down + closing). Projections, not guarantees.
Landlord ↔ Tenant lean methodology
- Overall (STATE)
- 83 Strongly Landlord-Friendly
- State Iowa
- 83 Strongly Landlord-Friendly · R+6
- County
- — inherits STATE
- City
- — inherits STATE
ZIP-level market 50701
- Rents YoY
- 3.8%
- Active inventory
- 285
- Price-to-rent
- 9.7×
Monthly cashflow live
- Estimated rent
- $1,413 high interval (Pro) →
- Mortgage (P&I)
- −$860
- Tax from tax record
- −$236 /mo · $2,836/yr
- Insurance
- −$68
- HOA
- −$0
- Vacancy / Maint / Mgmt
- −$297
- Net cashflow
- $-48
Break-even live
Sensitivity live
| Price | -10% $44 | -5% $-2 | +0% $-48 | +5% $-95 | +10% $-141 |
|---|---|---|---|---|---|
| Rent | -10% $-160 | -5% $-104 | +0% $-48 | +5% $7 | +10% $63 |
| Rate | -1.0pp $34 | -0.5pp $-7 | base $-48 | +0.5pp $-91 | +1.0pp $-134 |
UW: 25.0% down · 7.5% · 30yr · 1.5% tax · 5.0% vac · 8.0% maint · 8.0% mgmt
Financing live
Cash to close
- Down payment
- $41,000
- Closing costs
- $4,920
- Reserves months
- —
- Total cash needed
- —
Loan-product check · same deal, 3 products live
Conventional
25% down · 7.5% · 30yr
- Down + closing
- —
- Monthly P&I
- —
- Monthly cashflow
- —
- DSCR
- —
- Eligible?
- —
Personal DTI + credit; lowest rate.
DSCR
20% down · 8.5% · 30yr
- Down + closing
- —
- Monthly P&I
- —
- Monthly cashflow
- —
- DSCR
- —
- Eligible?
- —
No personal income docs; deal must DSCR.
Hard money
10% down · 12.0% · 12mo
- Down + closing
- —
- Monthly P&I
- —
- Monthly cashflow
- —
- DSCR
- —
- Eligible?
- —
Short-term bridge; refi at stabilization.
Rent comps 11 comps
| Address | Beds | Baths | Sqft | Rent | $/sqft | DOM | Units | Dist |
|---|---|---|---|---|---|---|---|---|
| 2539 W 3rd St Waterloo, IA | 3.0 | 2.5 | 1200 | $1,695 | $1.41 | 22d | 1 | 0.30mi |
| 1014 Fletcher Ave Waterloo, IA | 4.0 | 3.5 | 2123 | $2,450 | $1.15 | 45d | 1 | 0.43mi |
| 719 Marsh St Waterloo, IA | 3.0 | 1.0 | 1224 | $1,100 | $0.90 | 22d | 1 | 0.50mi |
| 616 Kimball Ave Waterloo, IA | 3.0 | 1.0 | 1302 | $1,100 | $0.84 | 45d | 1 | 0.54mi |
| 1427 W 2nd St Waterloo, IA | 3.0 | 1.0 | 1248 | $1,250 | $1.00 | 45d | 1 | 0.57mi |
| 416 Sunnyside Ave Waterloo, IA | 3.0 | 1.0 | 1200 | $825 | $0.69 | 45d | 1 | 0.95mi |
| 418 Sunnyside Ave Waterloo, IA | 3.0 | 1.0 | 1200 | $675 | $0.56 | 45d | 1 | 0.95mi |
| 905 Baltimore St Waterloo, IA | 3.0 | 1.5 | 1392 | $1,025 | $0.74 | 45d | 1 | 0.96mi |
| 2215 Falls Ave Waterloo, IA | 3.0 | 1.0 | 1290 | $1,400 | $1.09 | 45d | 1 | 1.04mi |
| 1247 Doreen Ave Waterloo, IA | 4.0 | 1.0 | 1288 | $1,500 | $1.16 | 22d | 1 | 1.08mi |
| 1141 Lantern Sq Waterloo, IA | 2.0–3.0 | 1.5 | 1119 | $1,200 | $1.07 | 22d | 5 | 1.45mi |
Listing history 4 events
-
2026-06-19status $164,000 Pending 2 DOM
-
2026-06-18days on market $164,000 Active 2 DOM
-
2026-06-17remarks 699-char remark
-
2026-06-17$164,000 Active 1 DOM
ⓘ Source: listings_history table (triggers on properties + properties_extension) + one-shot
backfill from property_details.listing_events for pre-trigger history.
Tax reassessment forecast IA · Partial reset (capped growth)
- Current annual tax
- $2,836 · $236/mo
- Projected year-2 tax
- $2,836 · $236/mo
- Expected delta
- $0/yr ($0/mo · 0.0%)
ⓘ Screening estimate from a state-policy table — verify with the county assessor before closing.
Climate risk First Street
- Flood 1/10 Low FEMA zone X (unshaded) · 0% chance over 30 yrs
- Wildfire 3/10 Moderate
- Heat 3/10 Moderate 7 d/yr ≥101°F today · 16 d/yr by 30 yrs out
- Wind 2/10 Low
- Air quality 1/10 Low 0 unhealthy d/yr today · 0 by 30 yrs out
Nearby sold comps map
Loading sold comps map…
Walkable amenities ~0.75 mi
Loading nearby amenities…
Taxation est. · year 1
- Rental income
- $16,957
- − Mortgage interest
- −$9,187
- − Property taxes
- −$2,836
- − Insurance
- −$820
- − Repairs & maintenance
- −$1,357
- − Management
- −$1,357
- − Depreciation
- −$4,771
- Taxable loss
- −$3,370
- Est. tax savings @ 24.0%
- +$809
- After-tax cash flow
- $228/yr
For passive investors: Depreciation is non-cash, so a rental often shows a tax loss while cash-flowing — sheltering income. Rental losses are passive: they offset passive income freely, and up to $25,000/yr can offset ordinary (W-2) income if you actively participate and your MAGI is under $100k (phasing out to $0 by $150k); unused losses carry forward. On sale, claimed depreciation is recaptured at up to 25%, and gains may owe capital-gains tax (a 1031 exchange can defer both). Figures are a year-1 estimate at your 24.0% rate — not tax advice; consult a CPA.
Schools (NCES district)
- District
- Waterloo Community School District
- NCES district ID
- 1930480
- Math proficiency
- 50% ▼ -4.00%
- Reading proficiency
- 54% ▲ 1.00%
- Median HH income
- $42,545
- Composite
- 43.72/100
- National rank
- #2950
- State rank
- #276 of 289 in IA
Livability — Waterloo
- Score
- 81/100
- State rank
- #74
- US rank
- #1589
Category grades
Schools grade is shown separately in the Schools card above.
Census & demographics
- Census place
- Waterloo, IA
- County
- Black Hawk County · 112,933 people
- City population
- 69,066
- Metro
- Waterloo-Cedar Falls, IA
- Population (ZIP)
- 30,232
- Household income
- $61,475
- Rent vs Own
- Severe rent burden
- 1377.0
Population outlook (Black Hawk County) Hauer SSP2
- Today (2025)
- 139,716 people
- By 2030
- 142,853 · +2.2%
- By 2040
- 147,843 · +5.8%
- By 2050
- 153,247 · +9.7%
- By 2075
- 167,977 · +20.2%
- By 2100
- 177,320 · +26.9%
Race, ethnicity, and origin ACS 2023
- Neighborhood character
- Predominantly White (78%)
- Race & ethnicity
- White 78% Black 11% Two or more races 5% Hispanic / Latino 3% Asian 3%
- Common ancestry
- Portuguese 3% Italian 3% American 2%
- Foreign-born
- 7% · Canada, South Korea, Vietnam
- Languages at home
- 92% English-only · Russian/Polish/Slavic 2% Spanish 2% French/Haitian/Cajun 2%
Political lean MEDSL · Black Hawk
- 2024 margin
- Toss-up / Even · D 50.0% · R 48.8% · Other 1.2%
- 2008→2024 swing
- -21.3pp toward R · 2008: 22.4pp · 2024: 1.2pp
- All cycles
- 2024: D+1.2 2020: D+9.0 2016: D+7.3 2012: D+20.0 2008: D+22.4
Not yet ingested
- Civics
- —
Market trends
- HPI YoY
- ▼ -107.19%
- Current HPI
- 162.8951
- Rent YoY
- ▲ 3.80%
- Metro
- Waterloo-Cedar Falls, IA
- State GDP YoY
- ▲ 2.48%
- F500 in state
- 4
Industry mix (Fortune 500 HQ in IA)
| Industry | F500 HQs | Revenue |
|---|---|---|
| Financial Services | 1 | $16B |
|
||
| Retail / Convenience | 1 | $15B |
|
||
Price history
+46.4% since first listed6 events — show timeline
- 2026-06-17 Listed $164,000 NEIRBR as distributed by MLS GRID
- 2022-06-17 Sold (MLS) $170,000 NEIRBR as distributed by MLS GRID
- 2022-05-05 Listed $142,000 NEIRBR as distributed by MLS GRID
- 2016-05-24 Sold (Public Records) $112,000 Public Records
- 2016-05-20 Sold (MLS) $112,000 NEIRBR as distributed by MLS GRID
- 2015-12-30 Listed $112,000 NEIRBR as distributed by MLS GRID
Property tax history
+2.1%/yrLatest (2025): $2,836 · +8.7% YoY. Source: county tax records.
Cash-flow waterfall
monthlySold comps — $/sqft
last 12 mo · ≤1 miLoading sold comps…