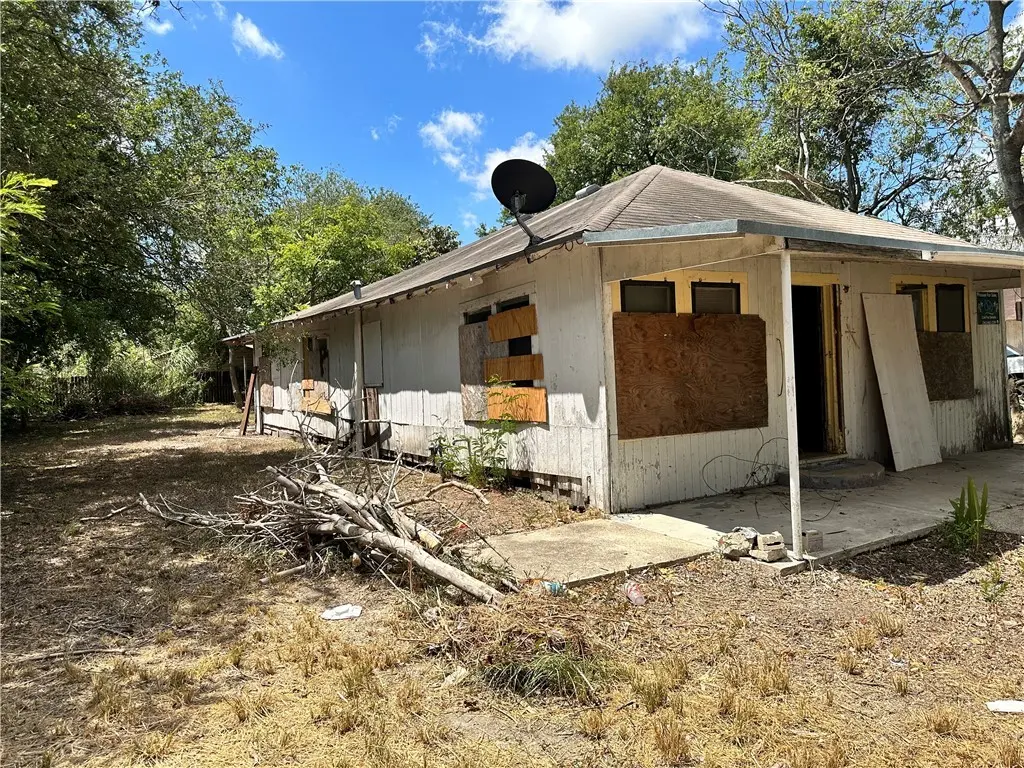
1311-1315 Morris Ave · Corpus Christi, TX
Flood risk 3/10 · Minor
- FEMA flood zone
- X (unshaded)
- Chance of flooding over 30 yrs
- 0.2%
- Est. flood insurance / yr
- $507 – $1,088
Fire risk 1/10 · Minimal
- Est. fire insurance / yr
- $1,222 – $2,270
Heat risk 10/10 · Severe
- Hot days now (above 107°F)
- 7 days/yr
- Hot days in 30 yrs
- 26 days/yr
Wind risk 9/10 · Severe
- Chance of severe wind over 30 yrs
- 99.0%
Air-quality risk 1/10 · Minimal
- Unhealthy air days now
- 0 days/yr
- Unhealthy air days in 30 yrs
- 0 days/yr
Risk factors via First Street. Map © Google.
Why this score? — see what drove the A- grade
The composite is a weighted blend of 9 inputs, each scored 0–100. Each bar is that input's sub-score; the figure is the points it added to the 100-point composite (weight × sub-score).
- Cash flow +30.0/30.0
- ARV discount +15.0/15.0
- 1% rule +10.0/10.0
- DSCR +10.0/10.0
- Appreciation +6.7/10.0
- Livability +3.9/5.0
- Rent growth +2.9/5.0
- Schools +2.8/10.0
- Condition / age +2.5/5.0
$115,000
🖨 Deal sheet 📄 Offer letter ✓ Due diligence
Listing remarks
Looking for a prime investment opportunity within walking distance to downtown and the water? Look no further than these lots with great potential to fully renovate its existing homes or build a creative investment property. Less than a 5 minute drive to the T-heads, Cole Park, great downtown restaurants & more, the possibilities are endless for this location. There are 3 lots for sale side by-side ready and waiting for your vision (2 of the lots have homes on them that could be fully renovated from the studs up). 1311- 3 bed 1.5 bath & 1315- a corner lot with a 2 bedroom, 2 full bath home has multiple entry points from the street great for multiple units.
Key facts
- 7,736 sq ft lot
- Built 1955
- Listed 43 days
Property features AI
Exterior
- Parking: Front entry parking; On-street parking
- Utilities: Overhead utilities; Public water; Public sewer (sewer available)
- Home design: Single-story; Faces north; Pillar/post/pier foundation
- Construction: Wood siding; Shingle roof; Built on pillar/post/pier foundation
- Exterior features: Covered patio; Patio; Chain link fencing; Interior lot
Interior
- Bathrooms: 3 full bathrooms; 1 half bathroom
- Interior features: No additional interior features listed
Neighborhood map
What this means for you Summary
Snapshot
- This is a 5-bed/3.5-bath single-family listed at $115k.
Deal economics
- At list price, monthly cash flow is $658 ($8k/yr) — positive.
- The deal already cash-flows at list — no discount required.
- Meets the 1% rule at list price ($2k rent vs $115k).
- Recommended offer: $112k (3.0% below list) — sets the bar for market timing.
- Cap rate 13.2% vs local median 3.6% in Corpus Christi — top-decile yield for the area; either an underpriced asset or a hidden risk that comps aren't pricing in. Stress-test before assuming the spread holds.
Location & tenants
- Location reads 78/100 on livability (#66 in TX, #2,404 nationally) — a middle-class / working-renter tenant base. Strengths: commute A+, cost of living A+, housing A+; Watch: crime F.
- Corpus Christi ISD (urban): math 31% / reading 35% proficiency, ranked #562 of 826 in TX (top 68%) — families likely to look elsewhere, expect single-tenant / working-renter base with shorter leases; 63% free/reduced lunch — lower-income household profile, screen leases tightly.
- Market conditions: Rents rising (+1.6%/yr); 39 active listings in the ZIP; lower-income renter base — watch delinquency; 1,397 units permitted in Nueces County in 2024 (47 in 5+ unit buildings).
- At $1,760/mo this rent would consume 52% of the median local household income ($41k/yr) (locally 336% of renters already pay >50% of income on rent) — very limited rent-growth headroom before tenants either downsize or default.
Forward outlook
- In year one you build about $5k of equity ($795 loan paydown + $4k appreciation (3.4% local appreciation)).
- Nueces County population projected at +36% by 2050 — long-run rental-demand tailwind backs the buy-and-hold thesis.
- At projected returns (3.4% appreciation + 1.6% rent growth), your $32k cash investment doubles in ~3 years — after that, you're playing with house money.
- By year 8, paydown + projected appreciation supports a ~$35k cash-out refi (75% LTV) — recoverable capital for the next deal without selling this one.
Negotiation context
- It's been on market 43 days — a 3% lower offer ($112k) is reasonable based on typical stale-listing flexibility.
- 6 sale attempts since 3y ago; this cycle's ask has dropped $10k (8%) from the opening price — seller is motivated, your offer sets the floor, not the list.
Risks & watch-outs
- Watch-outs: built in 1955 — expect roof / HVAC / electrical / plumbing capex.
- Climate carrying-cost: severe wind risk, 99% chance of damaging wind over 30y; extreme-heat days projected 7→26/yr by 2055 (HVAC capex compounding) — expect insurance premiums to compound above CPI over the hold.
Questions for the listing agent
- It's been on market 43 days. Have you received any prior offers? Is the seller open to a 3% concession, seller financing, or rate buy-down credit?
- Built in 1955 — when were the roof, HVAC, electrical panel, plumbing, and water heater last replaced?
- Is there a deadline driving the sale (1031 exchange, divorce, estate, relocation)? That informs how much negotiation room exists.
- Crime grade is F in this area — have there been break-ins, vandalism, or insurance claims at this property in the last 3 years? What carrier currently insures it and at what premium?
- What's the average days-on-market for RENTAL listings here right now (not sales)? A rising rental-DOM trend means longer vacancies and softer asking-rent achievability than the comps imply.
- What's the recent tenant-quality profile in this submarket — average credit score on applications, eviction rate, late-payment / NSF rate, and stable-employment percentage? A property-management company in the area should have these aggregated.
- How much new for-sale + rental construction is in the pipeline within 1–3 miles? Heavy new supply typically softens prices + rents 12–24 months out; constrained supply supports both.
Investment metrics
- 1% rule
- 1.53% ✓
- Cap rate
- 13.16%
- Cash-on-cash
- 24.52%
- DSCR
- 2.09
- GRM
- 5.4
CMA / ARV
- ARV (median comp)
- $190,486
- List price
- $115,000
- Delta
- -39.63%
- Verdict
- UNDERPRICED
- Comps
- 6 within 1.0 mi
Projected returns pro-forma
3.37% appreciation · 1.63% rent growth · sell at horizon
- IRR
- 30.3%
- Equity multiple
- 2.73×
- Total profit
- $55,645
- Equity at exit
- $54,138
- IRR
- 29.7%
- Equity multiple
- 5.14×
- Total profit
- $133,448
- Equity at exit
- $85,374
Cash invested: $32,200 (down + closing). Projections, not guarantees.
Landlord ↔ Tenant lean methodology
- Overall (STATE)
- 87 Strongly Landlord-Friendly
- State Texas
- 87 Strongly Landlord-Friendly · R+5
- County
- — inherits STATE
- City
- — inherits STATE
ZIP-level market 78401
- Home prices YoY
- 3.8%
- Rents YoY
- 1.6%
- Active inventory
- 39
- Price-to-rent
- 5.4×
Monthly cashflow live
- Estimated rent
- $1,760 medium interval (Pro) →
- Mortgage (P&I)
- −$603
- Tax from tax record
- −$81 /mo · $976/yr
- Insurance
- −$48
- HOA
- −$0
- Vacancy / Maint / Mgmt
- −$370
- Net cashflow
- $658
Break-even live
UW: 25.0% down · 7.5% · 30yr · 1.5% tax · 5.0% vac · 8.0% maint · 8.0% mgmt
Financing live
Cash to close
- Down payment
- $28,750
- Closing costs
- $3,450
- Reserves months
- —
- Total cash needed
- —
Loan-product check · same deal, 3 products live
Conventional
25% down · 7.5% · 30yr
- Down + closing
- —
- Monthly P&I
- —
- Monthly cashflow
- —
- DSCR
- —
- Eligible?
- —
Personal DTI + credit; lowest rate.
DSCR
20% down · 8.5% · 30yr
- Down + closing
- —
- Monthly P&I
- —
- Monthly cashflow
- —
- DSCR
- —
- Eligible?
- —
No personal income docs; deal must DSCR.
Hard money
10% down · 12.0% · 12mo
- Down + closing
- —
- Monthly P&I
- —
- Monthly cashflow
- —
- DSCR
- —
- Eligible?
- —
Short-term bridge; refi at stabilization.
Listing history 28 events
-
2026-06-18days on market $115,000 Active 43 DOM
-
2026-06-17days on market $115,000 Active 42 DOM
-
2026-06-16days on market $115,000 Active 41 DOM
-
2026-06-15days on market $115,000 Active 40 DOM
-
2026-06-14days on market $115,000 Active 38 DOM
-
2026-06-10days on market $115,000 Active 35 DOM
-
2026-06-09days on market $115,000 Active 34 DOM
-
2026-06-08days on market $115,000 Active 33 DOM
-
2026-06-07days on market $115,000 Active 32 DOM
-
2026-06-05days on market $115,000 Active 29 DOM
-
2026-06-03days on market $115,000 Active 28 DOM
-
2026-06-02days on market $115,000 Active 27 DOM
-
2026-06-01days on market $115,000 Active 26 DOM
-
2026-05-31days on market $115,000 Active 25 DOM
-
2026-05-30days on market $115,000 Active 24 DOM
-
2026-05-06$125,000 Active 677-char remark
-
2026-01-30status Active
-
2025-12-12status Pending
-
2025-12-06historical
-
2025-11-14$45,000 Active
-
2025-11-09historical
-
2025-10-29$45,000 Active
-
2024-01-15status Active
-
2024-01-03historical Active Under Contract
-
2023-12-21price $59,000
-
2023-08-11$65,000 Active
-
2022-04-19soldstatus
-
1999-05-19soldstatus
ⓘ Source: listings_history table (triggers on properties + properties_extension) + one-shot
backfill from property_details.listing_events for pre-trigger history.
Tax reassessment forecast TX · Resets to sale price
- Current annual tax
- $976 · $81/mo
- Projected year-2 tax
- $2,104 · $175/mo
- Expected delta
- +$1,129/yr (+$94/mo · 115.7%)
ⓘ Screening estimate from a state-policy table — verify with the county assessor before closing.
Climate risk First Street
- Flood 3/10 Moderate FEMA zone X (unshaded) · 20% chance over 30 yrs
- Wildfire 1/10 Low
- Heat 10/10 Extreme 7 d/yr ≥107°F today · 26 d/yr by 30 yrs out
- Wind 9/10 Extreme 99% chance of damaging wind over 30 yrs
- Air quality 1/10 Low 0 unhealthy d/yr today · 0 by 30 yrs out
Nearby sold comps map
Loading sold comps map…
Walkable amenities ~0.75 mi
Loading nearby amenities…
Taxation est. · year 1
- Rental income
- $21,119
- − Mortgage interest
- −$6,442
- − Property taxes
- −$976
- − Insurance
- −$575
- − Repairs & maintenance
- −$1,690
- − Management
- −$1,690
- − Depreciation
- −$3,345
- Taxable income
- $6,402
- Est. tax owed @ 24.0%
- −$1,537
- After-tax cash flow
- $6,360/yr
For passive investors: Depreciation is non-cash, so a rental often shows a tax loss while cash-flowing — sheltering income. Rental losses are passive: they offset passive income freely, and up to $25,000/yr can offset ordinary (W-2) income if you actively participate and your MAGI is under $100k (phasing out to $0 by $150k); unused losses carry forward. On sale, claimed depreciation is recaptured at up to 25%, and gains may owe capital-gains tax (a 1031 exchange can defer both). Figures are a year-1 estimate at your 24.0% rate — not tax advice; consult a CPA.
Schools (NCES district)
- District
- Corpus Christi ISD
- NCES district ID
- 4815270
- Math proficiency
- 31% ▼ -18.00%
- Reading proficiency
- 35% ▼ -7.00%
- Median HH income
- $45,672
- Composite
- 28.27/100
- National rank
- #6793
- State rank
- #562 of 826 in TX
Livability — Corpus Christi
- Score
- 78/100
- State rank
- #66
- US rank
- #2404
Category grades
Schools grade is shown separately in the Schools card above.
Census & demographics
- Census place
- Corpus Christi, TX
- County
- Nueces County · 296,836 people
- City population
- 296,836
- Metro
- Corpus Christi, TX
- Population (ZIP)
- 4,344
- Household income
- $40,841
- Rent vs Own
- Severe rent burden
- 336.0
Population outlook (Nueces County) Hauer SSP2
- Today (2025)
- 418,037 people
- By 2030
- 447,123 · +7.0%
- By 2040
- 505,911 · +21.0%
- By 2050
- 567,522 · +35.8%
- By 2075
- 729,686 · +74.6%
- By 2100
- 847,087 · +102.6%
Race, ethnicity, and origin ACS 2023
- Neighborhood character
- Diverse neighborhood (Simpson 0.62)
- Race & ethnicity
- Hispanic / Latino 46% White 38% Two or more races 27% Black 13% Native American 2%
- Hispanic origin (detail)
- Mexican 43%
- Common ancestry
- Slovak 2% Portuguese 1% Lithuanian 1%
- Foreign-born
- 7% · Canada, South Korea
- Languages at home
- 71% English-only · Spanish 27% French/Haitian/Cajun 1%
Political lean MEDSL · Nueces
- 2024 margin
- R (+11.5) · D 43.8% · R 55.3%
- 2008→2024 swing
- -7.1pp toward R · 2008: -4.4pp · 2024: -11.5pp
- All cycles
- 2024: R+11.5 2020: R+2.9 2016: R+1.5 2012: R+3.2 2008: R+4.4
Not yet ingested
- Civics
- —
Market trends
- HPI YoY
- ▲ 3.37%
- Current HPI
- 92.634
- Rent YoY
- ▲ 1.63%
- Metro
- Corpus Christi, TX
- State GDP YoY
- ▲ 3.95%
- F500 in state
- 110
Industry mix (Fortune 500 HQ in TX)
| Industry | F500 HQs | Revenue |
|---|---|---|
| Energy | 16 | $1,198B |
|
||
| Technology | 5 | $198B |
|
||
| Engineering / Construction | 4 | $72B |
|
||
| Energy Services | 3 | $60B |
|
||
| Utilities | 3 | $41B |
|
||
| Healthcare | 2 | $330B |
|
||
Price history
+76.9% since first listed14 events — show timeline
- 2026-05-21 Price Changed $115,000 CBMLS
- 2026-05-06 Listed $125,000 CBMLS
- 2026-01-30 Relisted — CBMLS
- 2025-12-12 Pending — CBMLS
- 2025-12-06 Delisted — CBMLS
- 2025-11-14 Listed $45,000 CBMLS
- 2025-11-09 Delisted — CBMLS
- 2025-10-29 Listed $45,000 CBMLS
- 2024-01-15 Relisted — CBMLS
- 2024-01-03 Contingent — CBMLS
- 2023-12-21 Price Changed $59,000 CBMLS
- 2023-08-11 Listed $65,000 CBMLS
- 2022-04-19 Sold (Public Records) — Public Records
- 1999-05-19 Sold (Public Records) — Public Records
Property tax history
-1.8%/yrLatest (2025): $976 · -10.9% YoY. Source: county tax records.
Cash-flow waterfall
monthlySold comps — $/sqft
last 12 mo · ≤1 miLoading sold comps…