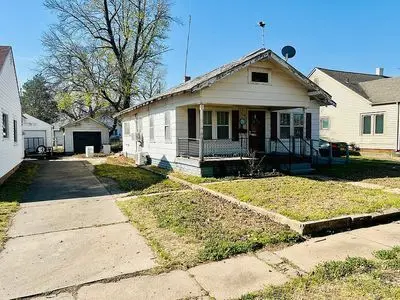
719 W Florence Ave · Blackwell, OK
Flood risk 1/10 · Minimal
- FEMA flood zone
- X (shaded)
- Chance of flooding over 30 yrs
- 0.0%
- Est. flood insurance / yr
- $507 – $1,088
Fire risk 1/10 · Minimal
- Est. fire insurance / yr
- $2,463 – $4,575
Heat risk 6/10 · Moderate
- Hot days now (above 109°F)
- 7 days/yr
- Hot days in 30 yrs
- 19 days/yr
Wind risk 2/10 · Minimal
- Chance of severe wind over 30 yrs
- 2.0%
Air-quality risk 2/10 · Minimal
- Unhealthy air days now
- 1 days/yr
- Unhealthy air days in 30 yrs
- 1 days/yr
Risk factors via First Street. Map © Google.
Why this score? — see what drove the D+ grade
The composite is a weighted blend of 9 inputs, each scored 0–100. Each bar is that input's sub-score; the figure is the points it added to the 100-point composite (weight × sub-score).
- Cash flow +15.0/30.0
- ARV discount +7.5/15.0
- 1% rule +5.0/10.0
- DSCR +5.0/10.0
- Appreciation +3.6/10.0
- Livability +3.0/5.0
- Rent growth +2.5/5.0
- Condition / age +2.5/5.0
- Schools +2.1/10.0
$16,500
🖨 Deal sheet 📄 Offer letter ✓ Due diligence
Listing remarks
Charming vintage home with great potential in the heart of Blackwell! This 2-bedroom, 1-bath property offers 1,068 sq ft of living space on a 6,500 sq ft lot & acirc; & euro; & rdquo; perfect for investors or anyone looking to create their own space. Built in 1925, the home features classic wood construction, a functional layout, and solid bones ready for your personal touch. With just a little TLC, this property can truly shine and be made your own. It also includes a detached garage and carport for added convenience, along with a concrete block foundation and composition roof. Inside, you & acirc; & euro; & trade; ll find wall heating and cooling plus a newer mini-
Key facts
- Cooling
- Carport
- Composition roof
Tags
Neighborhood map
What this means for you Summary
Snapshot
- This is a 2-bed/1.0-bath single-family listed at $16k.
Deal economics
- At list price, monthly cash flow is $648 ($8k/yr) — positive.
- The deal already cash-flows at list — no discount required.
- Meets the 1% rule at list price ($971 rent vs $16k).
- Cap rate 53.4% vs local median 11.5% in Blackwell — top-decile yield for the area; either an underpriced asset or a hidden risk that comps aren't pricing in. Stress-test before assuming the spread holds.
Location & tenants
- Location reads 59/100 on livability (#385 in OK) — a working-class tenant base; expect higher turnover. Strengths: cost of living A+, housing A+; Watch: schools F, crime D-, amenities F.
- Blackwell (town): math 27% / reading 23% proficiency, ranked #116 of 270 in OK (top 43%) — low school quality limits family demand, transient renter base, plan for 1-2y turnover; 61% free/reduced lunch — lower-income household profile, screen leases tightly.
- Market conditions: 23 active listings in the ZIP; 11 units permitted in Kay County in 2024 (0 in 5+ unit buildings).
Forward outlook
- Local home prices are declining (-2.8%/yr); year-one equity from $114 of loan paydown is wiped out by about $459 of value loss. Plan a longer hold.
- Kay County population projected at -12% by 2050 — secular population decline; favor cash flow + early exit over multi-decade hold.
- At projected returns (-2.8% appreciation + 3.0% rent growth), your $5k cash investment doubles in ~1 year — after that, you're playing with house money.
Negotiation context
- Only 1 days on market — expect competitive offers; lowballing is unlikely to land.
Risks & watch-outs
- Watch-outs: built in 1925 — expect roof / HVAC / electrical / plumbing capex.
- Climate carrying-cost: extreme-heat days projected 7→19/yr by 2055 (HVAC capex compounding) — expect insurance premiums to compound above CPI over the hold.
Questions for the listing agent
- Built in 1925 — when were the roof, HVAC, electrical panel, plumbing, and water heater last replaced?
- Is there a deadline driving the sale (1031 exchange, divorce, estate, relocation)? That informs how much negotiation room exists.
- Schools are F-rated, which usually means shorter tenancies and higher turnover. Who's the typical renter profile here, and what's been the actual vacancy rate?
- Crime grade is D in this area — have there been break-ins, vandalism, or insurance claims at this property in the last 3 years? What carrier currently insures it and at what premium?
- The area grade is low — what's the realistic commute time and amenity access for the typical tenant pool here? Any planned neighborhood developments (good or bad) we should know about?
- What's the average days-on-market for RENTAL listings here right now (not sales)? A rising rental-DOM trend means longer vacancies and softer asking-rent achievability than the comps imply.
- What's the recent tenant-quality profile in this submarket — average credit score on applications, eviction rate, late-payment / NSF rate, and stable-employment percentage? A property-management company in the area should have these aggregated.
- How much new for-sale + rental construction is in the pipeline within 1–3 miles? Heavy new supply typically softens prices + rents 12–24 months out; constrained supply supports both.
Investment metrics
- 1% rule
- 5.89% ✓
- Cap rate
- 53.44%
- Cash-on-cash
- 168.38%
- DSCR
- 8.49
- GRM
- 1.4
CMA / ARV
- ARV (on-the-fly)
- $57,672
- Comps found
- 12
Show comp detail 12 sales within ~0.75 mi
| Address | Dist | Beds/Ba | Sqft | Sold | Price | $/sf | Match |
|---|---|---|---|---|---|---|---|
| 901 Rainbow Dr | 0.16mi | 2/1.0 | 1,072 (+0%) | 18mo | $80,000 | $75 | 76 |
| 901 W Mckinley Ave | 0.32mi | 2/1.0 | 1,055 (-1%) | 14mo | $20,000 | $19 | 71 |
| 523 N 4th St | 0.21mi | 3/1.0 (+1) | 1,055 (-1%) | 18mo | $92,500 | $88 | 68 |
| 964 N 7th St | 0.32mi | 3/1.5 (+1) | 1,052 (-2%) | 20mo | $84,900 | $81 | 59 |
| 1050 W Blackwell Ave | 0.50mi | 2/1.0 | 1,118 (+5%) | 16mo | $25,000 | $22 | 55 |
| 935 N 7th St | 0.21mi | 3/1.0 (+1) | 1,212 (+14%) | 11mo | $79,900 | $66 | 54 |
| 514 N 1st St | 0.50mi | 2/1.0 | 1,196 (+12%) | 7mo | $30,000 | $25 | 51 |
| 1319 W Blackwell Ave | 0.61mi | 2/1.0 | 1,038 (-3%) | 20mo | $28,000 | $27 | 51 |
| 1002 W College | 0.64mi | 2/1.0 | 1,056 (-1%) | 22mo | $29,900 | $28 | 50 |
| 424 S 4th | 0.72mi | 2/1.0 | 1,018 (-5%) | 11mo | $55,000 | $54 | 50 |
| 203 W Kansas | 0.48mi | 2/1.0 | 1,005 (-6%) | 22mo | $55,000 | $55 | 49 |
| 406 N 4th St | 0.29mi | 3/1.0 (+1) | 1,161 (+9%) | 22mo | $56,500 | $49 | 48 |
Match score weights: distance 35% · size 25% · config 20% · recency 20%. Top-matched comps best support the ARV.
Projected returns pro-forma
-2.78% appreciation · 3.0% rent growth · sell at horizon
- IRR
- —
- Equity multiple
- 9.39×
- Total profit
- $38,781
- Equity at exit
- $2,619
- IRR
- —
- Equity multiple
- 19.86×
- Total profit
- $87,133
- Equity at exit
- $1,700
Cash invested: $4,620 (down + closing). Projections, not guarantees.
Landlord ↔ Tenant lean methodology
- Overall (STATE)
- 83 Strongly Landlord-Friendly
- State Oklahoma
- 83 Strongly Landlord-Friendly · R+20
- County
- — inherits STATE
- City
- — inherits STATE
ZIP-level market 74631
- Home prices YoY
- -1.5%
- Active inventory
- 23
- Price-to-rent
- 1.4×
Monthly cashflow live
- Estimated rent
- $971 medium interval (Pro) →
- Mortgage (P&I)
- −$87
- Tax from tax record
- −$26 /mo · $307/yr
- Insurance
- −$7
- HOA
- −$0
- Vacancy / Maint / Mgmt
- −$204
- Net cashflow
- $648
Break-even live
UW: 25.0% down · 7.5% · 30yr · 1.5% tax · 5.0% vac · 8.0% maint · 8.0% mgmt
Financing live
Cash to close
- Down payment
- $4,125
- Closing costs
- $495
- Reserves months
- —
- Total cash needed
- —
Loan-product check · same deal, 3 products live
Conventional
25% down · 7.5% · 30yr
- Down + closing
- —
- Monthly P&I
- —
- Monthly cashflow
- —
- DSCR
- —
- Eligible?
- —
Personal DTI + credit; lowest rate.
DSCR
20% down · 8.5% · 30yr
- Down + closing
- —
- Monthly P&I
- —
- Monthly cashflow
- —
- DSCR
- —
- Eligible?
- —
No personal income docs; deal must DSCR.
Hard money
10% down · 12.0% · 12mo
- Down + closing
- —
- Monthly P&I
- —
- Monthly cashflow
- —
- DSCR
- —
- Eligible?
- —
Short-term bridge; refi at stabilization.
Listing history 2 events
-
2026-05-13status Under Contract
-
2026-05-12$16,500 Active
ⓘ Source: listings_history table (triggers on properties + properties_extension) + one-shot
backfill from property_details.listing_events for pre-trigger history.
Tax reassessment forecast OK · Resets to sale price
- Current annual tax
- $307 · $26/mo
- Projected year-2 tax
- $307 · $26/mo
- Expected delta
- $0/yr ($0/mo · 0.0%)
ⓘ Screening estimate from a state-policy table — verify with the county assessor before closing.
Climate risk First Street
- Flood 1/10 Low FEMA zone X (shaded) · 0% chance over 30 yrs
- Wildfire 1/10 Low
- Heat 6/10 Major 7 d/yr ≥109°F today · 19 d/yr by 30 yrs out
- Wind 2/10 Low 2% chance of damaging wind over 30 yrs
- Air quality 2/10 Low 1 unhealthy d/yr today · 1 by 30 yrs out
Nearby sold comps map
Loading sold comps map…
Walkable amenities ~0.75 mi
Loading nearby amenities…
Taxation est. · year 1
- Rental income
- $11,654
- − Mortgage interest
- −$924
- − Property taxes
- −$307
- − Insurance
- −$82
- − Repairs & maintenance
- −$932
- − Management
- −$932
- − Depreciation
- −$480
- Taxable income
- $7,996
- Est. tax owed @ 24.0%
- −$1,919
- After-tax cash flow
- $5,860/yr
For passive investors: Depreciation is non-cash, so a rental often shows a tax loss while cash-flowing — sheltering income. Rental losses are passive: they offset passive income freely, and up to $25,000/yr can offset ordinary (W-2) income if you actively participate and your MAGI is under $100k (phasing out to $0 by $150k); unused losses carry forward. On sale, claimed depreciation is recaptured at up to 25%, and gains may owe capital-gains tax (a 1031 exchange can defer both). Figures are a year-1 estimate at your 24.0% rate — not tax advice; consult a CPA.
Schools (NCES district)
- District
- Blackwell
- NCES district ID
- 4004630
- Math proficiency
- 27% ▼ -12.00%
- Reading proficiency
- 23% ▼ -9.00%
- Median HH income
- $37,923
- Composite
- 20.93/100
- National rank
- #8480
- State rank
- #116 of 270 in OK
Livability — Blackwell
- Score
- 59/100
- State rank
- #385
- US rank
- #20038
Category grades
Schools grade is shown separately in the Schools card above.
Census & demographics
- Census place
- Blackwell, OK
- City population
- 6,795
- Population (ZIP)
- 6,795
Population outlook (Kay County) Hauer SSP2
- Today (2025)
- 43,389 people
- By 2030
- 42,222 · -2.7%
- By 2040
- 40,108 · -7.6%
- By 2050
- 38,231 · -11.9%
- By 2075
- 34,119 · -21.4%
- By 2100
- 28,526 · -34.3%
Race, ethnicity, and origin ACS 2023
- Neighborhood character
- Predominantly White (76%)
- Race & ethnicity
- White 76% Hispanic / Latino 12% Two or more races 8% Native American 4%
- Hispanic origin (detail)
- Mexican 11%
- Common ancestry
- Iranian 1% Lithuanian 1% Slovak 1%
- Foreign-born
- 3% · Canada
- Languages at home
- 92% English-only · Spanish 8%
Political lean MEDSL · Kay
- 2024 margin
- Solid R (+49.4) · D 24.4% · R 73.8% · Other 1.7%
- 2008→2024 swing
- -7.8pp toward R · 2008: -41.6pp · 2024: -49.4pp
- All cycles
- 2024: R+49.4 2020: R+51.0 2016: R+50.2 2012: R+42.6 2008: R+41.6
Not yet ingested
- Civics
- —
Market trends
- HPI YoY
- ▼ -2.78%
- Current HPI
- 183.6342
- Rent YoY
- —
- Metro
- —
- State GDP YoY
- ▲ 1.55%
- F500 in state
- 6
Industry mix (Fortune 500 HQ in OK)
| Industry | F500 HQs | Revenue |
|---|---|---|
| Energy | 3 | $48B |
|
||
Price history
2 events — show timeline
- 2026-05-13 Pending — FSBO.com
- 2026-05-12 Listed $16,500 FSBO.com
Property tax history
+9.0%/yrLatest (2025): $307 · +5.1% YoY. Source: county tax records.
Cash-flow waterfall
monthlySold comps — $/sqft
last 12 mo · ≤1 miLoading sold comps…