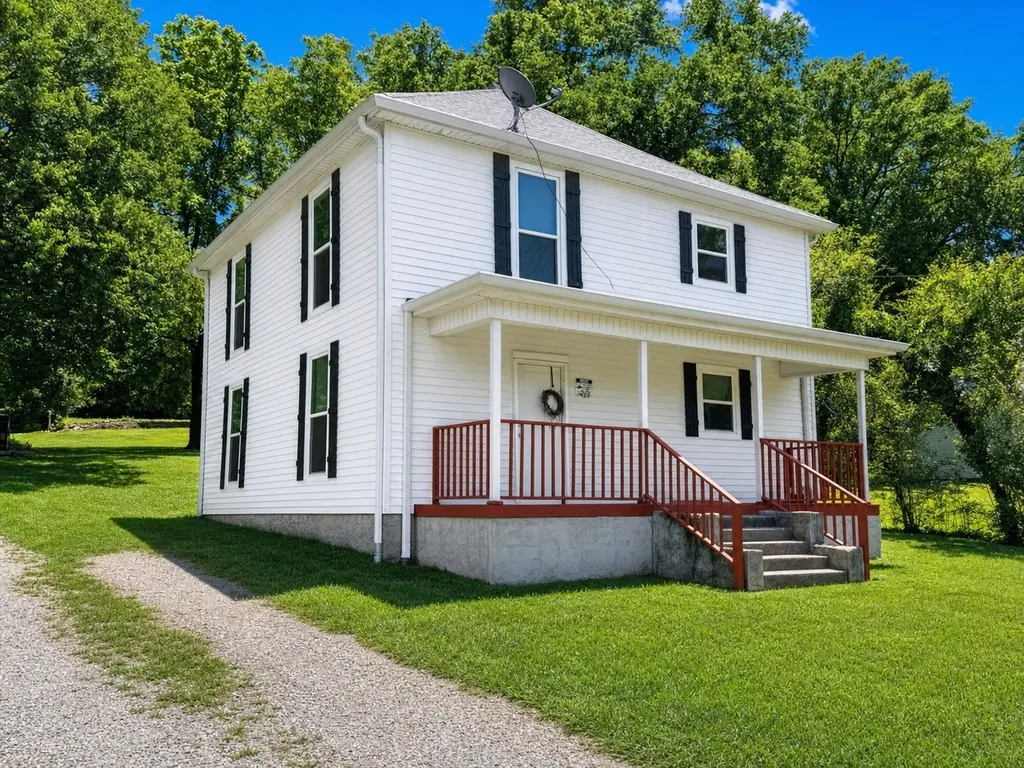
 Duplex
427 Childers St · Pulaski, TN
Flood risk 1/10 · Minimal
- FEMA flood zone
- X (unshaded)
- Chance of flooding over 30 yrs
- 0.0%
- Est. flood insurance / yr
- $507 – $1,088
Fire risk 3/10 · Minor
- Est. fire insurance / yr
- $949 – $1,763
Heat risk 6/10 · Moderate
- Hot days now (above 105°F)
- 7 days/yr
- Hot days in 30 yrs
- 20 days/yr
Wind risk 4/10 · Minor
- Chance of severe wind over 30 yrs
- 15.0%
Air-quality risk 2/10 · Minimal
- Unhealthy air days now
- 0 days/yr
- Unhealthy air days in 30 yrs
- 1 days/yr
Risk factors via First Street. Map © Google.
Why this score? — see what drove the D grade
The composite is a weighted blend of 9 inputs, each scored 0–100. Each bar is that input's sub-score; the figure is the points it added to the 100-point composite (weight × sub-score).
- Cash flow +16.9/30.0
- ARV discount +7.5/15.0
- DSCR +5.3/10.0
- 1% rule +3.6/10.0
- Livability +3.2/5.0
- Rent growth +2.5/5.0
- Condition / age +2.5/5.0
- Schools +1.9/10.0
- Appreciation +0.0/10.0
$215,000
🖨 Deal sheet (PDF) 📄 Offer letter ✓ Due diligence
Multi-family units
County records classify this as Multi-Family (2-4 Unit). Listing-text estimate: 2 units. confirmed
Listing remarks
Income-producing duplex near downtown Pulaski. This 2-unit property features a shared front entry with separate access to each residence. The lower unit is currently occupied at $1,000/month, providing immediate rental income. The upper unit is vacant and ready for lease. Both units offer large room sizes, tall ceilings, oversized windows, and updated LVP flooring. Functional galley kitchen, full bath, walk-in closet, and ceiling fans throughout the photographed upper unit. Vinyl siding exterior, covered front porch, off-street parking, and mature shade trees. Utilities paid by tenants. Strong workforce housing demand in the Pulaski market. Convenient to UT Southern, downtown dining, retail
Key facts
- Updated lvp flooring
- Full bath
- Separate access
Tags
Property features AI
Finance
- Financial info: Gross income: $24,000; Net operating income: $22,732; Tenants pay electricity, water, and trash collection; Owner pays: none
- HOA & community: Sidewalks (association amenity)
Exterior
- Parking: 2 open/unpaved parking spaces (total 2 parking spaces)
- Security: Smoke detector(s)
- Utilities: Public water; Public sewer; Natural gas available
- Home design: Duplex (residential income); Attached property; Two levels
- Construction: Frame construction; Shingle roof; Existing structure
- Exterior features: Sidewalks; Lot approximately 0.25 acre
Interior
- Kitchen: No appliance details provided
- Bedrooms: Two 2-bedroom units
- Flooring: Laminate
- Bathrooms: Each unit has 1 bathroom
- Heating & cooling: Natural gas heating; Central air conditioning
- Interior features: Laminate flooring; Smoke detector(s)
- Laundry & utility: Individual laundry areas; Washer hookup; Electric dryer hookup
Neighborhood map
What this means for you Summary
Snapshot
- This is a 2 × 2-bed/1.0-bath units multifamily listed at $215k.
Deal economics
- At list price, monthly cash flow is $142 ($2k/yr) — positive. Per door: $71/mo.
- The deal already cash-flows at list — no discount required.
- To meet the 1% rule (rent ≥ 1% of price), the offer needs to be $185k (13.8% below list).
- Recommended offer: $185k (13.8% below list) — sets the bar for 1% rule.
- Cap rate 7.1% vs local median 2.7% in Pulaski — top-decile yield for the area; either an underpriced asset or a hidden risk that comps aren't pricing in. Stress-test before assuming the spread holds.
Location & tenants
- Location reads 64/100 on livability (#174 in TN) — a middle-class / working-renter tenant base. Strengths: cost of living A+, housing A+; Watch: health & safety C-, crime F, amenities F.
- Giles County (rural): math 20% / reading 24% proficiency, ranked #105 of 139 in TN (top 76%) — low school quality limits family demand, transient renter base, plan for 1-2y turnover.
- Zoned schools: Pulaski Elementary (483 students, 0% FRL); Bridgeforth Middle School (math 15% / reading 18%, grade F, #221 of 333 statewide, top 67%, 314 students, 0% FRL); Giles Co High School (math 8% / reading 22%, grade F, #237 of 332 statewide, top 75%, 703 students, 0% FRL) — zoned schools average 0% FRL vs 50% district-wide (50 pts lower); this property's tenant base skews higher-income than the district average.
- Market conditions: 188 active listings in the ZIP; 73 units permitted in Giles County in 2024 (0 in 5+ unit buildings).
Forward outlook
- Local home prices are declining (-3.0%/yr); year-one equity from $1k of loan paydown is wiped out by about $6k of value loss. Plan a longer hold.
- Giles County population projected at -10% by 2050 — secular population decline; favor cash flow + early exit over multi-decade hold.
Negotiation context
- It's been on market 28 days — a 2% lower offer ($212k) is reasonable based on typical stale-listing flexibility.
- Current owner paid $60k; list at $215k implies a 259% gain — meaningful room to come down on a strong offer.
Risks & watch-outs
- Watch-outs: built in 1900 — expect roof / HVAC / electrical / plumbing capex.
- Climate carrying-cost: extreme-heat days projected 7→20/yr by 2055 (HVAC capex compounding) — expect insurance premiums to compound above CPI over the hold.
Questions for the listing agent
- Can we see the unit-by-unit rent roll, current vacancy, and any below-market leases? What's the average tenancy length?
- What capital expenditures (roof, boiler, parking lot, exteriors) have been made in the last 5 years, and what's planned in the next 2?
- Built in 1900 — when were the roof, HVAC, electrical panel, plumbing, and water heater last replaced?
- Is there a deadline driving the sale (1031 exchange, divorce, estate, relocation)? That informs how much negotiation room exists.
- Schools are F-rated, which usually means shorter tenancies and higher turnover. Who's the typical renter profile here, and what's been the actual vacancy rate?
- Crime grade is F in this area — have there been break-ins, vandalism, or insurance claims at this property in the last 3 years? What carrier currently insures it and at what premium?
- The area grade is low — what's the realistic commute time and amenity access for the typical tenant pool here? Any planned neighborhood developments (good or bad) we should know about?
- What's the average days-on-market for RENTAL listings here right now (not sales)? A rising rental-DOM trend means longer vacancies and softer asking-rent achievability than the comps imply.
- What's the recent tenant-quality profile in this submarket — average credit score on applications, eviction rate, late-payment / NSF rate, and stable-employment percentage? A property-management company in the area should have these aggregated.
- How much new apartment / multifamily construction is in the pipeline within 1–3 miles? Heavy new supply (>2% of stock underway) typically softens rents 12–24 months out; light construction supports rent growth.
Investment metrics
- 1% rule
- 0.86% ✗
- Cap rate
- 7.09%
- Cash-on-cash
- 2.83%
- DSCR
- 1.13
- GRM
- 9.7
CMA / ARV
No comps found within radius.
Projected returns pro-forma
-3.0% appreciation · 3.0% rent growth · sell at horizon
- IRR
- -11.9%
- Equity multiple
- 0.57×
- Total profit
- $-25,872
- Equity at exit
- $32,057
- IRR
- -2.8%
- Equity multiple
- 0.81×
- Total profit
- $-11,183
- Equity at exit
- $18,589
Cash invested: $60,200 (down + closing). Projections, not guarantees.
Landlord ↔ Tenant lean methodology
- Overall (STATE)
- 87 Strongly Landlord-Friendly
- State Tennessee
- 87 Strongly Landlord-Friendly · R+13
- County
- — inherits STATE
- City
- — inherits STATE
ZIP-level market 38478
- Home prices YoY
- -12.7%
- Active inventory
- 188
- Price-to-rent
- 19.3×
Monthly cashflow live
- Estimated rent
- $1,854 high interval (Pro) →
- Mortgage (P&I)
- −$1,127
- Tax from tax record
- −$106 /mo · $1,268/yr
- Insurance
- −$90
- HOA
- −$0
- Lot rent
- −$0
- Vacancy / Maint / Mgmt
- −$389
- Net cashflow
- $142
Break-even live
Sensitivity live
| Price | -10% $264 | -5% $203 | +0% $142 | +5% $81 | +10% $20 |
|---|---|---|---|---|---|
| Rent | -10% $-5 | -5% $69 | +0% $142 | +5% $215 | +10% $288 |
| Rate | -1.0pp $250 | -0.5pp $197 | base $142 | +0.5pp $86 | +1.0pp $30 |
2-unit breakdown (identical units grouped — click to expand)
| Units | Beds | Baths | Est. rent |
|---|---|---|---|
| 2× units | 2 | 1 | $1,854 |
| #1 | 2 | 1 | $927 |
| #2 | 2 | 1 | $927 |
| Total (2 units) | $1,854 | ||
UW: 25.0% down · 7.5% · 30yr · 1.5% tax · 5.0% vac · 8.0% maint · 8.0% mgmt
Financing live
Cash to close
- Down payment
- $53,750
- Closing costs
- $6,450
- Reserves months
- —
- Total cash needed
- —
Loan-product check · same deal, 3 products live
Conventional
25% down · 7.5% · 30yr
- Down + closing
- —
- Monthly P&I
- —
- Monthly cashflow
- —
- DSCR
- —
- Eligible?
- —
Personal DTI + credit; lowest rate.
DSCR
20% down · 8.5% · 30yr
- Down + closing
- —
- Monthly P&I
- —
- Monthly cashflow
- —
- DSCR
- —
- Eligible?
- —
No personal income docs; deal must DSCR.
Hard money
10% down · 12.0% · 12mo
- Down + closing
- —
- Monthly P&I
- —
- Monthly cashflow
- —
- DSCR
- —
- Eligible?
- —
Short-term bridge; refi at stabilization.
Listing history 19 events
-
2026-06-22days on market $215,000 Active 28 DOM
-
2026-06-21days on market $215,000 Active 27 DOM
-
2026-06-21days on market $215,000 Active 26 DOM
-
2026-06-18days on market $215,000 Active 24 DOM
-
2026-06-17days on market $215,000 Active 23 DOM
-
2026-06-16days on market $215,000 Active 22 DOM
-
2026-06-15days on market $215,000 Active 21 DOM
-
2026-06-13days on market $215,000 Active 19 DOM
-
2026-06-12days on market $215,000 Active 18 DOM
-
2026-06-09days on market $215,000 Active 15 DOM
-
2026-06-08days on market $215,000 Active 14 DOM
-
2026-06-08days on market $215,000 Active 13 DOM
-
2026-06-03days on market $215,000 Active 9 DOM
-
2026-06-02days on market $215,000 Active 8 DOM
-
2026-06-01days on market $215,000 Active 7 DOM
-
2026-05-31days on market $215,000 Active 6 DOM
-
2026-05-25$215,000 Active
-
2021-07-26soldstatus $59,900
-
2011-04-21soldstatus $55,000
ⓘ Source: listings_history table (triggers on properties + properties_extension) + one-shot
backfill from property_details.listing_events for pre-trigger history.
Tax reassessment forecast TN · Resets to sale price
- Current annual tax
- $1,268 · $106/mo
- Projected year-2 tax
- $1,526 · $127/mo
- Expected delta
- +$258/yr (+$22/mo · 20.4%)
ⓘ Screening estimate from a state-policy table — verify with the county assessor before closing.
Climate risk First Street
- Flood 1/10 Low FEMA zone X (unshaded) · 0% chance over 30 yrs
- Wildfire 3/10 Moderate
- Heat 6/10 Major 7 d/yr ≥105°F today · 20 d/yr by 30 yrs out
- Wind 4/10 Moderate 15% chance of damaging wind over 30 yrs
- Air quality 2/10 Low 0 unhealthy d/yr today · 1 by 30 yrs out
Nearby sold comps map
Loading sold comps map…
Walkable amenities ~0.75 mi
Loading nearby amenities…
Taxation est. · year 1
- Rental income
- $22,248
- − Mortgage interest
- −$12,043
- − Property taxes
- −$1,268
- − Insurance
- −$1,075
- − Repairs & maintenance
- −$1,780
- − Management
- −$1,780
- − Depreciation
- −$6,255
- Taxable loss
- −$1,953
- Est. tax savings @ 24.0%
- +$469
- After-tax cash flow
- $2,172/yr
For passive investors: Depreciation is non-cash, so a rental often shows a tax loss while cash-flowing — sheltering income. Rental losses are passive: they offset passive income freely, and up to $25,000/yr can offset ordinary (W-2) income if you actively participate and your MAGI is under $100k (phasing out to $0 by $150k); unused losses carry forward. On sale, claimed depreciation is recaptured at up to 25%, and gains may owe capital-gains tax (a 1031 exchange can defer both). Figures are a year-1 estimate at your 24.0% rate — not tax advice; consult a CPA.
Schools (NCES district)
- District
- Giles County
- NCES district ID
- 4701410
- Math proficiency
- 20% ▼ -18.00%
- Reading proficiency
- 24% ▼ -7.00%
- Median HH income
- $40,318
- Composite
- 18.63/100
- National rank
- #8895
- State rank
- #105 of 139 in TN
Livability — Pulaski
- Score
- 64/100
- State rank
- #174
- US rank
- #14586
Category grades
Schools grade is shown separately in the Schools card above.
Census & demographics
- Census place
- Pulaski, TN
- Population (ZIP)
- 18,756
Population outlook (Giles County) Hauer SSP2
- Today (2025)
- 28,505 people
- By 2030
- 27,960 · -1.9%
- By 2040
- 26,740 · -6.2%
- By 2050
- 25,665 · -10.0%
- By 2075
- 24,798 · -13.0%
- By 2100
- 25,524 · -10.5%
Race, ethnicity, and origin ACS 2023
- Neighborhood character
- Predominantly White (77%)
- Race & ethnicity
- White 77% Black 11% Two or more races 7% Hispanic / Latino 4%
- Common ancestry
- Serbian 3% Slovak 2% Lithuanian 1%
- Foreign-born
- 1% · Canada
- Languages at home
- 96% English-only · Spanish 3% German/W. Germanic 1%
Political lean MEDSL · Giles
- 2024 margin
- Solid R (+55.0) · D 22.1% · R 77.1%
- 2008→2024 swing
- -35.4pp toward R · 2008: -19.6pp · 2024: -55.0pp
- All cycles
- 2024: R+55.0 2020: R+49.1 2016: R+45.4 2012: R+29.2 2008: R+19.6
Not yet ingested
- Civics
- —
Market trends
- HPI YoY
- ▼ -46.60%
- Current HPI
- 319.6315
- Rent YoY
- —
- Metro
- —
- State GDP YoY
- ▲ 2.78%
- F500 in state
- 22
Industry mix (Fortune 500 HQ in TN)
| Industry | F500 HQs | Revenue |
|---|---|---|
| Healthcare | 3 | $91B |
|
||
| Retail | 3 | $72B |
|
||
| Transportation / Logistics | 1 | $88B |
|
||
| Paper / Packaging | 1 | $19B |
|
||
| Insurance | 1 | $13B |
|
||
| Energy | 1 | $12B |
|
||
Price history
+290.9% since first listed3 events — show timeline
- 2026-05-25 Listed $215,000 REALTRACS as Distributed by MLS Grid
- 2021-07-26 Sold (Public Records) $59,900 Public Records
- 2011-04-21 Sold (Public Records) $55,000 Public Records
Property tax history
+4.9%/yrLatest (2025): $1,268 · +13.2% YoY. Source: county tax records.
Cash-flow waterfall
monthlySold comps — $/sqft
last 12 mo · ≤1 miLoading sold comps…