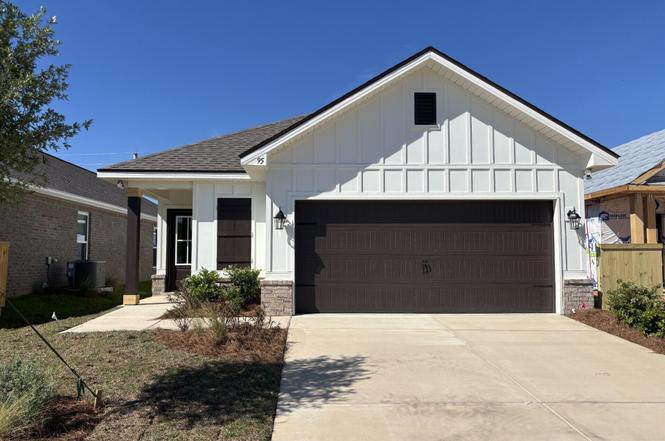
95 Natureview Way · Freeport, FL
Flood risk No data
- FEMA flood zone
- —
- Chance of flooding over 30 yrs
- —
- Est. flood insurance / yr
- —
Fire risk No data
- Est. fire insurance / yr
- —
Heat risk No data
- Hot days now (above threshold)
- —
- Hot days in 30 yrs
- —
Wind risk No data
- Chance of severe wind over 30 yrs
- —
Air-quality risk No data
- Unhealthy air days now
- —
- Unhealthy air days in 30 yrs
- —
Risk factors via First Street. Map © Google.
Why this score? — see what drove the F grade
The composite is a weighted blend of 9 inputs, each scored 0–100. Each bar is that input's sub-score; the figure is the points it added to the 100-point composite (weight × sub-score).
- ARV discount +7.5/15.0
- Cash flow +5.9/30.0
- Schools +5.2/10.0
- Livability +3.4/5.0
- Rent growth +2.9/5.0
- Condition / age +2.5/5.0
- 1% rule +1.7/10.0
- DSCR +0.3/10.0
- Appreciation +0.0/10.0
$359,022
🖨 Deal sheet (PDF) 📄 Offer letter ✓ Due diligence
Listing remarks
Awesome builder rate plus choose ONE free: window blinds, fridge, smart home package! Restrictions apply. The EVERGLADES II J in Natureview community offers a 4 bedroom, 2 bathroom open design. Upgrades added (list attached). Special Features: double vanity, custom tiled shower, and walk-in closet in master bath, kitchen island, pantry, covered porches, undermount sinks, custom kitchen backsplash, LED lighting, crown molding, ceiling fans in living and master, smart connect WIFI thermostat, framed mirrors in all baths, landscaping, architectural 30-year shingles, flood lights, and more! Energy Efficient Features: water heater, electric kitchen appliance package, vinyl low E windows, and mo
Key facts
- Double vanity
- Pantry
- Covered porches
Tags
Neighborhood map
What this means for you Summary
Snapshot
- This is a 4-bed/2.0-bath land listed at $359k.
Deal economics
- At list price, monthly cash flow is $-700 ($-8k/yr) — negative.
- To cash-flow at today's rent, offer at most $258k (28.2% below list).
- To meet the 1% rule (rent ≥ 1% of price), the offer needs to be $242k (32.6% below list).
- Recommended offer: $242k (32.6% below list) — sets the bar for 1% rule.
- Cap rate 4.0% vs local median 3.0% in Freeport — top-decile yield for the area; either an underpriced asset or a hidden risk that comps aren't pricing in. Stress-test before assuming the spread holds.
Location & tenants
- Location reads 68/100 on livability (#520 in FL) — a middle-class / working-renter tenant base. Strengths: crime A+, housing A+, employment B+; Watch: health & safety C-, amenities F, commute F.
- Walton (rural): math 62% / reading 61% proficiency, ranked #10 of 73 in FL (top 14%) — acceptable for families but not a draw, mixed tenant base, ~2y average lease.
- Zoned schools: Freeport Elementary School (math 50% / reading 57%, grade C, #949 of 2,144 statewide, top 45%, 1,123 students, 55% FRL); Freeport Senior High School (math 47% / reading 62%, grade C-, #138 of 667 statewide, top 21%, 557 students, 43% FRL) — zoned schools at 49% FRL track the district average.
- Market conditions: Rents rising (+1.4%/yr); 1012 active listings in the ZIP; solid renter incomes; 2,883 units permitted in Walton County in 2024 (1,322 in 5+ unit buildings).
- This rent runs 35% of the median local income ($83k/yr) — at the standard rent-burdened threshold; future hikes will face affordability resistance.
Forward outlook
- Local home prices are declining (-3.0%/yr); year-one equity from $2k of loan paydown is wiped out by about $11k of value loss. Plan a longer hold.
- Walton County population projected at +46% by 2050 — long-run rental-demand tailwind backs the buy-and-hold thesis.
Negotiation context
- It's been on market 72 days — a 6% lower offer ($337k) is reasonable based on typical stale-listing flexibility.
Questions for the listing agent
- What do current leases actually rent for vs. the listed asking? Can we see a recent rent roll and the last 12 months of T-12 income?
- It's been on market 72 days. Have you received any prior offers? Is the seller open to a 33% concession, seller financing, or rate buy-down credit?
- What does the HOA fee cover, when was the last increase, and are there any pending special assessments or reserve-fund shortfalls?
- Why hasn't it sold? Are there any deal-killer items the seller is aware of (foundation, flood, title, zoning, code violations)?
- Is there a deadline driving the sale (1031 exchange, divorce, estate, relocation)? That informs how much negotiation room exists.
- The area grade is low — what's the realistic commute time and amenity access for the typical tenant pool here? Any planned neighborhood developments (good or bad) we should know about?
- What's the average days-on-market for RENTAL listings here right now (not sales)? A rising rental-DOM trend means longer vacancies and softer asking-rent achievability than the comps imply.
- What's the recent tenant-quality profile in this submarket — average credit score on applications, eviction rate, late-payment / NSF rate, and stable-employment percentage? A property-management company in the area should have these aggregated.
- How much new for-sale + rental construction is in the pipeline within 1–3 miles? Heavy new supply typically softens prices + rents 12–24 months out; constrained supply supports both.
Investment metrics
- 1% rule
- 0.67% ✗
- Cap rate
- 3.95%
- Cash-on-cash
- -8.35%
- DSCR
- 0.63
- GRM
- 12.4
CMA / ARV
No comps found within radius.
Projected returns pro-forma
-3.0% appreciation · 1.4% rent growth · sell at horizon
- IRR
- -32.9%
- Equity multiple
- -0.06×
- Total profit
- $-106,456
- Equity at exit
- $53,531
- IRR
- -50.4%
- Equity multiple
- -0.64×
- Total profit
- $-164,842
- Equity at exit
- $31,042
Cash invested: $100,526 (down + closing). Projections, not guarantees.
Landlord ↔ Tenant lean methodology
- Overall (STATE)
- 87 Strongly Landlord-Friendly
- State Florida
- 87 Strongly Landlord-Friendly · R+3
- County
- — inherits STATE
- City
- — inherits STATE
ZIP-level market 32439
- Home prices YoY
- -4.2%
- Rents YoY
- 1.4%
- Active inventory
- 1012
- Price-to-rent
- 12.4×
Monthly cashflow live
- Estimated rent
- $2,420 medium interval (Pro) →
- Mortgage (P&I)
- −$1,883
- Tax est. 1.5%
- −$449 /mo · $5,385/yr
- Insurance
- −$150
- HOA
- −$130
- Vacancy / Maint / Mgmt
- −$508
- Net cashflow
- $-700
Break-even live
Sensitivity live
| Price | -10% $-452 | -5% $-576 | +0% $-700 | +5% $-824 | +10% $-948 |
|---|---|---|---|---|---|
| Rent | -10% $-891 | -5% $-795 | +0% $-700 | +5% $-604 | +10% $-509 |
| Rate | -1.0pp $-519 | -0.5pp $-608 | base $-700 | +0.5pp $-793 | +1.0pp $-887 |
UW: 25.0% down · 7.5% · 30yr · 1.5% tax · 5.0% vac · 8.0% maint · 8.0% mgmt
Financing live
Cash to close
- Down payment
- $89,756
- Closing costs
- $10,771
- Reserves months
- —
- Total cash needed
- —
Loan-product check · same deal, 3 products live
Conventional
25% down · 7.5% · 30yr
- Down + closing
- —
- Monthly P&I
- —
- Monthly cashflow
- —
- DSCR
- —
- Eligible?
- —
Personal DTI + credit; lowest rate.
DSCR
20% down · 8.5% · 30yr
- Down + closing
- —
- Monthly P&I
- —
- Monthly cashflow
- —
- DSCR
- —
- Eligible?
- —
No personal income docs; deal must DSCR.
Hard money
10% down · 12.0% · 12mo
- Down + closing
- —
- Monthly P&I
- —
- Monthly cashflow
- —
- DSCR
- —
- Eligible?
- —
Short-term bridge; refi at stabilization.
HOA detail
- Monthly dues
- $130 · $1,560/yr
- Likely covers
- waterelectricinternetlandscaping
Listing history 5 events
-
2026-04-23status Pending
-
2026-02-19price $359,022
-
2026-02-19price $339,022
-
2026-02-10$359,022 Active
-
2024-12-09soldstatus $16,462,500
ⓘ Source: listings_history table (triggers on properties + properties_extension) + one-shot
backfill from property_details.listing_events for pre-trigger history.
Nearby sold comps map
Loading sold comps map…
Walkable amenities ~0.75 mi
Loading nearby amenities…
Taxation est. · year 1
- Rental income
- $29,035
- − Mortgage interest
- −$20,111
- − Property taxes
- −$5,385
- − Insurance
- −$1,795
- − Repairs & maintenance
- −$2,323
- − Management
- −$2,323
- − HOA
- −$1,560
- − Depreciation
- −$10,444
- Taxable loss
- −$14,906
- Est. tax savings @ 24.0%
- +$3,577
- After-tax cash flow
- $-4,818/yr
For passive investors: Depreciation is non-cash, so a rental often shows a tax loss while cash-flowing — sheltering income. Rental losses are passive: they offset passive income freely, and up to $25,000/yr can offset ordinary (W-2) income if you actively participate and your MAGI is under $100k (phasing out to $0 by $150k); unused losses carry forward. On sale, claimed depreciation is recaptured at up to 25%, and gains may owe capital-gains tax (a 1031 exchange can defer both). Figures are a year-1 estimate at your 24.0% rate — not tax advice; consult a CPA.
Schools (NCES district)
- District
- Walton
- NCES district ID
- 1201980
- Math proficiency
- 62% ▼ -4.00%
- Reading proficiency
- 61% ▼ -2.00%
- Median HH income
- $46,794
- Composite
- 52.03/100
- National rank
- #1634
- State rank
- #10 of 73 in FL
Livability — Freeport
- Score
- 68/100
- State rank
- #520
- US rank
- #9579
Category grades
Schools grade is shown separately in the Schools card above.
Census & demographics
- County
- Walton County · 70,839 people
- City population
- 15,328
- Metro
- Crestview-Fort Walton Beach-Destin, FL
- Population (ZIP)
- 15,328
- Household income
- $83,227
- Rent vs Own
- Severe rent burden
- 172.0
Population outlook (Walton County) Hauer SSP2
- Today (2025)
- 80,014 people
- By 2030
- 88,120 · +10.1%
- By 2040
- 103,537 · +29.4%
- By 2050
- 117,034 · +46.3%
- By 2075
- 143,901 · +79.8%
- By 2100
- 155,138 · +93.9%
Race, ethnicity, and origin ACS 2023
- Neighborhood character
- Predominantly White (76%)
- Race & ethnicity
- White 76% Hispanic / Latino 16% Two or more races 8% Native American 5% Black 1%
- Hispanic origin (detail)
- Mexican 8% Puerto Rican 2% Cuban 1%
- Common ancestry
- Slovak 3% Italian 3% Serbian 2%
- Foreign-born
- 8% · Canada, Jamaica
- Languages at home
- 86% English-only · Spanish 13% Other Indo-European 1%
Political lean MEDSL · Walton
- 2024 margin
- Solid R (+57.8) · D 20.7% · R 78.6%
- 2008→2024 swing
- -12.0pp toward R · 2008: -45.8pp · 2024: -57.8pp
- All cycles
- 2024: R+57.8 2020: R+51.7 2016: R+56.1 2012: R+52.0 2008: R+45.8
Not yet ingested
- Civics
- —
Market trends
- HPI YoY
- ▼ -15.18%
- Current HPI
- 350.4692
- Rent YoY
- ▲ 1.40%
- Metro
- Crestview-Fort Walton Beach-Destin, FL
- State GDP YoY
- ▲ 3.28%
- F500 in state
- 36
Industry mix (Fortune 500 HQ in FL)
| Industry | F500 HQs | Revenue |
|---|---|---|
| Industrial Technology | 2 | $29B |
|
||
| Insurance | 2 | $17B |
|
||
| Retail | 1 | $60B |
|
||
| Technology Distribution | 1 | $58B |
|
||
| Homebuilding | 1 | $35B |
|
||
| Technology Manufacturing | 1 | $35B |
|
||
Price history
-97.8% since first listed5 events — show timeline
- 2026-04-23 Pending — ECAR
- 2026-02-19 Price Changed $359,022 ECAR
- 2026-02-19 Price Changed $339,022 ECAR
- 2026-02-10 Listed $359,022 ECAR
- 2024-12-09 Sold (Public Records) $16,462,500 Public Records
Cash-flow waterfall
monthlySold comps — $/sqft
last 12 mo · ≤1 miLoading sold comps…