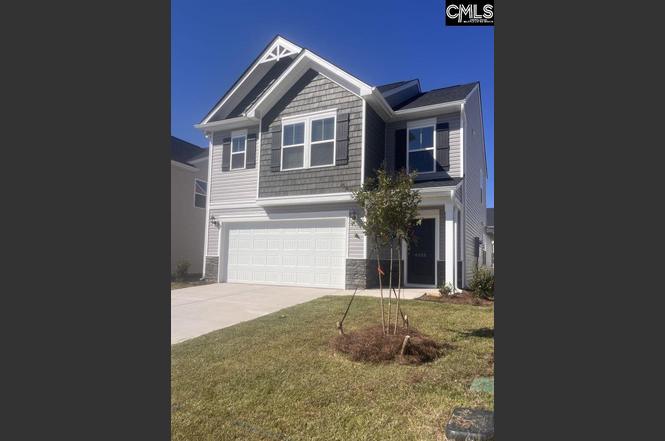
4033 Half Mast Loop · Columbia, SC
Flood risk No data
- FEMA flood zone
- —
- Chance of flooding over 30 yrs
- —
- Est. flood insurance / yr
- —
Fire risk No data
- Est. fire insurance / yr
- —
Heat risk No data
- Hot days now (above threshold)
- —
- Hot days in 30 yrs
- —
Wind risk No data
- Chance of severe wind over 30 yrs
- —
Air-quality risk No data
- Unhealthy air days now
- —
- Unhealthy air days in 30 yrs
- —
Risk factors via First Street. Map © Google.
Why this score? — see what drove the D- grade
The composite is a weighted blend of 9 inputs, each scored 0–100. Each bar is that input's sub-score; the figure is the points it added to the 100-point composite (weight × sub-score).
- Cash flow +11.1/30.0
- ARV discount +7.5/15.0
- Condition / age +4.0/5.0
- Livability +3.9/5.0
- Schools +3.6/10.0
- 1% rule +3.4/10.0
- DSCR +3.2/10.0
- Rent growth +3.2/5.0
- Appreciation +0.0/10.0
$305,900
🖨 Deal sheet (PDF) 📄 Offer letter ✓ Due diligence
Listing remarks
Ready in MAY!!!! A large (PRIVATE natural habitat) homesite with gorgeous treelined rear yard! This is a Keystone T Floorplan. Are you desiring a HUGE homesite with Privacy-This is it! Experience the comfort and convenience of having the primary bedroom on the main level. The kitchen is a chef's delight, featuring stainless steel appliances, including a gas stove, dishwasher, microwave, and side-by-side refrigerator. White shaker cabinets, a stylish tiled backsplash, and sleek quartz countertops, with designer pendants. The main level boasts durable Mohawk RevWood laminate flooring, while the laundry room, bathrooms feature elegant, tiled flooring, and carpet areas boast an 8lb. pad for
Key facts
- Tiled backsplash
- Treelined rear yard
- Gas stove
Tags
Property features AI
Finance
- HOA & community: Community has an association; Sidewalks in the community; New construction warranty from builder
Exterior
- Parking: Attached 2-car garage
- Utilities: Public water; Public sewer
- Home design: Single-family home; Stone and vinyl exterior finish; Slab foundation
- Construction: Slab foundation
- Exterior features: Full gutters; Uncovered front porch; Covered back porch; Paved road access; Quarter-acre lot
Interior
- Kitchen: Island with nook and pantry; Quartz countertops with tiled backsplash; Laminate flooring in kitchen; Dishwasher, disposal, microwave above stove, refrigerator, icemaker; Free-standing gas range
- Bedrooms: Primary bedroom on main level with private bath, separate shower, double vanity, walk-in closet, and carpeted floors; Three secondary bedrooms on second level each with double vanities, shared baths, tub/shower combinations, walk-in closets, and carpeted floors
- Flooring: Carpet in bedrooms; Laminate flooring in great room and kitchen
- Bathrooms: Two full bathrooms; One additional full bathroom on second level; One half bathroom on main level; Double vanities in primary and secondary bathrooms
- Heating & cooling: Central cooling; Heat pumps serving first and second levels; Gas heating on first and second levels; Zoned heating
- Interior features: Ceiling fans throughout; Garage door opener; Pull-down attic access
- Laundry & utility: Tankless hot water; Gas water heater
Neighborhood map
What this means for you Summary
Snapshot
- This is a 4-bed/3.0-bath single-family listed at $306k. Condition is rated good.
Deal economics
- At list price, monthly cash flow is $-121 ($-1k/yr) — negative.
- To cash-flow at today's rent, offer at most $288k (5.7% below list).
- To meet the 1% rule (rent ≥ 1% of price), the offer needs to be $256k (16.2% below list).
- Recommended offer: $256k (16.2% below list) — sets the bar for 1% rule.
Location & tenants
- Location reads 78/100 on livability (#18 in SC, #2,436 nationally) — a middle-class / working-renter tenant base. Strengths: amenities A+, commute A+, cost of living A+; Watch: employment D, crime F.
- Richland 02 (suburban): math 35% / reading 47% proficiency, ranked #29 of 80 in SC (top 36%) — families likely to look elsewhere, expect single-tenant / working-renter base with shorter leases.
- Zoned schools: Pontiac Elementary (math 39% / reading 35%, grade F, #315 of 597 statewide, top 55%, 724 students, 68% FRL); Spring Valley High (math 53% / reading 92%, grade B+, #46 of 196 statewide, top 24%, 2,187 students, 49% FRL) — zoned schools average 58% FRL vs 38% district-wide (20 pts higher); higher-poverty schools than district average — tighter screening recommended.
- Zoned-school proficiency averages 55% at this address vs 41% district-wide (+14 pts) — the actual schools serving this property are materially stronger than the Richland 02 average implies; a family-tenant draw the district grade alone would hide.
- Market conditions: Rents rising (+2.8%/yr); 417 active listings in the ZIP; 4 comparable units currently listed for rent nearby; rentals at typical pace (median 17d on market — plan ~3-4 weeks tenant-placement turnaround); 3,472 units permitted in Richland County in 2024 (1,096 in 5+ unit buildings).
- This rent runs 42% of the median local income ($74k/yr) — at the standard rent-burdened threshold; future hikes will face affordability resistance.
Forward outlook
- Local home prices are declining (-3.0%/yr); year-one equity from $2k of loan paydown is wiped out by about $9k of value loss. Plan a longer hold.
- Richland County population projected at +30% by 2050 — long-run rental-demand tailwind backs the buy-and-hold thesis.
Negotiation context
- It's been on market 98 days — a 9% lower offer ($278k) is reasonable based on typical stale-listing flexibility.
Questions for the listing agent
- What do current leases actually rent for vs. the listed asking? Can we see a recent rent roll and the last 12 months of T-12 income?
- It's been on market 98 days. Have you received any prior offers? Is the seller open to a 16% concession, seller financing, or rate buy-down credit?
- What does the HOA fee cover, when was the last increase, and are there any pending special assessments or reserve-fund shortfalls?
- Why hasn't it sold? Are there any deal-killer items the seller is aware of (foundation, flood, title, zoning, code violations)?
- Is there a deadline driving the sale (1031 exchange, divorce, estate, relocation)? That informs how much negotiation room exists.
- Schools are D-rated, which usually means shorter tenancies and higher turnover. Who's the typical renter profile here, and what's been the actual vacancy rate?
- Crime grade is F in this area — have there been break-ins, vandalism, or insurance claims at this property in the last 3 years? What carrier currently insures it and at what premium?
- The area grade is low — what's the realistic commute time and amenity access for the typical tenant pool here? Any planned neighborhood developments (good or bad) we should know about?
- What's the average days-on-market for RENTAL listings here right now (not sales)? A rising rental-DOM trend means longer vacancies and softer asking-rent achievability than the comps imply.
- What's the recent tenant-quality profile in this submarket — average credit score on applications, eviction rate, late-payment / NSF rate, and stable-employment percentage? A property-management company in the area should have these aggregated.
- How much new for-sale + rental construction is in the pipeline within 1–3 miles? Heavy new supply typically softens prices + rents 12–24 months out; constrained supply supports both.
Investment metrics
- 1% rule
- 0.84% ✗
- Cap rate
- 5.82%
- Cash-on-cash
- -1.70%
- DSCR
- 0.92
- GRM
- 9.9
CMA / ARV
No comps found within radius.
Projected returns pro-forma
-3.0% appreciation · 2.81% rent growth · sell at horizon
- IRR
- -19.3%
- Equity multiple
- 0.33×
- Total profit
- $-57,720
- Equity at exit
- $45,611
- IRR
- -12.3%
- Equity multiple
- 0.28×
- Total profit
- $-61,964
- Equity at exit
- $26,449
Cash invested: $85,652 (down + closing). Projections, not guarantees.
Landlord ↔ Tenant lean methodology
- Overall (STATE)
- 90 Strongly Landlord-Friendly
- State South Carolina
- 90 Strongly Landlord-Friendly · R+6
- County
- — inherits STATE
- City
- — inherits STATE
ZIP-level market 29229
- Home prices YoY
- -21.5%
- Rents YoY
- 2.8%
- Active inventory
- 417
- Price-to-rent
- 9.9×
Monthly cashflow live
- Estimated rent
- $2,563 medium interval (Pro) →
- Mortgage (P&I)
- −$1,604
- Tax est. 1.5%
- −$382 /mo · $4,588/yr
- Insurance
- −$127
- HOA
- −$32
- Vacancy / Maint / Mgmt
- −$538
- Net cashflow
- $-121
Break-even live
Sensitivity live
| Price | -10% $90 | -5% $-16 | +0% $-121 | +5% $-227 | +10% $-333 |
|---|---|---|---|---|---|
| Rent | -10% $-324 | -5% $-222 | +0% $-121 | +5% $-20 | +10% $81 |
| Rate | -1.0pp $33 | -0.5pp $-43 | base $-121 | +0.5pp $-200 | +1.0pp $-281 |
UW: 25.0% down · 7.5% · 30yr · 1.5% tax · 5.0% vac · 8.0% maint · 8.0% mgmt
Financing live
Cash to close
- Down payment
- $76,475
- Closing costs
- $9,177
- Reserves months
- —
- Total cash needed
- —
Loan-product check · same deal, 3 products live
Conventional
25% down · 7.5% · 30yr
- Down + closing
- —
- Monthly P&I
- —
- Monthly cashflow
- —
- DSCR
- —
- Eligible?
- —
Personal DTI + credit; lowest rate.
DSCR
20% down · 8.5% · 30yr
- Down + closing
- —
- Monthly P&I
- —
- Monthly cashflow
- —
- DSCR
- —
- Eligible?
- —
No personal income docs; deal must DSCR.
Hard money
10% down · 12.0% · 12mo
- Down + closing
- —
- Monthly P&I
- —
- Monthly cashflow
- —
- DSCR
- —
- Eligible?
- —
Short-term bridge; refi at stabilization.
Rent comps 4 comps
| Address | Beds | Baths | Sqft | Rent | $/sqft | DOM | Units | Dist |
|---|---|---|---|---|---|---|---|---|
| 1102 Semoran Way Columbia, SC | 3.0–4.0 | 2.5 | 1488 | $2,775 | $1.86 | 4d | 16 | 0.45mi |
| 837 Peony LN Columbia, SC | 3.0 | 2.5 | 1996 | $2,500 | $1.25 | 23d | 1 | 0.63mi |
| 1074 Cornelia St Elgin, SC | 3.0 | 2.5 | 1432 | $1,995 | $1.39 | 5d | 1 | 1.24mi |
| 1315 Montford Dr Elgin, SC | 4.0 | 3.0 | 1959 | $2,300 | $1.17 | 16d | 1 | 1.26mi |
HOA detail
- Monthly dues
- $32 · $384/yr
- Likely covers
- gas
Listing history 17 events
-
2026-06-22days on market $305,900 Active 98 DOM
-
2026-06-18days on market $305,900 Active 95 DOM
-
2026-06-17days on market $305,900 Active 94 DOM
-
2026-06-16days on market $305,900 Active 93 DOM
-
2026-06-15days on market $305,900 Active 92 DOM
-
2026-06-14days on market $305,900 Active 90 DOM
-
2026-06-13days on market $305,900 Active 89 DOM
-
2026-06-10days on market $305,900 Active 87 DOM
-
2026-06-09days on market $305,900 Active 86 DOM
-
2026-06-08days on market $305,900 Active 85 DOM
-
2026-06-07days on market $305,900 Active 84 DOM
-
2026-06-05days on market $305,900 Active 81 DOM
-
2026-06-03days on market $305,900 Active 80 DOM
-
2026-06-03days on market $305,900 Active 79 DOM
-
2026-06-01days on market $305,900 Active 78 DOM
-
2026-05-31days on market $305,900 Active 77 DOM
-
2026-03-15$305,900 Active
ⓘ Source: listings_history table (triggers on properties + properties_extension) + one-shot
backfill from property_details.listing_events for pre-trigger history.
Nearby sold comps map
Loading sold comps map…
Walkable amenities ~0.75 mi
Loading nearby amenities…
Taxation est. · year 1
- Rental income
- $30,756
- − Mortgage interest
- −$17,135
- − Property taxes
- −$4,588
- − Insurance
- −$1,530
- − Repairs & maintenance
- −$2,461
- − Management
- −$2,461
- − HOA
- −$384
- − Depreciation
- −$8,899
- Taxable loss
- −$6,701
- Est. tax savings @ 24.0%
- +$1,608
- After-tax cash flow
- $154/yr
For passive investors: Depreciation is non-cash, so a rental often shows a tax loss while cash-flowing — sheltering income. Rental losses are passive: they offset passive income freely, and up to $25,000/yr can offset ordinary (W-2) income if you actively participate and your MAGI is under $100k (phasing out to $0 by $150k); unused losses carry forward. On sale, claimed depreciation is recaptured at up to 25%, and gains may owe capital-gains tax (a 1031 exchange can defer both). Figures are a year-1 estimate at your 24.0% rate — not tax advice; consult a CPA.
Condition & rehab AI · 13 photos
This home is in excellent condition with a good condition score of 80. It is move-in ready with minimal maintenance required. The home has a good curb appeal and is ready for a new owner.
Value-add opportunities
- Both Painting exterior siding — Enhances curb appeal and value.
- Both Landscaping improvements — Enhances curb appeal and value.
- Both Replace carpet in bedrooms — Improves comfort and appearance in bedrooms.
Renovation cost estimate screening
Value-add ROI direction
- Both Painting exterior siding — Enhances curb appeal and value. ↑
- Both Landscaping improvements — Enhances curb appeal and value. ↑
- Both Replace carpet in bedrooms — Improves comfort and appearance in bedrooms. ↑
ⓘ Cost ranges are severity-bucket heuristics (US national rule-of-thumb). Get contractor quotes + a written scope before underwriting a rehab budget.
Schools (NCES district)
- District
- Richland 02
- NCES district ID
- 4503390
- Math proficiency
- 35% ▼ -15.00%
- Reading proficiency
- 47% ▼ -5.00%
- Median HH income
- $59,684
- Composite
- 36.2/100
- National rank
- #4730
- State rank
- #29 of 80 in SC
Livability — Columbia
- Score
- 78/100
- State rank
- #18
- US rank
- #2436
Category grades
Schools grade is shown separately in the Schools card above.
Census & demographics
- Census place
- Columbia, SC
- County
- Richland County · 389,530 people
- City population
- 335,994
- Metro
- Columbia, SC
- Population (ZIP)
- 51,861
- Household income
- $74,043
- Rent vs Own
- Severe rent burden
- 1939.0
Population outlook (Richland County) Hauer SSP2
- Today (2025)
- 459,667 people
- By 2030
- 487,524 · +6.1%
- By 2040
- 542,035 · +17.9%
- By 2050
- 595,371 · +29.5%
- By 2075
- 732,998 · +59.5%
- By 2100
- 820,415 · +78.5%
Race, ethnicity, and origin ACS 2023
- Neighborhood character
- Diverse neighborhood (Simpson 0.56)
- Race & ethnicity
- Black 62% White 24% Hispanic / Latino 8% Two or more races 6% Asian 3%
- Hispanic origin (detail)
- Mexican 2% Puerto Rican 2%
- Common ancestry
- Slovak 1% Lithuanian 1% Romanian 1%
- Foreign-born
- 7% · Canada, South Korea, Jamaica
- Languages at home
- 89% English-only · Spanish 6% Other Indo-European 1% Korean 1%
Political lean MEDSL · Richland
- 2024 margin
- Solid D (+34.6) · D 66.4% · R 31.8% · Other 1.8%
- 2008→2024 swing
- +5.7pp toward D · 2008: 28.9pp · 2024: 34.6pp
- All cycles
- 2024: D+34.6 2020: D+38.3 2016: D+32.9 2012: D+33.3 2008: D+28.9
Not yet ingested
- Civics
- —
Market trends
- HPI YoY
- ▼ -51.11%
- Current HPI
- 186.782
- Rent YoY
- ▲ 2.81%
- Metro
- Columbia, SC
- State GDP YoY
- ▲ 4.51%
- F500 in state
- 2
Industry mix (Fortune 500 HQ in SC)
| Industry | F500 HQs | Revenue |
|---|---|---|
| Packaging | 1 | $7B |
|
||
Price history
1 event — show timeline
- 2026-03-15 Listed $305,900 Consolidated MLS
Cash-flow waterfall
monthlySold comps — $/sqft
last 12 mo · ≤1 miLoading sold comps…