425 W Sierra Ave #9 · Cotati, CA
Flood risk 1/10 · Minimal
- FEMA flood zone
- X (unshaded)
- Chance of flooding over 30 yrs
- 0.0%
- Est. flood insurance / yr
- $507 – $1,088
Fire risk 5/10 · Moderate
- Est. fire insurance / yr
- $659 – $1,223
Heat risk 3/10 · Minor
- Hot days now (above 91°F)
- 7 days/yr
- Hot days in 30 yrs
- 15 days/yr
Wind risk 1/10 · Minimal
- Chance of severe wind over 30 yrs
- —
Air-quality risk 8/10 · Major
- Unhealthy air days now
- 14 days/yr
- Unhealthy air days in 30 yrs
- 15 days/yr
Risk factors via First Street. Map © Google.
Why this score? — see what drove the B grade
The composite is a weighted blend of 9 inputs, each scored 0–100. Each bar is that input's sub-score; the figure is the points it added to the 100-point composite (weight × sub-score).
- Cash flow +28.5/30.0
- ARV discount +10.4/15.0
- DSCR +10.0/10.0
- 1% rule +7.9/10.0
- Condition / age +4.0/5.0
- Livability +3.9/5.0
- Schools +3.7/10.0
- Rent growth +2.5/5.0
- Appreciation +0.0/10.0
$229,950
🖨 Deal sheet 📄 Offer letter ✓ Due diligence
Listing remarks
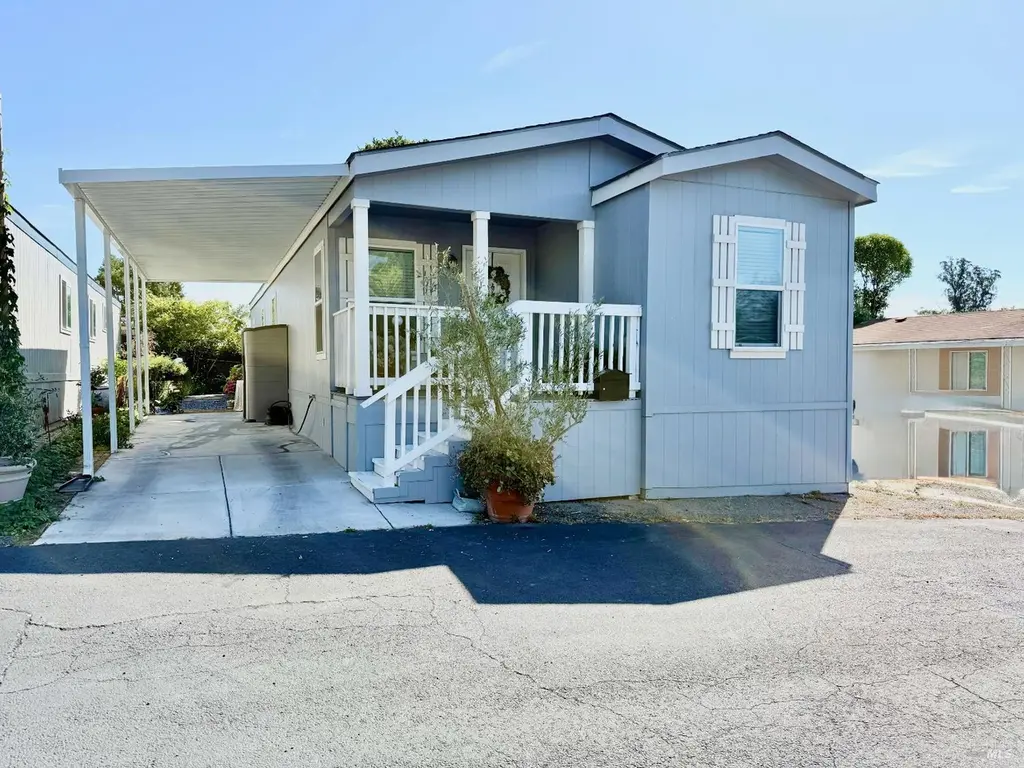
Built in 2024, this beautifully designed 3 bedroom, 2 bath manufactured home offers approximately 1,280 square feet of modern living space and may be just what you've been searching for. A welcoming front porch leads into the light and bright living room, creating an inviting atmosphere from the moment you arrive. The spacious kitchen features granite countertops, stainless steel appliances, abundant counter and cabinet space, and an eat-up bar that opens seamlessly to the dining area, making it perfect for both everyday living and entertaining. The private primary suite provides a relaxing retreat, while recessed lighting, carpeted bedrooms, and beautiful wood-like flooring add warmth and
Key facts
- Front porch
- Spacious kitchen
- Established gardens
Tags
Property features AI
Finance
- Financial info: Monthly land lease: $1,200
- HOA & community: No homeowners association; Not a senior community
Exterior
- Parking: Covered parking for 2 vehicles
- Utilities: Cable available; Internet available; Public sewer
- Home design: Manufactured in park; Double wide; Park lot is leased
- Construction: Champion Home Builders model CM 8603D; Wood skirting
- Exterior features: Composition roof; Located in a manufactured-home park
Interior
- Kitchen: Dishwasher; Free-standing gas range; Free-standing refrigerator
- Bedrooms: 3 bedrooms
- Flooring: Carpet; Simulated wood flooring
- Bathrooms: 2 full bathrooms; Shower stall(s); Tub with shower over
- Heating & cooling: Central heating; No cooling
- Interior features: Stone counters in the kitchen; Dining and living areas combined; Living room with other/undefined special feature
- Laundry & utility: Indoor laundry hookups
Neighborhood map
What this means for you Summary
Snapshot
- This is a 3-bed/2.0-bath manufactured listed at $230k. Condition is rated good.
Deal economics
- At list price, monthly cash flow is $749 ($9k/yr) — positive.
- The deal already cash-flows at list — no discount required.
- Meets the 1% rule at list price ($3k rent vs $230k).
- Recommended offer: $226k (1.5% below list) — sets the bar for market timing.
- Cap rate 10.2% vs local median 2.3% in Cotati — top-decile yield for the area; either an underpriced asset or a hidden risk that comps aren't pricing in. Stress-test before assuming the spread holds.
Location & tenants
- Location reads 77/100 on livability (#83 in CA, #3,115 nationally) — a middle-class / working-renter tenant base. Strengths: commute A+, employment A+, health & safety A+; Watch: schools D, cost of living F.
- Cotati-Rohnert Park Unified (suburban): math 24% / reading 61% proficiency, ranked #205 of 517 in CA (top 40%) — families likely to look elsewhere, expect single-tenant / working-renter base with shorter leases.
- Market conditions: 21 active listings in the ZIP; 12 comparable units currently listed for rent nearby; rentals at typical pace (median 24d on market — plan ~3-4 weeks tenant-placement turnaround); 42% of comp listings sitting > 30 days — soft ceiling on asking rent; solid renter incomes; 1,039 units permitted in Sonoma County in 2024 (185 in 5+ unit buildings).
- This rent runs 35% of the median local income ($102k/yr) — at the standard rent-burdened threshold; future hikes will face affordability resistance.
Forward outlook
- Local home prices are declining (-3.0%/yr); year-one equity from $2k of loan paydown is wiped out by about $7k of value loss. Plan a longer hold.
- Sonoma County population projected at +8% by 2050 — modest demand growth; plan on rents tracking national, not racing it.
- At projected returns (-3.0% appreciation + 3.0% rent growth), your $64k cash investment doubles in ~9 years — after that, you're playing with house money.
Negotiation context
- It's been on market 27 days — a 2% lower offer ($226k) is reasonable based on typical stale-listing flexibility.
Risks & watch-outs
- Climate carrying-cost: moderate wildfire risk — expect insurance premiums to compound above CPI over the hold.
Questions for the listing agent
- Is there a deadline driving the sale (1031 exchange, divorce, estate, relocation)? That informs how much negotiation room exists.
- Schools are D-rated, which usually means shorter tenancies and higher turnover. Who's the typical renter profile here, and what's been the actual vacancy rate?
- What's the average days-on-market for RENTAL listings here right now (not sales)? A rising rental-DOM trend means longer vacancies and softer asking-rent achievability than the comps imply.
- What's the recent tenant-quality profile in this submarket — average credit score on applications, eviction rate, late-payment / NSF rate, and stable-employment percentage? A property-management company in the area should have these aggregated.
- How much new for-sale + rental construction is in the pipeline within 1–3 miles? Heavy new supply typically softens prices + rents 12–24 months out; constrained supply supports both.
Investment metrics
- 1% rule
- 1.29% ✓
- Cap rate
- 10.20%
- Cash-on-cash
- 13.96%
- DSCR
- 1.62
- GRM
- 6.5
CMA / ARV
- ARV (on-the-fly)
- $245,760
- Comps found
- 5
Show comp detail 5 sales within ~0.75 mi
| Address | Dist | Beds/Ba | Sqft | Sold | Price | $/sf | Match |
|---|---|---|---|---|---|---|---|
| 425 W Sierra Ave #9 | 0.00mi | 3/2.0 | 1,280 (0%) | 13mo | $204,950 | $160 | 89 |
| 18 Terrace Dr #18 | 0.02mi | 3/2.0 | 1,248 (-2%) | 19mo | $204,950 | $164 | 79 |
| 31 Ramble Creek Dr | 0.33mi | 3/2.0 | 1,248 (-2%) | 17mo | $240,000 | $192 | 66 |
| 103 Silver Dr | 0.09mi | 2/2.0 (-1) | 1,180 (-8%) | 22mo | $290,000 | $246 | 60 |
| 522 Loma Verde Ln | 0.67mi | 3/2.0 | 1,176 (-8%) | 15mo | $275,000 | $234 | 42 |
Match score weights: distance 35% · size 25% · config 20% · recency 20%. Top-matched comps best support the ARV.
Projected returns pro-forma
-3.0% appreciation · 3.0% rent growth · sell at horizon
- IRR
- 4.2%
- Equity multiple
- 1.16×
- Total profit
- $10,503
- Equity at exit
- $34,286
- IRR
- 13.7%
- Equity multiple
- 2.10×
- Total profit
- $70,774
- Equity at exit
- $19,882
Cash invested: $64,386 (down + closing). Projections, not guarantees.
Landlord ↔ Tenant lean methodology
- Overall (STATE)
- 18 Strongly Tenant-Friendly
- State California
- 18 Strongly Tenant-Friendly · D+13
- County
- — inherits STATE
- City
- — inherits STATE
ZIP-level market 94931
- Active inventory
- 21
- Price-to-rent
- 6.5×
Monthly cashflow live
- Estimated rent
- $2,960 high interval (Pro) →
- Mortgage (P&I)
- −$1,206
- Tax est. 1.5%
- −$287 /mo · $3,449/yr
- Insurance
- −$96
- HOA
- −$0
- Vacancy / Maint / Mgmt
- −$622
- Net cashflow
- $749
Break-even live
UW: 25.0% down · 7.5% · 30yr · 1.5% tax · 5.0% vac · 8.0% maint · 8.0% mgmt
Financing live
Cash to close
- Down payment
- $57,488
- Closing costs
- $6,898
- Reserves months
- —
- Total cash needed
- —
Loan-product check · same deal, 3 products live
Conventional
25% down · 7.5% · 30yr
- Down + closing
- —
- Monthly P&I
- —
- Monthly cashflow
- —
- DSCR
- —
- Eligible?
- —
Personal DTI + credit; lowest rate.
DSCR
20% down · 8.5% · 30yr
- Down + closing
- —
- Monthly P&I
- —
- Monthly cashflow
- —
- DSCR
- —
- Eligible?
- —
No personal income docs; deal must DSCR.
Hard money
10% down · 12.0% · 12mo
- Down + closing
- —
- Monthly P&I
- —
- Monthly cashflow
- —
- DSCR
- —
- Eligible?
- —
Short-term bridge; refi at stabilization.
Rent comps 12 comps
| Address | Beds | Baths | Sqft | Rent | $/sqft | DOM | Units | Dist |
|---|---|---|---|---|---|---|---|---|
| 8908 Gravenstein Way Cotati, CA | 4.0 | 3.0 | 1540 | $3,650 | $2.37 | 14d | 1 | 0.80mi |
| 8271 Lancaster Dr Cotati, CA | 3.0 | 3.5 | 1614 | $3,500 | $2.17 | 21d | 1 | 1.04mi |
| 7300 Boris Ct Unit 4 Rohnert Park, CA | 2.0 | 1.0 | 1000 | $2,250 | $2.25 | 43d | 1 | 1.10mi |
| 7300 Boris Ct Apt 17 Rohnert Park, CA | 2.0 | 1.0 | 1000 | $2,250 | $2.25 | 21d | 1 | 1.10mi |
| 7300 Boris Ct Apt 17 Rohnert Park, CA | 2.0 | 1.0 | 1000 | $2,350 | $2.35 | 43d | 1 | 1.10mi |
| 7300 Boris Ct Unit 4 Rohnert Park, CA | 2.0 | 1.0 | 1000 | $2,350 | $2.35 | 23d | 1 | 1.10mi |
| 7300 Boris Ct Apt 17 Rohnert Park, CA | 2.0 | 1.0 | 1000 | $2,250 | $2.25 | 23d | 1 | 1.10mi |
| 445 Southwest Blvd Unit 10 Rohnert Park, CA | 3.0 | 2.0 | 1250 | $2,699 | $2.16 | 43d | 1 | 1.13mi |
| 8545 Liman Way Rohnert Park, CA | 3.0 | 2.0 | 1120 | $3,600 | $3.21 | 43d | 1 | 1.16mi |
| 8244 Windmill Farms Dr Unit 1 Cotati, CA | 2.0 | 1.5 | 989 | $2,400 | $2.43 | 43d | 1 | 1.38mi |
| 100 Avram Ave Rohnert Park, CA | 3.0 | 1.0–2.0 | 1267 | $3,400 | $2.68 | 3d | 1 | 1.43mi |
| 7272 Camino Colegio Rohnert Park, CA | 1.0–2.0 | 1.0–2.0 | 839 | $2,500 | $2.98 | 13d | 1 | 1.48mi |
Listing history 17 events
-
2026-06-18days on market $229,950 Active 27 DOM
-
2026-06-17days on market $229,950 Active 26 DOM
-
2026-06-16days on market $229,950 Active 25 DOM
-
2026-06-15days on market $229,950 Active 24 DOM
-
2026-06-14days on market $229,950 Active 22 DOM
-
2026-06-13days on market $229,950 Active 21 DOM
-
2026-06-10pricedays on market $229,950 Active 19 DOM
-
2026-06-09days on market $239,000 Active 18 DOM
-
2026-06-08days on market $239,000 Active 17 DOM
-
2026-06-07days on market $239,000 Active 16 DOM
-
2026-06-05days on market $239,000 Active 13 DOM
-
2026-06-03days on market $239,000 Active 12 DOM
-
2026-06-02days on market $239,000 Active 11 DOM
-
2026-06-01days on market $239,000 Active 10 DOM
-
2026-05-31days on market $239,000 Active 9 DOM
-
2026-05-30days on market $239,000 Active 8 DOM
-
2026-05-22$239,000 Active
ⓘ Source: listings_history table (triggers on properties + properties_extension) + one-shot
backfill from property_details.listing_events for pre-trigger history.
Climate risk First Street
- Flood 1/10 Low FEMA zone X (unshaded) · 0% chance over 30 yrs
- Wildfire 5/10 Major
- Heat 3/10 Moderate 7 d/yr ≥91°F today · 15 d/yr by 30 yrs out
- Wind 1/10 Low
- Air quality 8/10 Severe 14 unhealthy d/yr today · 15 by 30 yrs out
Nearby sold comps map
Loading sold comps map…
Walkable amenities ~0.75 mi
Loading nearby amenities…
Taxation est. · year 1
- Rental income
- $35,520
- − Mortgage interest
- −$12,881
- − Property taxes
- −$3,449
- − Insurance
- −$1,150
- − Repairs & maintenance
- −$2,842
- − Management
- −$2,842
- − Depreciation
- −$6,689
- Taxable income
- $5,667
- Est. tax owed @ 24.0%
- −$1,360
- After-tax cash flow
- $7,631/yr
For passive investors: Depreciation is non-cash, so a rental often shows a tax loss while cash-flowing — sheltering income. Rental losses are passive: they offset passive income freely, and up to $25,000/yr can offset ordinary (W-2) income if you actively participate and your MAGI is under $100k (phasing out to $0 by $150k); unused losses carry forward. On sale, claimed depreciation is recaptured at up to 25%, and gains may owe capital-gains tax (a 1031 exchange can defer both). Figures are a year-1 estimate at your 24.0% rate — not tax advice; consult a CPA.
Condition & rehab AI · 6 photos
This beautifully designed 3-bedroom, 2-bath manufactured home is in good condition with minimal repairs needed. It offers modern living space and is move-in ready.
Value-add opportunities
- Both Painting exterior siding — Enhances curb appeal and value.
- Both Landscaping improvements — Enhances curb appeal and value.
- Both Replace worn-out carpet — Improves comfort and value.
- Both Replace worn-out wood-like flooring — Improves comfort and value.
Renovation cost estimate screening
Value-add ROI direction
- Both Painting exterior siding — Enhances curb appeal and value. ↑
- Both Landscaping improvements — Enhances curb appeal and value. ↑
- Both Replace worn-out carpet — Improves comfort and value. ↑
- Both Replace worn-out wood-like flooring — Improves comfort and value. ↑
ⓘ Cost ranges are severity-bucket heuristics (US national rule-of-thumb). Get contractor quotes + a written scope before underwriting a rehab budget.
Schools (NCES district)
- District
- Cotati-Rohnert Park Unified
- NCES district ID
- 0609940
- Math proficiency
- 24% ▼ -6.00%
- Reading proficiency
- 61% ▲ 15.00%
- Median HH income
- $60,499
- Composite
- 37.42/100
- National rank
- #4420
- State rank
- #205 of 517 in CA
Livability — Cotati
- Score
- 77/100
- State rank
- #83
- US rank
- #3115
Category grades
Schools grade is shown separately in the Schools card above.
Census & demographics
- Census place
- Cotati, CA
- County
- Sonoma County · 449,805 people
- City population
- 9,487
- Metro
- Santa Rosa-Petaluma, CA
- Population (ZIP)
- 9,487
- Household income
- $101,994
- Rent vs Own
- Severe rent burden
- 215.0
Population outlook (Sonoma County) Hauer SSP2
- Today (2025)
- 539,935 people
- By 2030
- 554,870 · +2.8%
- By 2040
- 573,262 · +6.2%
- By 2050
- 580,715 · +7.6%
- By 2075
- 579,229 · +7.3%
- By 2100
- 547,835 · +1.5%
Race, ethnicity, and origin ACS 2023
- Neighborhood character
- Predominantly White (70%)
- Race & ethnicity
- White 70% Hispanic / Latino 19% Two or more races 14% Native American 3% Asian 2% Black 1%
- Hispanic origin (detail)
- Mexican 12% Puerto Rican 1%
- Common ancestry
- Lithuanian 5% Slovak 3% Romanian 3%
- Foreign-born
- 10% · Canada, Dominican Republic, China
- Languages at home
- 85% English-only · Spanish 11% Other Indo-European 1% French/Haitian/Cajun 1%
Political lean MEDSL · Sonoma
- 2024 margin
- Solid D (+46.2) · D 71.4% · R 25.2% · Other 3.3%
- 2008→2024 swing
- -3.4pp toward R · 2008: 49.6pp · 2024: 46.2pp
- All cycles
- 2024: D+46.2 2020: D+51.5 2016: D+47.9 2012: D+44.9 2008: D+49.6
Not yet ingested
- Civics
- —
Market trends
- HPI YoY
- ▼ -236.26%
- Current HPI
- 236.0125
- Rent YoY
- —
- Metro
- Santa Rosa-Petaluma, CA
- State GDP YoY
- ▲ 3.21%
- F500 in state
- 116
Industry mix (Fortune 500 HQ in CA)
| Industry | F500 HQs | Revenue |
|---|---|---|
| Technology | 27 | $1,492B |
|
||
| Financial Services | 3 | $174B |
|
||
| Retail | 3 | $44B |
|
||
| Insurance | 3 | $26B |
|
||
| Media / Entertainment | 2 | $115B |
|
||
| Pharmaceuticals / Biotech | 2 | $62B |
|
||
Price history
1 event — show timeline
- 2026-05-22 Listed $239,000 BAREIS
Cash-flow waterfall
monthlySold comps — $/sqft
last 12 mo · ≤1 miLoading sold comps…