 Duplex
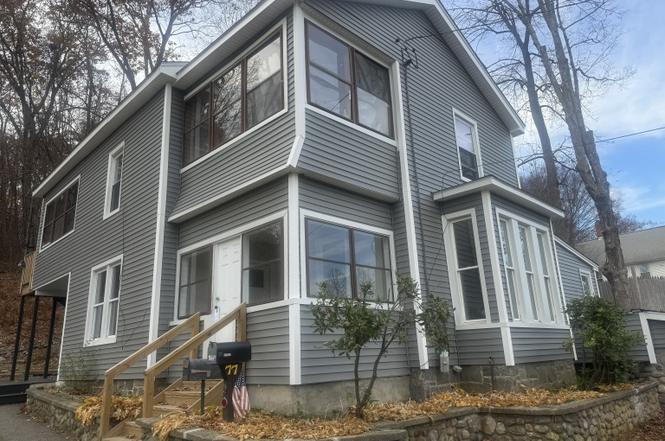
77 Hubbard St · Winsted, CT
Flood risk No data
- FEMA flood zone
- —
- Chance of flooding over 30 yrs
- —
- Est. flood insurance / yr
- —
Fire risk No data
- Est. fire insurance / yr
- —
Heat risk No data
- Hot days now (above threshold)
- —
- Hot days in 30 yrs
- —
Wind risk No data
- Chance of severe wind over 30 yrs
- —
Air-quality risk No data
- Unhealthy air days now
- —
- Unhealthy air days in 30 yrs
- —
Risk factors via First Street. Map © Google.
Why this score? — see what drove the B- grade
The composite is a weighted blend of 9 inputs, each scored 0–100. Each bar is that input's sub-score; the figure is the points it added to the 100-point composite (weight × sub-score).
- Cash flow +27.5/30.0
- DSCR +9.6/10.0
- ARV discount +9.0/15.0
- 1% rule +7.0/10.0
- Schools +4.6/10.0
- Livability +4.0/5.0
- Rent growth +2.5/5.0
- Condition / age +2.5/5.0
- Appreciation +0.0/10.0
$299,900
🖨 Deal sheet (PDF) 📄 Offer letter ✓ Due diligence
Multi-family units
County records classify this as Multi-Family (2-4 Unit). Listing-text estimate: 2 units. confirmed
Listing remarks
Discover this versatile two-family residence offering a blend of modern updates and timeless charm. Each unit boasts three bedrooms and a full bath, providing ample space and comfort for tenants or multi-generational living. The first-floor unit has been beautifully renovated, featuring a brand-new kitchen with stylish finishes, updated bath, gleaming hardwood floors, and plush new carpet in the bedrooms. This level offers a fresh, move-in-ready appeal that renters or owners will love. The second-floor unit retains its original character, ideal for those looking to add personal touches or appreciate classic details. With newer siding and a recently updated roof, this property promises low-m
Key facts
- 0.28 acre lot
- Built 1864
- Listed 35 days
Tags
Neighborhood map
What this means for you Summary
Snapshot
- This is a 2 × 3-bed/1.0-bath units multifamily listed at $300k.
Deal economics
- At list price, monthly cash flow is $882 ($11k/yr) — positive. Per door: $441/mo.
- The deal already cash-flows at list — no discount required.
- Meets the 1% rule at list price ($4k rent vs $300k).
- Recommended offer: $291k (3.0% below list) — sets the bar for market timing.
- Cap rate 9.8% vs local median 3.9% in Winsted — top-decile yield for the area; either an underpriced asset or a hidden risk that comps aren't pricing in. Stress-test before assuming the spread holds.
Location & tenants
- Location reads 80/100 on livability (#25 in CT, #1,955 nationally) — a professional / high-income tenant draw. Strengths: housing A+, health & safety A+, cost of living A; Watch: amenities F, employment D-.
- Winchester School District (town): math 53% / reading 49% proficiency, ranked #131 of 192 in CT (top 68%) — acceptable for families but not a draw, mixed tenant base, ~2y average lease.
- Zoned schools: Pearson School (math 42% / reading 47%, grade F, #272 of 553 statewide, top 50%, 294 students, 60% FRL) — zoned schools average 60% FRL vs 41% district-wide (19 pts higher); higher-poverty schools than district average — tighter screening recommended.
- Market conditions: 63 active listings in the ZIP; 154 units permitted in Northwest Hills Planning Region in 2024 (6 in 5+ unit buildings).
- At $3,604/mo this rent would consume 65% of the median local household income ($66k/yr) (locally 576% of renters already pay >50% of income on rent) — very limited rent-growth headroom before tenants either downsize or default.
Forward outlook
- Local home prices are declining (-3.0%/yr); year-one equity from $2k of loan paydown is wiped out by about $9k of value loss. Plan a longer hold.
- At projected returns (-3.0% appreciation + 3.0% rent growth), your $84k cash investment doubles in ~9 years — after that, you're playing with house money.
Negotiation context
- It's been on market 35 days — a 3% lower offer ($291k) is reasonable based on typical stale-listing flexibility.
- 9 sale attempts since 26y ago with the ask held roughly flat each time — persistent listings suggest the price (not the market) is what's stuck; bring a comps-based counter.
- Current owner paid $180k; list at $300k implies a 67% gain — meaningful room to come down on a strong offer.
Risks & watch-outs
- Watch-outs: built in 1864 — expect roof / HVAC / electrical / plumbing capex.
Questions for the listing agent
- It's been on market 35 days. Have you received any prior offers? Is the seller open to a 3% concession, seller financing, or rate buy-down credit?
- Can we see the unit-by-unit rent roll, current vacancy, and any below-market leases? What's the average tenancy length?
- What capital expenditures (roof, boiler, parking lot, exteriors) have been made in the last 5 years, and what's planned in the next 2?
- Built in 1864 — when were the roof, HVAC, electrical panel, plumbing, and water heater last replaced?
- Is there a deadline driving the sale (1031 exchange, divorce, estate, relocation)? That informs how much negotiation room exists.
- What's the average days-on-market for RENTAL listings here right now (not sales)? A rising rental-DOM trend means longer vacancies and softer asking-rent achievability than the comps imply.
- What's the recent tenant-quality profile in this submarket — average credit score on applications, eviction rate, late-payment / NSF rate, and stable-employment percentage? A property-management company in the area should have these aggregated.
- How much new apartment / multifamily construction is in the pipeline within 1–3 miles? Heavy new supply (>2% of stock underway) typically softens rents 12–24 months out; light construction supports rent growth.
Investment metrics
- 1% rule
- 1.20% ✓
- Cap rate
- 9.82%
- Cash-on-cash
- 12.61%
- DSCR
- 1.56
- GRM
- 6.9
CMA / ARV
- ARV (on-the-fly)
- $310,385
- Comps found
- 5
Show comp detail 5 sales within ~0.75 mi
| Address | Dist | Beds/Ba | Sqft | Sold | Price | $/sf | Match |
|---|---|---|---|---|---|---|---|
| 63 Meadow St | 0.19mi | 5/3.0 | 2,602 (-4%) | 17mo | $330,000 | $127 | 67 |
| 267 Rockwell St | 0.38mi | 4/3.0 (-1) | 2,861 (+6%) | 9mo | $302,500 | $106 | 56 |
| 18 Upland Rd | 0.27mi | 5/2.0 | 2,338 (-13%) | 14mo | $290,000 | $124 | 54 |
| 10 Crescent St | 0.73mi | 4/2.0 (-1) | 2,444 (-9%) | 6mo | $280,000 | $115 | 41 |
| 30 Rock St | 0.59mi | 4/2.0 (-1) | 2,299 (-15%) | 7mo | $235,000 | $102 | 37 |
Match score weights: distance 35% · size 25% · config 20% · recency 20%. Top-matched comps best support the ARV.
Projected returns pro-forma
-3.0% appreciation · 3.0% rent growth · sell at horizon
- IRR
- 2.4%
- Equity multiple
- 1.09×
- Total profit
- $7,593
- Equity at exit
- $44,716
- IRR
- 11.9%
- Equity multiple
- 1.94×
- Total profit
- $78,931
- Equity at exit
- $25,930
Cash invested: $83,972 (down + closing). Projections, not guarantees.
Landlord ↔ Tenant lean methodology
- Overall (STATE)
- 27 Tenant-Leaning
- State Connecticut
- 27 Tenant-Leaning · D+7
- County
- — inherits STATE
- City
- — inherits STATE
ZIP-level market 06098
- Home prices YoY
- -19.2%
- Active inventory
- 63
- Price-to-rent
- 13.9×
Monthly cashflow live
- Estimated rent
- $3,604 medium interval (Pro) →
- Mortgage (P&I)
- −$1,573
- Tax from tax record
- −$267 /mo · $3,205/yr
- Insurance
- −$125
- HOA
- −$0
- Vacancy / Maint / Mgmt
- −$757
- Net cashflow
- $882
Break-even live
Sensitivity live
| Price | -10% $1,052 | -5% $967 | +0% $882 | +5% $798 | +10% $713 |
|---|---|---|---|---|---|
| Rent | -10% $598 | -5% $740 | +0% $882 | +5% $1,025 | +10% $1,167 |
| Rate | -1.0pp $1,033 | -0.5pp $959 | base $882 | +0.5pp $805 | +1.0pp $726 |
2-unit breakdown (identical units grouped — click to expand)
| Units | Beds | Baths | Est. rent |
|---|---|---|---|
| 2× units | 3 | 1 | $3,604 |
| #1 | 3 | 1 | $1,802 |
| #2 | 3 | 1 | $1,802 |
| Total (2 units) | $3,604 | ||
UW: 25.0% down · 7.5% · 30yr · 1.5% tax · 5.0% vac · 8.0% maint · 8.0% mgmt
Financing live
Cash to close
- Down payment
- $74,975
- Closing costs
- $8,997
- Reserves months
- —
- Total cash needed
- —
Loan-product check · same deal, 3 products live
Conventional
25% down · 7.5% · 30yr
- Down + closing
- —
- Monthly P&I
- —
- Monthly cashflow
- —
- DSCR
- —
- Eligible?
- —
Personal DTI + credit; lowest rate.
DSCR
20% down · 8.5% · 30yr
- Down + closing
- —
- Monthly P&I
- —
- Monthly cashflow
- —
- DSCR
- —
- Eligible?
- —
No personal income docs; deal must DSCR.
Hard money
10% down · 12.0% · 12mo
- Down + closing
- —
- Monthly P&I
- —
- Monthly cashflow
- —
- DSCR
- —
- Eligible?
- —
Short-term bridge; refi at stabilization.
Listing history 21 events
-
2024-12-16status Under Contract
-
2024-12-13historical Under Contract - Continue to Show
-
2024-11-11$299,900 Active
-
2013-04-10historical
-
2011-04-10$78,900
-
2010-11-22historical
-
2009-11-22$153,999
-
2009-09-16historical
-
2008-12-15$174,900
-
2008-11-09historical
-
2008-05-10$189,900
-
2008-04-22historical
-
2007-11-12$194,900
-
2005-08-05soldstatus $180,000
-
2005-08-05soldstatus $180,000
-
2005-08-05soldstatus $180,000
-
2005-08-05soldstatus $180,000
-
2005-03-18$205,000
-
2004-12-18$189,000
-
2000-12-15soldstatus $139,700
-
2000-05-03$134,900
ⓘ Source: listings_history table (triggers on properties + properties_extension) + one-shot
backfill from property_details.listing_events for pre-trigger history.
Tax reassessment forecast CT · Partial reset (capped growth)
- Current annual tax
- $3,205 · $267/mo
- Projected year-2 tax
- $4,811 · $401/mo
- Expected delta
- +$1,606/yr (+$134/mo · 50.1%)
ⓘ Screening estimate from a state-policy table — verify with the county assessor before closing.
Nearby sold comps map
Loading sold comps map…
Walkable amenities ~0.75 mi
Loading nearby amenities…
Taxation est. · year 1
- Rental income
- $43,248
- − Mortgage interest
- −$16,799
- − Property taxes
- −$3,205
- − Insurance
- −$1,500
- − Repairs & maintenance
- −$3,460
- − Management
- −$3,460
- − Depreciation
- −$8,724
- Taxable income
- $6,100
- Est. tax owed @ 24.0%
- −$1,464
- After-tax cash flow
- $9,125/yr
For passive investors: Depreciation is non-cash, so a rental often shows a tax loss while cash-flowing — sheltering income. Rental losses are passive: they offset passive income freely, and up to $25,000/yr can offset ordinary (W-2) income if you actively participate and your MAGI is under $100k (phasing out to $0 by $150k); unused losses carry forward. On sale, claimed depreciation is recaptured at up to 25%, and gains may owe capital-gains tax (a 1031 exchange can defer both). Figures are a year-1 estimate at your 24.0% rate — not tax advice; consult a CPA.
Schools (NCES district)
- District
- Winchester School District
- NCES district ID
- 0905160
- Math proficiency
- 53% ▲ 5.00%
- Reading proficiency
- 49% ▲ 2.00%
- Median HH income
- $58,334
- Composite
- 46.4/100
- National rank
- #5353
- State rank
- #131 of 192 in CT
Livability — Winsted
- Score
- 80/100
- State rank
- #25
- US rank
- #1955
Category grades
Schools grade is shown separately in the Schools card above.
Census & demographics
- Census place
- Winsted, CT
- County
- Litchfield County · 81,203 people
- City population
- 10,263
- Metro
- Torrington, CT
- Population (ZIP)
- 10,263
- Household income
- $66,269
- Rent vs Own
- Severe rent burden
- 576.0
Population outlook (Northwest Hills County) Hauer SSP2
- By 2040
- 118,998
Race, ethnicity, and origin ACS 2023
- Neighborhood character
- Predominantly White (87%)
- Race & ethnicity
- White 87% Hispanic / Latino 9% Two or more races 8% Black 2%
- Hispanic origin (detail)
- Mexican 2% Puerto Rican 1% Dominican 4%
- Common ancestry
- Romanian 6% Lithuanian 5% Slovak 3%
- Foreign-born
- 7% · Canada, Jamaica
- Languages at home
- 90% English-only · Spanish 5% Other Indo-European 2% French/Haitian/Cajun 1%
Political lean MEDSL · Northwest Hills
- 2024 margin
- Toss-up / Even · D 48.6% · R 49.9% · Other 1.6%
- All cycles
- 2024: R+1.3
Not yet ingested
- Civics
- —
Market trends
- HPI YoY
- ▼ -62.68%
- Current HPI
- 263.2141
- Rent YoY
- —
- Metro
- Torrington, CT
- State GDP YoY
- ▲ 1.06%
- F500 in state
- 38
Industry mix (Fortune 500 HQ in CT)
| Industry | F500 HQs | Revenue |
|---|---|---|
| Industrial Machinery | 4 | $38B |
|
||
| Insurance | 3 | $71B |
|
||
| Financial Services | 2 | $25B |
|
||
| Transportation / Logistics | 2 | $18B |
|
||
| Healthcare | 1 | $247B |
|
||
| Telecommunications | 1 | $55B |
|
||
Price history
+122.3% since first listed21 events — show timeline
- 2024-12-16 Pending — Smart MLS
- 2024-12-13 Contingent — Smart MLS
- 2024-11-11 Listed $299,900 Smart MLS
- 2013-04-10 Listing Removed — Smart MLS
- 2011-04-10 Listed $78,900 Smart MLS
- 2010-11-22 Listing Removed — Smart MLS
- 2009-11-22 Listed $153,999 Smart MLS
- 2009-09-16 Listing Removed — Smart MLS
- 2008-12-15 Listed $174,900 Smart MLS
- 2008-11-09 Listing Removed — Smart MLS
- 2008-05-10 Listed $189,900 Smart MLS
- 2008-04-22 Listing Removed — Smart MLS
- 2007-11-12 Listed $194,900 Smart MLS
- 2005-08-05 Sold (Public Records) $180,000 Public Records
- 2005-08-05 Sold (Public Records) $180,000 Public Records
- 2005-08-05 Sold (MLS) $180,000 Smart MLS
- 2005-08-05 Sold (MLS) $180,000 Smart MLS
- 2005-03-18 Listed $205,000 Smart MLS
- 2004-12-18 Listed $189,000 Smart MLS
- 2000-12-15 Sold (MLS) $139,700 Smart MLS
- 2000-05-03 Listed $134,900 Smart MLS
Property tax history
-0.5%/yrLatest (2022): $3,205 · +0.0% YoY. Source: county tax records.
Cash-flow waterfall
monthlySold comps — $/sqft
last 12 mo · ≤1 miLoading sold comps…