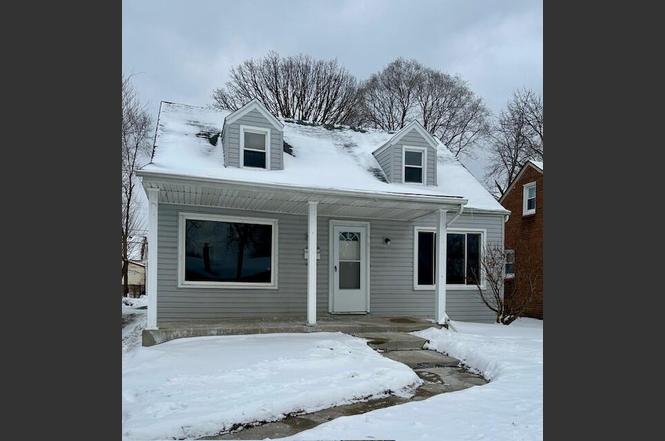
5718 Fenton St · Dearborn Heights, MI
Flood risk 1/10 · Minimal
- FEMA flood zone
- X (unshaded)
- Chance of flooding over 30 yrs
- 0.0%
- Est. flood insurance / yr
- $507 – $1,088
Fire risk 1/10 · Minimal
- Est. fire insurance / yr
- $784 – $1,456
Heat risk 3/10 · Minor
- Hot days now (above 98°F)
- 7 days/yr
- Hot days in 30 yrs
- 15 days/yr
Wind risk 2/10 · Minimal
- Chance of severe wind over 30 yrs
- —
Air-quality risk 2/10 · Minimal
- Unhealthy air days now
- 1 days/yr
- Unhealthy air days in 30 yrs
- 2 days/yr
Risk factors via First Street. Map © Google.
Why this score? — see what drove the B- grade
The composite is a weighted blend of 9 inputs, each scored 0–100. Each bar is that input's sub-score; the figure is the points it added to the 100-point composite (weight × sub-score).
- Cash flow +25.4/30.0
- ARV discount +15.0/15.0
- DSCR +8.4/10.0
- 1% rule +6.9/10.0
- Livability +4.0/5.0
- Schools +3.2/10.0
- Rent growth +2.6/5.0
- Condition / age +2.5/5.0
- Appreciation +0.0/10.0
$175,000
🖨 Deal sheet 📄 Offer letter ✓ Due diligence
Listing remarks MLS
WELCOME HOME!! SUPER CLEAN 4 BEDROOM WITH BONUS ROOM! LARGE LIVING ROOM, 1ST FLOOR LAUNDRY, FORMAL DINING ROOM, LARGE UPDATED KITCHEN WITH WALK IN PANTRY, 1ST FLOOR BEDROOM HAS OFFICE AREA, COULD BE LARGE MASTER BEDROOM, 2 1/2 CAR GARAGE, LARGE PATIO, DEEP YARD, LARGE COVERED FRONT PORCH! GREAT LOCATION, CLOSE TO FREEWAYS, SHOPPINGM FOOD ECT. SELLER PROVIDING C OF O, THIS GEM WONT LAST LONG! EMAIL ALL OFFERS TO STACEY@LIVEGPM. COM
Key facts
- Formal dining room
- Large patio
- 1st floor laundry
Tags
Neighborhood map
What this means for you Summary
Snapshot
- This is a 4-bed/1.0-bath single-family listed at $175k.
Deal economics
- At list price, monthly cash flow is $401 ($5k/yr) — positive.
- The deal already cash-flows at list — no discount required.
- Meets the 1% rule at list price ($2k rent vs $175k).
- Cap rate 9.0% vs local median 5.5% in Dearborn Heights — top-decile yield for the area; either an underpriced asset or a hidden risk that comps aren't pricing in. Stress-test before assuming the spread holds.
Location & tenants
- Location reads 79/100 on livability (#82 in MI, #1,885 nationally) — a middle-class / working-renter tenant base. Strengths: commute A+, cost of living A+, housing A+; Watch: schools C-, crime D+, employment D+.
- Crestwood School District (suburban): math 32% / reading 43% proficiency, ranked #242 of 540 in MI (top 45%) — families likely to look elsewhere, expect single-tenant / working-renter base with shorter leases.
- Market conditions: Rents flat; 143 active listings in the ZIP; 10 comparable units currently listed for rent nearby; rentals at typical pace (median 18d on market — plan ~3-4 weeks tenant-placement turnaround); 2,639 units permitted in Wayne County in 2024 (1,216 in 5+ unit buildings).
- This rent runs 41% of the median local income ($61k/yr) — at the standard rent-burdened threshold; future hikes will face affordability resistance.
Forward outlook
- Local home prices are declining (-3.0%/yr); year-one equity from $1k of loan paydown is wiped out by about $5k of value loss. Plan a longer hold.
- Wayne County population projected at -17% by 2050 — secular population decline; favor cash flow + early exit over multi-decade hold.
Negotiation context
- Only 5 days on market — expect competitive offers; lowballing is unlikely to land.
- 8 sale attempts since 12y ago with the ask held roughly flat each time — persistent listings suggest the price (not the market) is what's stuck; bring a comps-based counter.
- Current owner paid $1k; list at $175k implies a 15809% gain — meaningful room to come down on a strong offer.
Risks & watch-outs
- Watch-outs: built in 1937 — expect roof / HVAC / electrical / plumbing capex.
Questions for the listing agent
- Built in 1937 — when were the roof, HVAC, electrical panel, plumbing, and water heater last replaced?
- Is there a deadline driving the sale (1031 exchange, divorce, estate, relocation)? That informs how much negotiation room exists.
- Crime grade is D in this area — have there been break-ins, vandalism, or insurance claims at this property in the last 3 years? What carrier currently insures it and at what premium?
- What's the average days-on-market for RENTAL listings here right now (not sales)? A rising rental-DOM trend means longer vacancies and softer asking-rent achievability than the comps imply.
- What's the recent tenant-quality profile in this submarket — average credit score on applications, eviction rate, late-payment / NSF rate, and stable-employment percentage? A property-management company in the area should have these aggregated.
- How much new for-sale + rental construction is in the pipeline within 1–3 miles? Heavy new supply typically softens prices + rents 12–24 months out; constrained supply supports both.
Investment metrics
- 1% rule
- 1.19% ✓
- Cap rate
- 9.04%
- Cash-on-cash
- 9.81%
- DSCR
- 1.44
- GRM
- 7.0
CMA / ARV
- ARV (on-the-fly)
- $227,136
- Comps found
- 12
Show comp detail 12 sales within ~0.75 mi
| Address | Dist | Beds/Ba | Sqft | Sold | Price | $/sf | Match |
|---|---|---|---|---|---|---|---|
| 6015 Mayburn St W | 0.21mi | 4/1.0 | 1,256 (-6%) | 5mo | $149,000 | $119 | 75 |
| 6180 Colonial St | 0.34mi | 3/1.0 (-1) | 1,367 (+2%) | 5mo | $240,000 | $176 | 72 |
| 2213 N Waverly St | 0.34mi | 3/1.0 (-1) | 1,328 (-1%) | 8mo | $250,000 | $188 | 71 |
| 6043 N Vernon St | 0.17mi | 3/1.0 (-1) | 1,250 (-7%) | 9mo | $175,000 | $140 | 68 |
| 1340 N Franklin St | 0.56mi | 3/2.0 (-1) | 1,348 (+0%) | 6mo | $325,000 | $241 | 59 |
| 6039 N Silvery Ln | 0.34mi | 3/1.0 (-1) | 1,500 (+12%) | 4mo | $200,000 | $133 | 56 |
| 2211 Drexel St | 0.20mi | 3/2.0 (-1) | 1,180 (-12%) | 8mo | $251,000 | $213 | 55 |
| 1808 N Melborn St | 0.64mi | 3/1.0 (-1) | 1,264 (-6%) | 6mo | $275,000 | $218 | 50 |
| 23621 Lawrence Ave | 0.61mi | 3/2.0 (-1) | 1,446 (+8%) | 2mo | $245,000 | $169 | 48 |
| 1846 N Gulley Rd | 0.57mi | 3/2.0 (-1) | 1,458 (+8%) | 3mo | $200,000 | $137 | 48 |
| 6607 Drexel St | 0.58mi | 4/2.0 | 1,509 (+12%) | 8mo | $247,000 | $164 | 42 |
| 6881 N Vernon St | 0.70mi | 3/1.5 (-1) | 1,518 (+13%) | 3mo | $217,000 | $143 | 36 |
Match score weights: distance 35% · size 25% · config 20% · recency 20%. Top-matched comps best support the ARV.
Projected returns pro-forma
-3.0% appreciation · 0.41% rent growth · sell at horizon
- IRR
- -4.5%
- Equity multiple
- 0.84×
- Total profit
- $-8,069
- Equity at exit
- $26,093
- IRR
- 1.8%
- Equity multiple
- 1.11×
- Total profit
- $5,474
- Equity at exit
- $15,131
Cash invested: $49,000 (down + closing). Projections, not guarantees.
Landlord ↔ Tenant lean methodology
- Overall (STATE)
- 62 Landlord-Friendly
- State Michigan
- 62 Landlord-Friendly · EVEN
- County
- — inherits STATE
- City
- — inherits STATE
ZIP-level market 48127
- Rents YoY
- 0.4%
- Active inventory
- 143
- Price-to-rent
- 7.0×
Monthly cashflow live
- Estimated rent
- $2,077 high interval (Pro) →
- Mortgage (P&I)
- −$918
- Tax from tax record
- −$250 /mo · $2,999/yr
- Insurance
- −$73
- HOA
- −$0
- Vacancy / Maint / Mgmt
- −$436
- Net cashflow
- $401
Break-even live
UW: 25.0% down · 7.5% · 30yr · 1.5% tax · 5.0% vac · 8.0% maint · 8.0% mgmt
Financing live
Cash to close
- Down payment
- $43,750
- Closing costs
- $5,250
- Reserves months
- —
- Total cash needed
- —
Loan-product check · same deal, 3 products live
Conventional
25% down · 7.5% · 30yr
- Down + closing
- —
- Monthly P&I
- —
- Monthly cashflow
- —
- DSCR
- —
- Eligible?
- —
Personal DTI + credit; lowest rate.
DSCR
20% down · 8.5% · 30yr
- Down + closing
- —
- Monthly P&I
- —
- Monthly cashflow
- —
- DSCR
- —
- Eligible?
- —
No personal income docs; deal must DSCR.
Hard money
10% down · 12.0% · 12mo
- Down + closing
- —
- Monthly P&I
- —
- Monthly cashflow
- —
- DSCR
- —
- Eligible?
- —
Short-term bridge; refi at stabilization.
Rent comps 10 comps
| Address | Beds | Baths | Sqft | Rent | $/sqft | DOM | Units | Dist |
|---|---|---|---|---|---|---|---|---|
| 6978 Mayburn St Dearborn Heights, MI | 3.0 | 2.0 | 1250 | $1,800 | $1.44 | 43d | 1 | 0.80mi |
| 5722 Centralia St Dearborn Heights, MI | 3.0 | 1.0 | 999 | $1,750 | $1.75 | 1d | 1 | 0.82mi |
| 7080 Highview St Dearborn Heights, MI | 3.0 | 2.5 | 1105 | $2,000 | $1.81 | 17d | 1 | 0.89mi |
| 7014 Kinmore St Dearborn Heights, MI | 3.0 | 1.0 | 960 | $1,900 | $1.98 | 21d | 1 | 0.94mi |
| 7462 N Vernon St Dearborn Heights, MI | 4.0 | 1.0 | 1113 | $1,900 | $1.71 | 1d | 1 | 1.06mi |
| 521 N Martha St Dearborn, MI | 5.0 | 2.0 | 1800 | $3,150 | $1.75 | 43d | 1 | 1.20mi |
| 1830 Belmont St Dearborn, MI | 3.0 | 1.5 | 1762 | $2,500 | $1.42 | 44d | 1 | 1.23mi |
| 26620 Baldwin St Dearborn Heights, MI | 3.0 | 1.5 | 1156 | $1,800 | $1.56 | 1d | 1 | 1.34mi |
| 7618 Hazelton St Dearborn Heights, MI | 3.0 | 1.0 | 1310 | $1,700 | $1.30 | 17d | 1 | 1.37mi |
| 6810 Rosemary St Dearborn Heights, MI | 3.0 | 1.5 | 1700 | $2,000 | $1.18 | 1d | 1 | 1.47mi |
Listing history 19 events
-
2026-02-02status Pending 434-char remark
Show marketing remark (434 chars)
WELCOME HOME!! SUPER CLEAN 4 BEDROOM WITH BONUS ROOM! LARGE LIVING ROOM, 1ST FLOOR LAUNDRY, FORMAL DINING ROOM, LARGE UPDATED KITCHEN WITH WALK IN PANTRY, 1ST FLOOR BEDROOM HAS OFFICE AREA, COULD BE LARGE MASTER BEDROOM, 2 1/2 CAR GARAGE, LARGE PATIO, DEEP YARD, LARGE COVERED FRONT PORCH! GREAT LOCATION, CLOSE TO FREEWAYS, SHOPPINGM FOOD ECT. SELLER PROVIDING C OF O, THIS GEM WONT LAST LONG! EMAIL ALL OFFERS TO STACEY@LIVEGPM. COM
-
2026-02-02status Pending
Show marketing remark (434 chars)
WELCOME HOME!! SUPER CLEAN 4 BEDROOM WITH BONUS ROOM! LARGE LIVING ROOM, 1ST FLOOR LAUNDRY, FORMAL DINING ROOM, LARGE UPDATED KITCHEN WITH WALK IN PANTRY, 1ST FLOOR BEDROOM HAS OFFICE AREA, COULD BE LARGE MASTER BEDROOM, 2 1/2 CAR GARAGE, LARGE PATIO, DEEP YARD, LARGE COVERED FRONT PORCH! GREAT LOCATION, CLOSE TO FREEWAYS, SHOPPINGM FOOD ECT. SELLER PROVIDING C OF O, THIS GEM WONT LAST LONG! EMAIL ALL OFFERS TO STACEY@LIVEGPM. COM
-
2026-01-28$175,000 Active 434-char remark
Show marketing remark (434 chars)
WELCOME HOME!! SUPER CLEAN 4 BEDROOM WITH BONUS ROOM! LARGE LIVING ROOM, 1ST FLOOR LAUNDRY, FORMAL DINING ROOM, LARGE UPDATED KITCHEN WITH WALK IN PANTRY, 1ST FLOOR BEDROOM HAS OFFICE AREA, COULD BE LARGE MASTER BEDROOM, 2 1/2 CAR GARAGE, LARGE PATIO, DEEP YARD, LARGE COVERED FRONT PORCH! GREAT LOCATION, CLOSE TO FREEWAYS, SHOPPINGM FOOD ECT. SELLER PROVIDING C OF O, THIS GEM WONT LAST LONG! EMAIL ALL OFFERS TO STACEY@LIVEGPM. COM
-
2026-01-28$175,000 Active
Show marketing remark (434 chars)
WELCOME HOME!! SUPER CLEAN 4 BEDROOM WITH BONUS ROOM! LARGE LIVING ROOM, 1ST FLOOR LAUNDRY, FORMAL DINING ROOM, LARGE UPDATED KITCHEN WITH WALK IN PANTRY, 1ST FLOOR BEDROOM HAS OFFICE AREA, COULD BE LARGE MASTER BEDROOM, 2 1/2 CAR GARAGE, LARGE PATIO, DEEP YARD, LARGE COVERED FRONT PORCH! GREAT LOCATION, CLOSE TO FREEWAYS, SHOPPINGM FOOD ECT. SELLER PROVIDING C OF O, THIS GEM WONT LAST LONG! EMAIL ALL OFFERS TO STACEY@LIVEGPM. COM
-
2015-07-15soldstatus $1,100
-
2015-05-14historical
-
2015-04-08$1,100
-
2015-02-13soldstatus $60,000 Sold
-
2015-02-06soldstatus $60,000
-
2015-02-06soldstatus $60,000
-
2015-02-03historical
-
2015-01-26historical
-
2014-12-26status Active
-
2014-12-26historical
-
2014-12-05$69,700
-
2014-12-05$69,700
-
2014-12-02$69,700 Active
ⓘ Source: listings_history table (triggers on properties + properties_extension) + one-shot
backfill from property_details.listing_events for pre-trigger history.
Tax reassessment forecast MI · Partial reset (capped growth)
- Current annual tax
- $2,999 · $250/mo
- Projected year-2 tax
- $2,999 · $250/mo
- Expected delta
- $0/yr ($0/mo · 0.0%)
ⓘ Screening estimate from a state-policy table — verify with the county assessor before closing.
Climate risk First Street
- Flood 1/10 Low FEMA zone X (unshaded) · 0% chance over 30 yrs
- Wildfire 1/10 Low
- Heat 3/10 Moderate 7 d/yr ≥98°F today · 15 d/yr by 30 yrs out
- Wind 2/10 Low
- Air quality 2/10 Low 1 unhealthy d/yr today · 2 by 30 yrs out
Nearby sold comps map
Loading sold comps map…
Walkable amenities ~0.75 mi
Loading nearby amenities…
Taxation est. · year 1
- Rental income
- $24,929
- − Mortgage interest
- −$9,803
- − Property taxes
- −$2,999
- − Insurance
- −$875
- − Repairs & maintenance
- −$1,994
- − Management
- −$1,994
- − Depreciation
- −$5,091
- Taxable income
- $2,173
- Est. tax owed @ 24.0%
- −$521
- After-tax cash flow
- $4,286/yr
For passive investors: Depreciation is non-cash, so a rental often shows a tax loss while cash-flowing — sheltering income. Rental losses are passive: they offset passive income freely, and up to $25,000/yr can offset ordinary (W-2) income if you actively participate and your MAGI is under $100k (phasing out to $0 by $150k); unused losses carry forward. On sale, claimed depreciation is recaptured at up to 25%, and gains may owe capital-gains tax (a 1031 exchange can defer both). Figures are a year-1 estimate at your 24.0% rate — not tax advice; consult a CPA.
Schools (NCES district)
- District
- Crestwood School District
- NCES district ID
- 2600016
- Math proficiency
- 32% ▼ -6.00%
- Reading proficiency
- 43% ▼ -4.00%
- Median HH income
- $47,101
- Composite
- 32.1/100
- National rank
- #5806
- State rank
- #242 of 540 in MI
Livability — Dearborn Heights
- Score
- 79/100
- State rank
- #82
- US rank
- #1885
Category grades
Schools grade is shown separately in the Schools card above.
Census & demographics
- Census place
- Dearborn Heights, MI
- County
- Wayne County · 1,562,939 people
- City population
- 61,771
- Metro
- Detroit-Warren-Dearborn, MI
- Population (ZIP)
- 39,646
- Household income
- $60,742
- Rent vs Own
- Severe rent burden
- 1196.0
Population outlook (Wayne County) Hauer SSP2
- Today (2025)
- 1,675,273 people
- By 2030
- 1,620,300 · -3.3%
- By 2040
- 1,502,341 · -10.3%
- By 2050
- 1,384,039 · -17.4%
- By 2075
- 1,124,592 · -32.9%
- By 2100
- 881,193 · -47.4%
Race, ethnicity, and origin ACS 2023
- Neighborhood character
- Predominantly White (85%)
- Race & ethnicity
- White 85% Black 8% Two or more races 3% Hispanic / Latino 3% Asian 2%
- Common ancestry
- Arab 8% Romanian 7% Lithuanian 2%
- Foreign-born
- 31% · Canada
- Languages at home
- 46% English-only · Arabic 45% Russian/Polish/Slavic 2% Other Indo-European 2%
Political lean MEDSL · Wayne
- 2024 margin
- Strong D (+29.0) · D 62.7% · R 33.7% · Other 3.6%
- 2008→2024 swing
- -20.5pp toward R · 2008: 49.5pp · 2024: 29.0pp
- All cycles
- 2024: D+29.0 2020: D+38.1 2016: D+37.3 2012: D+46.9 2008: D+49.5
Not yet ingested
- Civics
- —
Market trends
- HPI YoY
- ▼ -319.04%
- Current HPI
- 225.9407
- Rent YoY
- ▲ 0.41%
- Metro
- Detroit-Warren-Dearborn, MI
- State GDP YoY
- ▲ 1.37%
- F500 in state
- 28
Industry mix (Fortune 500 HQ in MI)
| Industry | F500 HQs | Revenue |
|---|---|---|
| Automotive Parts | 3 | $48B |
|
||
| Automotive | 2 | $372B |
|
||
| Chemicals | 1 | $45B |
|
||
| Automotive Retail | 1 | $29B |
|
||
| Healthcare / Medical Devices | 1 | $23B |
|
||
| Automotive Technology | 1 | $20B |
|
||
Price history
+151.1% since first listed19 events — show timeline
- 2026-02-02 Pending — REALCOMP
- 2026-02-02 Pending — MiRealSource-MiMLS
- 2026-02-02 Pending — SW Michigan MLS
- 2026-01-28 Listed $175,000 SW Michigan MLS
- 2026-01-28 Listed $175,000 MiRealSource-MiMLS
- 2026-01-28 Listed $175,000 REALCOMP
- 2015-07-15 Sold (MLS) $1,100 MiRealSource-MiMLS
- 2015-05-14 Listing Removed — MiRealSource-MiMLS
- 2015-04-08 Listed $1,100 MiRealSource-MiMLS
- 2015-02-13 Sold (MLS) $60,000 REALCOMP
- 2015-02-06 Sold (MLS) $60,000 MiRealSource-MiMLS
- 2015-02-06 Sold (MLS) $60,000 REALCOMP
- 2015-02-03 Listing Removed — MiRealSource-MiMLS
- 2015-01-26 Listing Removed — REALCOMP
- 2014-12-26 Relisted — REALCOMP
- 2014-12-26 Listing Removed — REALCOMP
- 2014-12-05 Listed $69,700 MiRealSource-MiMLS
- 2014-12-05 Listed $69,700 REALCOMP
- 2014-12-02 Listed $69,700 REALCOMP
Property tax history
+5.7%/yrLatest (2025): $2,999 · -27.6% YoY. Source: county tax records.
Cash-flow waterfall
monthlySold comps — $/sqft
last 12 mo · ≤1 miLoading sold comps…