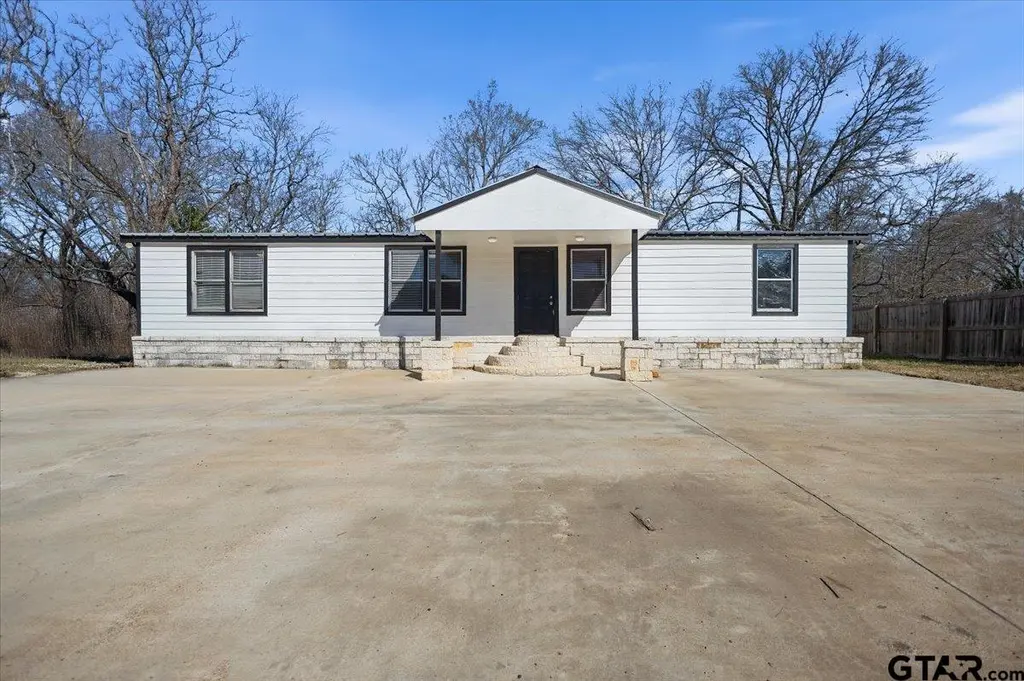
5950 C R 486 · Tyler, TX
Flood risk 1/10 · Minimal
- FEMA flood zone
- X (unshaded)
- Chance of flooding over 30 yrs
- 0.0%
- Est. flood insurance / yr
- $507 – $1,088
Fire risk 5/10 · Moderate
- Est. fire insurance / yr
- $1,222 – $2,270
Heat risk 7/10 · Major
- Hot days now (above 109°F)
- 7 days/yr
- Hot days in 30 yrs
- 26 days/yr
Wind risk 6/10 · Moderate
- Chance of severe wind over 30 yrs
- 65.0%
Air-quality risk 2/10 · Minimal
- Unhealthy air days now
- 0 days/yr
- Unhealthy air days in 30 yrs
- 1 days/yr
Risk factors via First Street. Map © Google.
Why this score? — see what drove the B+ grade
The composite is a weighted blend of 9 inputs, each scored 0–100. Each bar is that input's sub-score; the figure is the points it added to the 100-point composite (weight × sub-score).
- Cash flow +30.0/30.0
- DSCR +10.0/10.0
- 1% rule +9.9/10.0
- Appreciation +8.4/10.0
- ARV discount +7.5/15.0
- Livability +3.8/5.0
- Schools +3.3/10.0
- Rent growth +2.5/5.0
- Condition / age +2.2/5.0
$99,900
🖨 Deal sheet (PDF) 📄 Offer letter ✓ Due diligence
Listing remarks MLS
5950 CR 486 | Tyler, TX 75706 – North Tyler 3 Bedrooms | 2 Bathrooms Cash only – $99,900 Great investment opportunity located in North Tyler! This 3-bedroom, 2-bath property is currently tenant-occupied, offering immediate income potential — step into a cash-flowing asset from day one or make it your future homestead. Sitting on approximately half an acre, the property provides additional space for future improvements or expansion. Ideal for investors looking to expand their portfolio or buyers ready to secure a property with long-term potential. Due to property characteristics, financing may be limited. Don’t miss this opportunity!
Key facts
- Built 1999
- Listed 124 days
Neighborhood map
What this means for you Summary
Snapshot
- This is a 3-bed/2.0-bath single-family listed at $100k. Condition is rated fair.
Deal economics
- At list price, monthly cash flow is $484 ($6k/yr) — positive.
- The deal already cash-flows at list — no discount required.
- Meets the 1% rule at list price ($1k rent vs $100k).
- Recommended offer: $88k (12.0% below list) — sets the bar for market timing.
- Cap rate 12.1% vs local median 3.6% in Tyler — top-decile yield for the area; either an underpriced asset or a hidden risk that comps aren't pricing in. Stress-test before assuming the spread holds.
Location & tenants
- Location reads 75/100 on livability (#147 in TX, #4,181 nationally) — a middle-class / working-renter tenant base. Strengths: cost of living A+, housing A+, health & safety A+; Watch: employment C-, schools D+, crime D+.
- Tyler ISD (urban): math 39% / reading 38% proficiency, ranked #449 of 826 in TX (top 54%) — families likely to look elsewhere, expect single-tenant / working-renter base with shorter leases; 66% free/reduced lunch — lower-income household profile, screen leases tightly.
- Market conditions: 109 active listings in the ZIP; 2 comparable units currently listed for rent nearby; 595 units permitted in Smith County in 2024 (45 in 5+ unit buildings).
Forward outlook
- In year one you build about $7k of equity ($691 loan paydown + $7k appreciation (6.7% local appreciation)).
- Smith County population projected at +24% by 2050 — long-run rental-demand tailwind backs the buy-and-hold thesis.
- At projected returns (6.7% appreciation + 3.0% rent growth), your $28k cash investment doubles in ~3 years — after that, you're playing with house money.
- By year 5, paydown + projected appreciation supports a ~$33k cash-out refi (75% LTV) — recoverable capital for the next deal without selling this one.
Negotiation context
- It's been on market 125 days — a 12% lower offer ($88k) is reasonable based on typical stale-listing flexibility.
Risks & watch-outs
- Climate carrying-cost: major wind risk, 65% chance of damaging wind over 30y; moderate wildfire risk; extreme-heat days projected 7→26/yr by 2055 (HVAC capex compounding) — expect insurance premiums to compound above CPI over the hold.
Questions for the listing agent
- It's been on market 125 days. Have you received any prior offers? Is the seller open to a 12% concession, seller financing, or rate buy-down credit?
- Have any recent inspections been done? Can we get a copy of the seller's disclosures and any deferred-maintenance estimates?
- Why hasn't it sold? Are there any deal-killer items the seller is aware of (foundation, flood, title, zoning, code violations)?
- Is there a deadline driving the sale (1031 exchange, divorce, estate, relocation)? That informs how much negotiation room exists.
- Schools are D-rated, which usually means shorter tenancies and higher turnover. Who's the typical renter profile here, and what's been the actual vacancy rate?
- Crime grade is D in this area — have there been break-ins, vandalism, or insurance claims at this property in the last 3 years? What carrier currently insures it and at what premium?
- What's the average days-on-market for RENTAL listings here right now (not sales)? A rising rental-DOM trend means longer vacancies and softer asking-rent achievability than the comps imply.
- What's the recent tenant-quality profile in this submarket — average credit score on applications, eviction rate, late-payment / NSF rate, and stable-employment percentage? A property-management company in the area should have these aggregated.
- How much new for-sale + rental construction is in the pipeline within 1–3 miles? Heavy new supply typically softens prices + rents 12–24 months out; constrained supply supports both.
Investment metrics
- 1% rule
- 1.49% ✓
- Cap rate
- 12.11%
- Cash-on-cash
- 20.77%
- DSCR
- 1.92
- GRM
- 5.6
CMA / ARV
No comps found within radius.
Projected returns pro-forma
6.72% appreciation · 3.0% rent growth · sell at horizon
- IRR
- 34.1%
- Equity multiple
- 3.29×
- Total profit
- $64,009
- Equity at exit
- $67,384
- IRR
- 31.2%
- Equity multiple
- 6.84×
- Total profit
- $163,233
- Equity at exit
- $126,362
Cash invested: $27,972 (down + closing). Projections, not guarantees.
Landlord ↔ Tenant lean methodology
- Overall (STATE)
- 87 Strongly Landlord-Friendly
- State Texas
- 87 Strongly Landlord-Friendly · R+5
- County
- — inherits STATE
- City
- — inherits STATE
ZIP-level market 75706
- Home prices YoY
- 2.9%
- Active inventory
- 109
- Price-to-rent
- 5.6×
Monthly cashflow live
- Estimated rent
- $1,487 medium interval (Pro) →
- Mortgage (P&I)
- −$524
- Tax est. 1.5%
- −$125 /mo · $1,498/yr
- Insurance
- −$42
- HOA
- −$0
- Vacancy / Maint / Mgmt
- −$312
- Net cashflow
- $484
Break-even live
Sensitivity live
| Price | -10% $553 | -5% $519 | +0% $484 | +5% $450 | +10% $415 |
|---|---|---|---|---|---|
| Rent | -10% $367 | -5% $425 | +0% $484 | +5% $543 | +10% $602 |
| Rate | -1.0pp $534 | -0.5pp $510 | base $484 | +0.5pp $458 | +1.0pp $432 |
UW: 25.0% down · 7.5% · 30yr · 1.5% tax · 5.0% vac · 8.0% maint · 8.0% mgmt
Financing live
Cash to close
- Down payment
- $24,975
- Closing costs
- $2,997
- Reserves months
- —
- Total cash needed
- —
Loan-product check · same deal, 3 products live
Conventional
25% down · 7.5% · 30yr
- Down + closing
- —
- Monthly P&I
- —
- Monthly cashflow
- —
- DSCR
- —
- Eligible?
- —
Personal DTI + credit; lowest rate.
DSCR
20% down · 8.5% · 30yr
- Down + closing
- —
- Monthly P&I
- —
- Monthly cashflow
- —
- DSCR
- —
- Eligible?
- —
No personal income docs; deal must DSCR.
Hard money
10% down · 12.0% · 12mo
- Down + closing
- —
- Monthly P&I
- —
- Monthly cashflow
- —
- DSCR
- —
- Eligible?
- —
Short-term bridge; refi at stabilization.
Rent comps 2 comps
| Address | Beds | Baths | Sqft | Rent | $/sqft | DOM | Units | Dist |
|---|---|---|---|---|---|---|---|---|
| 3115 N Grand Ave Tyler, TX | 3.0 | 2.0 | 1309 | $1,575 | $1.20 | 44d | 1 | 1.16mi |
| 2202 W Nw LOOP Tyler, TX | 2.0–3.0 | 2.0 | 1115 | $1,371 | $1.23 | 22d | 1 | 1.29mi |
Listing history 17 events
-
2026-06-19days on market $99,900 Active 125 DOM
-
2026-06-18days on market $99,900 Active 124 DOM
-
2026-06-17days on market $99,900 Active 123 DOM
-
2026-06-16days on market $99,900 Active 122 DOM
-
2026-06-15days on market $99,900 Active 121 DOM
-
2026-06-14days on market $99,900 Active 119 DOM
-
2026-06-13days on market $99,900 Active 118 DOM
-
2026-06-10days on market $99,900 Active 116 DOM
-
2026-06-09days on market $99,900 Active 115 DOM
-
2026-06-08days on market $99,900 Active 114 DOM
-
2026-06-07days on market $99,900 Active 113 DOM
-
2026-06-05days on market $99,900 Active 110 DOM
-
2026-06-02days on market $99,900 Active 108 DOM
-
2026-06-01days on market $99,900 Active 107 DOM
-
2026-05-31days on market $99,900 Active 106 DOM
-
2026-05-30days on market $99,900 Active 105 DOM
-
2026-02-14$99,900 Active 666-char remark
Show marketing remark (666 chars)
5950 CR 486 | Tyler, TX 75706 – North Tyler 3 Bedrooms | 2 Bathrooms Cash only – $99,900 Great investment opportunity located in North Tyler! This 3-bedroom, 2-bath property is currently tenant-occupied, offering immediate income potential — step into a cash-flowing asset from day one or make it your future homestead. Sitting on approximately half an acre, the property provides additional space for future improvements or expansion. Ideal for investors looking to expand their portfolio or buyers ready to secure a property with long-term potential. Due to property characteristics, financing may be limited. Don’t miss this opportunity!
ⓘ Source: listings_history table (triggers on properties + properties_extension) + one-shot
backfill from property_details.listing_events for pre-trigger history.
Climate risk First Street
- Flood 1/10 Low FEMA zone X (unshaded) · 0% chance over 30 yrs
- Wildfire 5/10 Major
- Heat 7/10 Severe 7 d/yr ≥109°F today · 26 d/yr by 30 yrs out
- Wind 6/10 Major 65% chance of damaging wind over 30 yrs
- Air quality 2/10 Low 0 unhealthy d/yr today · 1 by 30 yrs out
Nearby sold comps map
Loading sold comps map…
Walkable amenities ~0.75 mi
Loading nearby amenities…
Taxation est. · year 1
- Rental income
- $17,841
- − Mortgage interest
- −$5,596
- − Property taxes
- −$1,498
- − Insurance
- −$500
- − Repairs & maintenance
- −$1,427
- − Management
- −$1,427
- − Depreciation
- −$2,906
- Taxable income
- $4,486
- Est. tax owed @ 24.0%
- −$1,077
- After-tax cash flow
- $4,733/yr
For passive investors: Depreciation is non-cash, so a rental often shows a tax loss while cash-flowing — sheltering income. Rental losses are passive: they offset passive income freely, and up to $25,000/yr can offset ordinary (W-2) income if you actively participate and your MAGI is under $100k (phasing out to $0 by $150k); unused losses carry forward. On sale, claimed depreciation is recaptured at up to 25%, and gains may owe capital-gains tax (a 1031 exchange can defer both). Figures are a year-1 estimate at your 24.0% rate — not tax advice; consult a CPA.
Condition & rehab AI · 12 photos
This home requires moderate repairs and maintenance, with potential for significant value increase through updates to paint, flooring, and appliances.
Repairs flagged
- Minor Paint — Paint appears slightly faded
- Minor Window screens — Screens are missing
Value-add opportunities
- Both Paint exterior and interior — Fresh paint enhances curb appeal and interior aesthetics
- Both Replace window screens — Screens improve comfort and energy efficiency
- Both Replace flooring — New flooring can significantly improve the home's appearance and value
- Both Update kitchen appliances — Modern appliances can attract more buyers and renters
- Both Update bathrooms — Fresh bathrooms can make the home more appealing and functional
Renovation cost estimate screening
| Repair item | Severity | Est. cost |
|---|---|---|
| Paint · Paint appears slightly faded | Minor | $500–3,000 |
| Window screens · Screens are missing | Minor | $500–3,000 |
| Total estimated repair cost · 2 items | $1,000–6,000 |
Value-add ROI direction
- Both Paint exterior and interior — Fresh paint enhances curb appeal and interior aesthetics ↑
- Both Replace window screens — Screens improve comfort and energy efficiency ↑
- Both Replace flooring — New flooring can significantly improve the home's appearance and value ↑
- Both Update kitchen appliances — Modern appliances can attract more buyers and renters ↑
- Both Update bathrooms — Fresh bathrooms can make the home more appealing and functional ↑
ⓘ Cost ranges are severity-bucket heuristics (US national rule-of-thumb). Get contractor quotes + a written scope before underwriting a rehab budget.
Schools (NCES district)
- District
- Tyler ISD
- NCES district ID
- 4843470
- Math proficiency
- 39% ▼ -4.00%
- Reading proficiency
- 38% ▼ -1.00%
- Median HH income
- $44,090
- Composite
- 32.69/100
- National rank
- #5650
- State rank
- #449 of 826 in TX
Livability — Tyler
- Score
- 75/100
- State rank
- #147
- US rank
- #4181
Category grades
Schools grade is shown separately in the Schools card above.
Census & demographics
- City population
- 127,842
- Population (ZIP)
- 10,975
Population outlook (Smith County) Hauer SSP2
- Today (2025)
- 248,890 people
- By 2030
- 261,665 · +5.1%
- By 2040
- 286,114 · +15.0%
- By 2050
- 308,006 · +23.8%
- By 2075
- 354,171 · +42.3%
- By 2100
- 372,828 · +49.8%
Race, ethnicity, and origin ACS 2023
- Neighborhood character
- Diverse neighborhood (Simpson 0.63)
- Race & ethnicity
- White 43% Hispanic / Latino 40% Black 14% Two or more races 13%
- Hispanic origin (detail)
- Mexican 38%
- Common ancestry
- Slovak 3% Lithuanian 2% Serbian 1%
- Foreign-born
- 13% · Canada
- Languages at home
- 68% English-only · Spanish 31% Tagalog/Filipino 1%
Political lean MEDSL · Smith
- 2024 margin
- Solid R (+45.1) · D 27.0% · R 72.1%
- 2008→2024 swing
- -5.6pp toward R · 2008: -39.5pp · 2024: -45.1pp
- All cycles
- 2024: R+45.1 2020: R+39.4 2016: R+43.9 2012: R+46.9 2008: R+39.5
Not yet ingested
- Civics
- —
Market trends
- HPI YoY
- ▲ 6.72%
- Current HPI
- 234.9412
- Rent YoY
- —
- Metro
- —
- State GDP YoY
- ▲ 3.95%
- F500 in state
- 110
Industry mix (Fortune 500 HQ in TX)
| Industry | F500 HQs | Revenue |
|---|---|---|
| Energy | 16 | $1,198B |
|
||
| Technology | 5 | $198B |
|
||
| Engineering / Construction | 4 | $72B |
|
||
| Energy Services | 3 | $60B |
|
||
| Utilities | 3 | $41B |
|
||
| Healthcare | 2 | $330B |
|
||
Price history
1 event — show timeline
- 2026-02-14 Listed $99,900 GTAR
Cash-flow waterfall
monthlySold comps — $/sqft
last 12 mo · ≤1 miLoading sold comps…