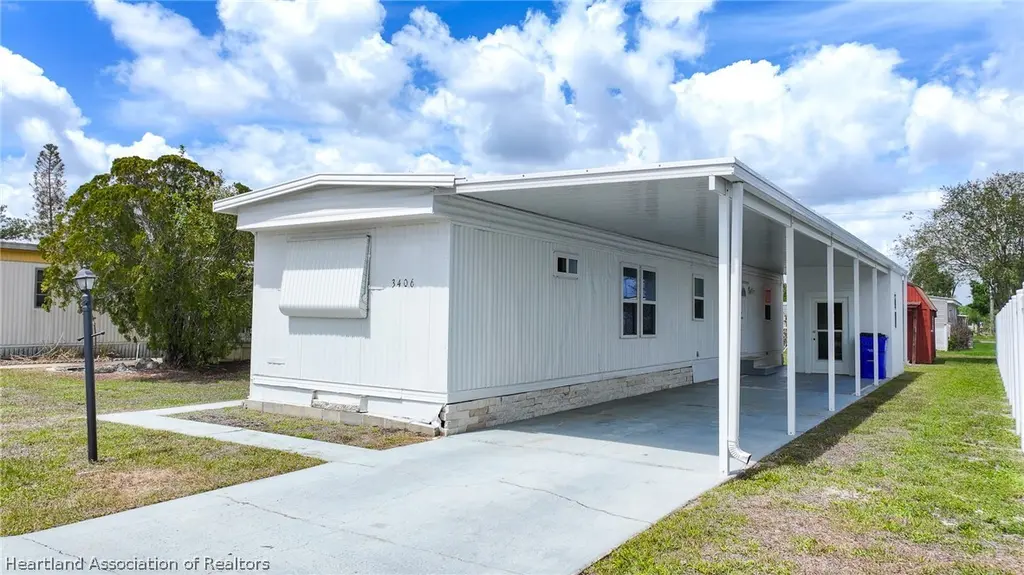
3406 Fairmount Dr · Sebring, FL
Flood risk 1/10 · Minimal
- FEMA flood zone
- X (unshaded)
- Chance of flooding over 30 yrs
- 0.0%
- Est. flood insurance / yr
- $507 – $1,088
Fire risk 4/10 · Minor
- Est. fire insurance / yr
- $947 – $1,759
Heat risk 8/10 · Major
- Hot days now (above 108°F)
- 7 days/yr
- Hot days in 30 yrs
- 25 days/yr
Wind risk 9/10 · Severe
- Chance of severe wind over 30 yrs
- 99.0%
Air-quality risk 2/10 · Minimal
- Unhealthy air days now
- 2 days/yr
- Unhealthy air days in 30 yrs
- 2 days/yr
Risk factors via First Street. Map © Google.
Why this score? — see what drove the D+ grade
The composite is a weighted blend of 9 inputs, each scored 0–100. Each bar is that input's sub-score; the figure is the points it added to the 100-point composite (weight × sub-score).
- Cash flow +24.0/30.0
- DSCR +7.7/10.0
- 1% rule +5.5/10.0
- Schools +3.6/10.0
- Livability +3.3/5.0
- Condition / age +2.5/5.0
- Rent growth +2.4/5.0
- ARV discount +0.0/15.0
- Appreciation +0.0/10.0
$115,000
🖨 Deal sheet (PDF) 📄 Offer letter ✓ Due diligence
Listing remarks MLS
Want to Own your Mobile Home and Land?! HERE IT IS! Conveniently located in a Mobile Home Park with NO Association Fee. Storage Shed in the Back. This Home is a Fixer Upper and is Priced Accordingly. Caution: there are a few softs spots (flooring) near the bedroom.
Key facts
- Completely renovated
- New subflooring
- Double-pane windows
Tags
Property features AI
Finance
- Other: Zoning: M1
- Financial info: Tax information not included per instructions
- HOA & community: Not specified
Exterior
- Parking: Carport (1 space)
- Security: Not specified
- Utilities: Public water; Public sewer available; Sewer available
- Home design: Mobile home; One story
- Construction: Metal siding; Metal roof
- Exterior features: Side porch; Paved road frontage (50 ft)
Interior
- Kitchen: Appliances not specified
- Bedrooms: Not specified
- Flooring: Vinyl
- Bathrooms: 1 full bathroom; 1 half bathroom
- Heating & cooling: Central heating (electric); Central air conditioning (electric)
- Interior features: Vinyl flooring; Total of 4 rooms
- Laundry & utility: Laundry details not specified
Neighborhood map
What this means for you Summary
Snapshot
- This is a 2-bed/2.0-bath manufactured listed at $115k.
Deal economics
- At list price, monthly cash flow is $226 ($3k/yr) — positive.
- The deal already cash-flows at list — no discount required.
- Meets the 1% rule at list price ($1k rent vs $115k).
- Recommended offer: $108k (6.0% below list) — sets the bar for market timing.
- Cap rate 8.6% vs local median 4.3% in Sebring — top-decile yield for the area; either an underpriced asset or a hidden risk that comps aren't pricing in. Stress-test before assuming the spread holds.
Location & tenants
- Location reads 66/100 on livability (#618 in FL) — a middle-class / working-renter tenant base. Strengths: cost of living A+, housing A+, health & safety A; Watch: amenities F, commute F, employment F.
- Highlands (other): math 45% / reading 43% proficiency, ranked #54 of 73 in FL (top 74%) — families likely to look elsewhere, expect single-tenant / working-renter base with shorter leases; 68% free/reduced lunch — lower-income household profile, screen leases tightly.
- Zoned schools: Sun 'N Lake Elementary School (math 63% / reading 59%, grade B, #653 of 2,144 statewide, top 31%, 618 students, 67% FRL); Hill-Gustat Middle School (math 53% / reading 50%, grade C, #232 of 571 statewide, top 41%, 705 students, 63% FRL); Avon Park High School (math 35% / reading 39%, grade F, #340 of 667 statewide, top 52%, 928 students, 67% FRL) — zoned schools at 66% FRL track the district average.
- Market conditions: Rents soft (-0.3%/yr); 481 active listings in the ZIP; 980 units permitted in Highlands County in 2024 (80 in 5+ unit buildings).
Forward outlook
- Local home prices are declining (-3.0%/yr); year-one equity from $795 of loan paydown is wiped out by about $3k of value loss. Plan a longer hold.
Negotiation context
- It's been on market 79 days — a 6% lower offer ($108k) is reasonable based on typical stale-listing flexibility.
- 3 sale attempts since 6y ago with the ask held roughly flat each time — persistent listings suggest the price (not the market) is what's stuck; bring a comps-based counter.
- Current owner paid $24k; list at $115k implies a 389% gain — meaningful room to come down on a strong offer.
Risks & watch-outs
- Climate carrying-cost: severe wind risk, 99% chance of damaging wind over 30y; extreme-heat days projected 7→25/yr by 2055 (HVAC capex compounding) — expect insurance premiums to compound above CPI over the hold.
Questions for the listing agent
- It's been on market 79 days. Have you received any prior offers? Is the seller open to a 6% concession, seller financing, or rate buy-down credit?
- Built in 1975 — when were the roof, HVAC, electrical panel, plumbing, and water heater last replaced?
- Why hasn't it sold? Are there any deal-killer items the seller is aware of (foundation, flood, title, zoning, code violations)?
- Is there a deadline driving the sale (1031 exchange, divorce, estate, relocation)? That informs how much negotiation room exists.
- Schools are D-rated, which usually means shorter tenancies and higher turnover. Who's the typical renter profile here, and what's been the actual vacancy rate?
- The area grade is low — what's the realistic commute time and amenity access for the typical tenant pool here? Any planned neighborhood developments (good or bad) we should know about?
- What's the average days-on-market for RENTAL listings here right now (not sales)? A rising rental-DOM trend means longer vacancies and softer asking-rent achievability than the comps imply.
- What's the recent tenant-quality profile in this submarket — average credit score on applications, eviction rate, late-payment / NSF rate, and stable-employment percentage? A property-management company in the area should have these aggregated.
- How much new for-sale + rental construction is in the pipeline within 1–3 miles? Heavy new supply typically softens prices + rents 12–24 months out; constrained supply supports both.
Investment metrics
- 1% rule
- 1.05% ✓
- Cap rate
- 8.65%
- Cash-on-cash
- 8.41%
- DSCR
- 1.37
- GRM
- 7.9
CMA / ARV
- ARV (on-the-fly)
- $79,968
- Comps found
- 12
Show comp detail 12 sales within ~0.75 mi
| Address | Dist | Beds/Ba | Sqft | Sold | Price | $/sf | Match |
|---|---|---|---|---|---|---|---|
| 3208 Delaware Ave | 0.14mi | 2/1.0 | 672 (0%) | 7mo | $75,000 | $112 | 84 |
| 3447 Delaware Ave | 0.06mi | 2/2.0 | 720 (+7%) | 5mo | $85,000 | $118 | 81 |
| 2301 Georgia St | 0.24mi | 2/1.0 | 672 (0%) | 8mo | $80,000 | $119 | 78 |
| 3344 Maine Ave | 0.28mi | 2/2.0 | 672 (0%) | 11mo | $75,000 | $112 | 78 |
| 3147 Delaware Ave | 0.14mi | 2/1.0 | 672 (0%) | 14mo | $140,000 | $208 | 78 |
| 3407 Michigan Ave | 0.19mi | 2/1.5 | 672 (0%) | 20mo | $105,000 | $156 | 72 |
| 3345 New York Ave | 0.08mi | 2/1.0 | 720 (+7%) | 11mo | $110,000 | $153 | 71 |
| 3607 Indiana Ave | 0.32mi | 2/1.0 | 672 (0%) | 13mo | $88,000 | $131 | 70 |
| 3328 Illinois Ave | 0.17mi | 2/2.0 | 732 (+9%) | 14mo | $82,500 | $113 | 65 |
| 3313 Maine Ave | 0.26mi | 2/1.0 | 702 (+4%) | 15mo | $45,000 | $64 | 64 |
| 2413 Georgia St | 0.30mi | 2/1.5 | 720 (+7%) | 14mo | $112,000 | $156 | 61 |
| 2560 Skyview St | 0.72mi | 2/1.0 | 672 (0%) | 22mo | $19,000 | $28 | 44 |
Match score weights: distance 35% · size 25% · config 20% · recency 20%. Top-matched comps best support the ARV.
Projected returns pro-forma
-3.0% appreciation · 0.0% rent growth · sell at horizon
- IRR
- -6.8%
- Equity multiple
- 0.76×
- Total profit
- $-7,836
- Equity at exit
- $17,147
- IRR
- -1.1%
- Equity multiple
- 0.93×
- Total profit
- $-2,134
- Equity at exit
- $9,943
Cash invested: $32,200 (down + closing). Projections, not guarantees.
Landlord ↔ Tenant lean methodology
- Overall (STATE)
- 87 Strongly Landlord-Friendly
- State Florida
- 87 Strongly Landlord-Friendly · R+3
- County
- — inherits STATE
- City
- — inherits STATE
ZIP-level market 33870
- Home prices YoY
- -20.0%
- Rents YoY
- -0.3%
- Active inventory
- 481
- Price-to-rent
- 7.9×
Monthly cashflow live
- Estimated rent
- $1,213 medium interval (Pro) →
- Mortgage (P&I)
- −$603
- Tax from tax record
- −$82 /mo · $979/yr
- Insurance
- −$48
- HOA
- −$0
- Vacancy / Maint / Mgmt
- −$255
- Net cashflow
- $226
Break-even live
Sensitivity live
| Price | -10% $291 | -5% $258 | +0% $226 | +5% $193 | +10% $161 |
|---|---|---|---|---|---|
| Rent | -10% $130 | -5% $178 | +0% $226 | +5% $274 | +10% $321 |
| Rate | -1.0pp $284 | -0.5pp $255 | base $226 | +0.5pp $196 | +1.0pp $166 |
UW: 25.0% down · 7.5% · 30yr · 1.5% tax · 5.0% vac · 8.0% maint · 8.0% mgmt
Financing live
Cash to close
- Down payment
- $28,750
- Closing costs
- $3,450
- Reserves months
- —
- Total cash needed
- —
Loan-product check · same deal, 3 products live
Conventional
25% down · 7.5% · 30yr
- Down + closing
- —
- Monthly P&I
- —
- Monthly cashflow
- —
- DSCR
- —
- Eligible?
- —
Personal DTI + credit; lowest rate.
DSCR
20% down · 8.5% · 30yr
- Down + closing
- —
- Monthly P&I
- —
- Monthly cashflow
- —
- DSCR
- —
- Eligible?
- —
No personal income docs; deal must DSCR.
Hard money
10% down · 12.0% · 12mo
- Down + closing
- —
- Monthly P&I
- —
- Monthly cashflow
- —
- DSCR
- —
- Eligible?
- —
Short-term bridge; refi at stabilization.
Listing history 22 events
-
2026-06-21days on market $115,000 Active 79 DOM
-
2026-06-19days on market $115,000 Active 77 DOM
-
2026-06-18days on market $115,000 Active 76 DOM
-
2026-06-17days on market $115,000 Active 75 DOM
-
2026-06-16days on market $115,000 Active 74 DOM
-
2026-06-15days on market $115,000 Active 73 DOM
-
2026-06-14days on market $115,000 Active 71 DOM
-
2026-06-10days on market $115,000 Active 68 DOM
-
2026-06-09days on market $115,000 Active 67 DOM
-
2026-06-08days on market $115,000 Active 66 DOM
-
2026-06-07days on market $115,000 Active 65 DOM
-
2026-06-02days on market $115,000 Active 60 DOM
-
2026-06-01days on market $115,000 Active 59 DOM
-
2026-05-31days on market $115,000 Active 58 DOM
-
2026-05-30days on market $115,000 Active 57 DOM
-
2026-05-13price $115,000
-
2026-04-03$118,000 Active
-
2024-06-24price $124,900
-
2024-04-22price $129,900
-
2024-03-08$134,900 Active
-
2020-05-27soldstatus $23,500 267-char remark
Show marketing remark (267 chars)
Want to Own your Mobile Home and Land?! HERE IT IS! Conveniently located in a Mobile Home Park with NO Association Fee. Storage Shed in the Back. This Home is a Fixer Upper and is Priced Accordingly. Caution: there are a few softs spots (flooring) near the bedroom.
-
2020-05-04$19,900 267-char remark
Show marketing remark (267 chars)
Want to Own your Mobile Home and Land?! HERE IT IS! Conveniently located in a Mobile Home Park with NO Association Fee. Storage Shed in the Back. This Home is a Fixer Upper and is Priced Accordingly. Caution: there are a few softs spots (flooring) near the bedroom.
ⓘ Source: listings_history table (triggers on properties + properties_extension) + one-shot
backfill from property_details.listing_events for pre-trigger history.
Tax reassessment forecast FL · Resets to sale price
- Current annual tax
- $979 · $82/mo
- Projected year-2 tax
- $979 · $82/mo
- Expected delta
- $0/yr ($0/mo · 0.0%)
ⓘ Screening estimate from a state-policy table — verify with the county assessor before closing.
Climate risk First Street
- Flood 1/10 Low FEMA zone X (unshaded) · 0% chance over 30 yrs
- Wildfire 4/10 Moderate
- Heat 8/10 Severe 7 d/yr ≥108°F today · 25 d/yr by 30 yrs out
- Wind 9/10 Extreme 99% chance of damaging wind over 30 yrs
- Air quality 2/10 Low 2 unhealthy d/yr today · 2 by 30 yrs out
Nearby sold comps map
Loading sold comps map…
Walkable amenities ~0.75 mi
Loading nearby amenities…
Taxation est. · year 1
- Rental income
- $14,555
- − Mortgage interest
- −$6,442
- − Property taxes
- −$979
- − Insurance
- −$575
- − Repairs & maintenance
- −$1,164
- − Management
- −$1,164
- − Depreciation
- −$3,345
- Taxable income
- $885
- Est. tax owed @ 24.0%
- −$213
- After-tax cash flow
- $2,496/yr
For passive investors: Depreciation is non-cash, so a rental often shows a tax loss while cash-flowing — sheltering income. Rental losses are passive: they offset passive income freely, and up to $25,000/yr can offset ordinary (W-2) income if you actively participate and your MAGI is under $100k (phasing out to $0 by $150k); unused losses carry forward. On sale, claimed depreciation is recaptured at up to 25%, and gains may owe capital-gains tax (a 1031 exchange can defer both). Figures are a year-1 estimate at your 24.0% rate — not tax advice; consult a CPA.
Schools (NCES district)
- District
- Highlands
- NCES district ID
- 1200840
- Math proficiency
- 45% ▼ -7.00%
- Reading proficiency
- 43% ▼ -3.00%
- Median HH income
- $35,276
- Composite
- 36.42/100
- National rank
- #4672
- State rank
- #54 of 73 in FL
Livability — Sebring
- Score
- 66/100
- State rank
- #618
- US rank
- #11992
Category grades
Schools grade is shown separately in the Schools card above.
Census & demographics
- County
- Highlands County · 98,898 people
- City population
- 50,797
- Metro
- Sebring-Avon Park, FL
- Population (ZIP)
- 25,195
- Household income
- $49,942
- Rent vs Own
- Severe rent burden
- 994.0
Population outlook (Highlands County) Hauer SSP2
- Today (2025)
- 99,674 people
- By 2030
- 99,615 · -0.1%
- By 2040
- 99,342 · -0.3%
- By 2050
- 98,242 · -1.4%
- By 2075
- 93,291 · -6.4%
- By 2100
- 79,894 · -19.8%
Race, ethnicity, and origin ACS 2023
- Neighborhood character
- Diverse neighborhood (Simpson 0.57)
- Race & ethnicity
- White 60% Hispanic / Latino 22% Black 13% Two or more races 10% Asian 1%
- Hispanic origin (detail)
- Mexican 8% Puerto Rican 7% Cuban 5%
- Common ancestry
- Slovak 2% Romanian 1% Lithuanian 1%
- Foreign-born
- 10% · Canada, Jamaica, China
- Languages at home
- 80% English-only · Spanish 16% Other Indo-European 1% French/Haitian/Cajun 1%
Political lean MEDSL · Highlands
- 2024 margin
- Solid R (+40.8) · D 29.3% · R 70.1%
- 2008→2024 swing
- -22.7pp toward R · 2008: -18.1pp · 2024: -40.8pp
- All cycles
- 2024: R+40.8 2020: R+34.4 2016: R+32.0 2012: R+23.0 2008: R+18.1
Not yet ingested
- Civics
- —
Market trends
- HPI YoY
- ▼ -68.68%
- Current HPI
- 273.9861
- Rent YoY
- ▼ -0.29%
- Metro
- Sebring-Avon Park, FL
- State GDP YoY
- ▲ 3.28%
- F500 in state
- 36
Industry mix (Fortune 500 HQ in FL)
| Industry | F500 HQs | Revenue |
|---|---|---|
| Industrial Technology | 2 | $29B |
|
||
| Insurance | 2 | $17B |
|
||
| Retail | 1 | $60B |
|
||
| Technology Distribution | 1 | $58B |
|
||
| Homebuilding | 1 | $35B |
|
||
| Technology Manufacturing | 1 | $35B |
|
||
Price history
+477.9% since first listed7 events — show timeline
- 2026-05-13 Price Changed $115,000 HAOR as distributed by MLS GRID
- 2026-04-03 Listed $118,000 HAOR as distributed by MLS GRID
- 2024-06-24 Price Changed $124,900 HAOR as distributed by MLS GRID
- 2024-04-22 Price Changed $129,900 HAOR as distributed by MLS GRID
- 2024-03-08 Listed $134,900 HAOR as distributed by MLS GRID
- 2020-05-27 Sold (MLS) $23,500 HAOR as distributed by MLS GRID
- 2020-05-04 Listed $19,900 HAOR as distributed by MLS GRID
Property tax history
+6.5%/yrLatest (2025): $979 · +0.2% YoY. Source: county tax records.
Cash-flow waterfall
monthlySold comps — $/sqft
last 12 mo · ≤1 miLoading sold comps…