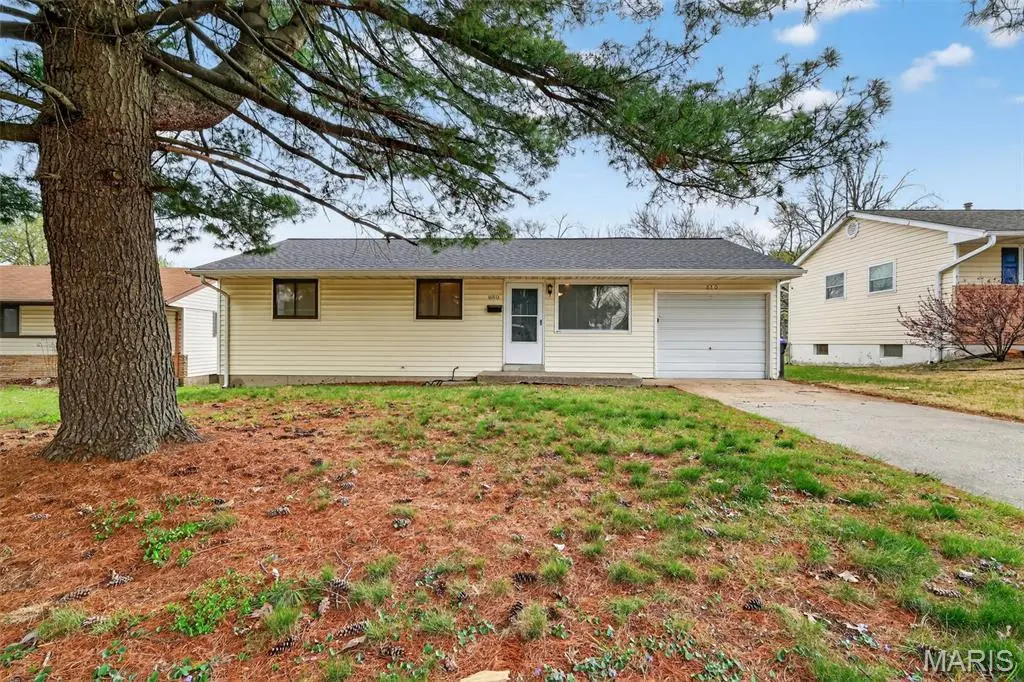
880 Tyson Dr · Florissant, MO
Flood risk 6/10 · Moderate
- FEMA flood zone
- X (unshaded)
- Chance of flooding over 30 yrs
- 0.73%
- Est. flood insurance / yr
- $473 – $860
Fire risk 1/10 · Minimal
- Est. fire insurance / yr
- $1,054 – $1,958
Heat risk 4/10 · Minor
- Hot days now (above 105°F)
- 7 days/yr
- Hot days in 30 yrs
- 21 days/yr
Wind risk 2/10 · Minimal
- Chance of severe wind over 30 yrs
- 1.0%
Air-quality risk 3/10 · Minor
- Unhealthy air days now
- 3 days/yr
- Unhealthy air days in 30 yrs
- 5 days/yr
Risk factors via First Street. Map © Google.
Why this score? — see what drove the C+ grade
The composite is a weighted blend of 9 inputs, each scored 0–100. Each bar is that input's sub-score; the figure is the points it added to the 100-point composite (weight × sub-score).
- Cash flow +23.9/30.0
- ARV discount +13.2/15.0
- DSCR +7.7/10.0
- 1% rule +6.1/10.0
- Livability +3.7/5.0
- Rent growth +3.6/5.0
- Condition / age +2.5/5.0
- Schools +1.7/10.0
- Appreciation +0.0/10.0
$139,900
🖨 Deal sheet (PDF) 📄 Offer letter ✓ Due diligence
Listing remarks MLS
Charming three bedroom home with a 1 car garage. HUD Aquired Property. Property Being sold ' AS IS '. All utilities are turned OFF. Please , use discretion when showing and bring a flashlight.
Key facts
- 7,501 sq ft lot
- Garage
- Built 1955
Property features AI
Finance
- Other: Living area reported as 927 (public records); Lot size approximately 0.1722 acre
- Financial info: Lease not considered
Exterior
- Parking: Attached garage (1-car) with garage facing front; Total parking for 1 vehicle
- Utilities: Public water; Public sewer; Electric service: Other
- Home design: Single-family residence; One story; House structure
- Construction: Vinyl siding; Composition roof; Built on slab foundation
- Exterior features: Paved road access; Lot features: Other
Interior
- Kitchen: Free-standing electric range; Refrigerator
- Bedrooms: Three bedrooms on the main level
- Flooring: Laminate
- Bathrooms: One full bathroom on the main level
- Heating & cooling: Other heating; Central air
- Interior features: Partial basement; Central air
- Laundry & utility: Slab foundation
Neighborhood map
What this means for you Summary
Snapshot
- This is a 3-bed/1.0-bath single-family listed at $140k.
Deal economics
- At list price, monthly cash flow is $272 ($3k/yr) — positive.
- The deal already cash-flows at list — no discount required.
- Meets the 1% rule at list price ($2k rent vs $140k).
- Cap rate 8.6% vs local median 6.3% in Florissant — top-decile yield for the area; either an underpriced asset or a hidden risk that comps aren't pricing in. Stress-test before assuming the spread holds.
Location & tenants
- Location reads 73/100 on livability (#82 in MO) — a middle-class / working-renter tenant base. Strengths: cost of living A+, housing A+, health & safety B+; Watch: crime C-, amenities D+, commute F.
- Hazelwood (suburban): math 11% / reading 26% proficiency, ranked #306 of 324 in MO (top 94%) — low school quality limits family demand, transient renter base, plan for 1-2y turnover.
- Zoned schools: Jamestown Elem. (math 2% / reading 37%, grade F, #935 of 1,115 statewide, top 84%, 333 students, 66% FRL); Northwest Middle (math 18% / reading 26%, grade F, #332 of 391 statewide, top 86%, 767 students, 62% FRL); Hazelwood Central High (math 12% / reading 33%, grade F, #455 of 521 statewide, top 88%, 1,628 students, 52% FRL).
- Market conditions: Rents rising fast (+4.3%/yr); 271 active listings in the ZIP; 37 comparable units currently listed for rent nearby; rentals at typical pace (median 19d on market — plan ~3-4 weeks tenant-placement turnaround); 920 units permitted in St. Louis County in 2024 (250 in 5+ unit buildings).
Forward outlook
- Local home prices are declining (-3.0%/yr); year-one equity from $967 of loan paydown is wiped out by about $4k of value loss. Plan a longer hold.
Negotiation context
- Only 12 days on market — expect competitive offers; lowballing is unlikely to land.
- 2 sale attempts since 14y ago with the ask held roughly flat each time — persistent listings suggest the price (not the market) is what's stuck; bring a comps-based counter.
- Current owner paid $68k; list at $140k implies a 106% gain — meaningful room to come down on a strong offer.
Risks & watch-outs
- Watch-outs: built in 1955 — expect roof / HVAC / electrical / plumbing capex.
- Climate carrying-cost: major flood risk — expect insurance premiums to compound above CPI over the hold.
Questions for the listing agent
- Built in 1955 — when were the roof, HVAC, electrical panel, plumbing, and water heater last replaced?
- Is there a deadline driving the sale (1031 exchange, divorce, estate, relocation)? That informs how much negotiation room exists.
- Schools are D-rated, which usually means shorter tenancies and higher turnover. Who's the typical renter profile here, and what's been the actual vacancy rate?
- What's the average days-on-market for RENTAL listings here right now (not sales)? A rising rental-DOM trend means longer vacancies and softer asking-rent achievability than the comps imply.
- What's the recent tenant-quality profile in this submarket — average credit score on applications, eviction rate, late-payment / NSF rate, and stable-employment percentage? A property-management company in the area should have these aggregated.
- How much new for-sale + rental construction is in the pipeline within 1–3 miles? Heavy new supply typically softens prices + rents 12–24 months out; constrained supply supports both.
Investment metrics
- 1% rule
- 1.11% ✓
- Cap rate
- 8.63%
- Cash-on-cash
- 8.34%
- DSCR
- 1.37
- GRM
- 7.5
CMA / ARV
- ARV (on-the-fly)
- $160,371
- Comps found
- 12
Show comp detail 12 sales within ~0.75 mi
| Address | Dist | Beds/Ba | Sqft | Sold | Price | $/sf | Match |
|---|---|---|---|---|---|---|---|
| 695 Mullanphy Rd | 0.20mi | 3/1.0 | 927 (0%) | 1mo | $185,000 | $200 | 90 |
| 715 Tyson Dr | 0.18mi | 3/1.5 | 927 (0%) | 3mo | $179,900 | $194 | 87 |
| 1435 Aspen Dr | 0.43mi | 3/1.0 | 912 (-2%) | 1mo | $134,000 | $147 | 76 |
| 85 Ruth Dr | 0.35mi | 2/1.0 (-1) | 912 (-2%) | 2mo | $144,900 | $159 | 74 |
| 515 Myrtle Dr | 0.40mi | 3/1.0 | 962 (+4%) | 3mo | $174,900 | $182 | 73 |
| 1115 Verlene Dr | 0.31mi | 3/2.0 | 980 (+6%) | 3mo | $174,900 | $178 | 70 |
| 2052 Aristocrat Dr | 0.52mi | 3/1.5 | 960 (+4%) | 1mo | $89,900 | $94 | 67 |
| 680 Central Pkwy | 0.74mi | 3/1.5 | 936 (+1%) | 3mo | $99,900 | $107 | 59 |
| 1865 Violet Dr | 0.34mi | 3/1.5 | 1,064 (+15%) | 0mo | $100,000 | $94 | 57 |
| 750 Blackbird Dr | 0.49mi | 3/1.5 | 1,025 (+11%) | 1mo | $174,900 | $171 | 56 |
| 460 Wren Dr | 0.69mi | 3/1.0 | 1,025 (+11%) | 2mo | $177,000 | $173 | 48 |
| 660 Crabapple Ln | 0.54mi | 3/2.0 | 1,045 (+13%) | 2mo | $199,999 | $191 | 48 |
Match score weights: distance 35% · size 25% · config 20% · recency 20%. Top-matched comps best support the ARV.
Projected returns pro-forma
-3.0% appreciation · 4.27% rent growth · sell at horizon
- IRR
- -2.2%
- Equity multiple
- 0.92×
- Total profit
- $-3,302
- Equity at exit
- $20,860
- IRR
- 8.8%
- Equity multiple
- 1.71×
- Total profit
- $27,996
- Equity at exit
- $12,096
Cash invested: $39,172 (down + closing). Projections, not guarantees.
Landlord ↔ Tenant lean methodology
- Overall (STATE)
- 81 Strongly Landlord-Friendly
- State Missouri
- 81 Strongly Landlord-Friendly · R+10
- County
- — inherits STATE
- City
- — inherits STATE
ZIP-level market 63031
- Rents YoY
- 4.3%
- Active inventory
- 271
- Price-to-rent
- 7.5×
Monthly cashflow live
- Estimated rent
- $1,555 high interval (Pro) →
- Mortgage (P&I)
- −$734
- Tax from tax record
- −$165 /mo · $1,975/yr
- Insurance
- −$58
- HOA
- −$0
- Vacancy / Maint / Mgmt
- −$327
- Net cashflow
- $272
Break-even live
Sensitivity live
| Price | -10% $351 | -5% $312 | +0% $272 | +5% $233 | +10% $193 |
|---|---|---|---|---|---|
| Rent | -10% $149 | -5% $211 | +0% $272 | +5% $334 | +10% $395 |
| Rate | -1.0pp $343 | -0.5pp $308 | base $272 | +0.5pp $236 | +1.0pp $199 |
UW: 25.0% down · 7.5% · 30yr · 1.5% tax · 5.0% vac · 8.0% maint · 8.0% mgmt
Financing live
Cash to close
- Down payment
- $34,975
- Closing costs
- $4,197
- Reserves months
- —
- Total cash needed
- —
Loan-product check · same deal, 3 products live
Conventional
25% down · 7.5% · 30yr
- Down + closing
- —
- Monthly P&I
- —
- Monthly cashflow
- —
- DSCR
- —
- Eligible?
- —
Personal DTI + credit; lowest rate.
DSCR
20% down · 8.5% · 30yr
- Down + closing
- —
- Monthly P&I
- —
- Monthly cashflow
- —
- DSCR
- —
- Eligible?
- —
No personal income docs; deal must DSCR.
Hard money
10% down · 12.0% · 12mo
- Down + closing
- —
- Monthly P&I
- —
- Monthly cashflow
- —
- DSCR
- —
- Eligible?
- —
Short-term bridge; refi at stabilization.
Rent comps 37 comps
| Address | Beds | Baths | Sqft | Rent | $/sqft | DOM | Units | Dist |
|---|---|---|---|---|---|---|---|---|
| 855 Daniel Boone Dr Florissant, MO | 3.0 | 1.0 | 964 | $1,400 | $1.45 | 45d | 1 | 0.03mi |
| 765 Babler Dr Florissant, MO | 3.0 | 2.0 | 888 | $1,700 | $1.91 | 9d | 1 | 0.13mi |
| 1725 Fernbrook Ln Florissant, MO | 3.0 | 1.0 | 925 | $1,485 | $1.61 | 0d | 1 | 0.23mi |
| 4 Sharon Ct Florissant, MO | 3.0 | 2.0 | 1108 | $1,800 | $1.62 | 0d | 1 | 0.31mi |
| 470 Hundley Dr Florissant, MO | 3.0 | 2.0 | 962 | $1,595 | $1.66 | 45d | 1 | 0.39mi |
| 1015 Lindsay Ln Florissant, MO | 3.0 | 2.0 | 988 | $1,600 | $1.62 | 25d | 1 | 0.44mi |
| 1095 Humes Ln Florissant, MO | 3.0 | 1.5 | 1100 | $1,650 | $1.50 | 6d | 1 | 0.50mi |
| 1540 Aspen Dr Florissant, MO | 3.0 | 2.0 | 912 | $1,395 | $1.53 | 9d | 1 | 0.55mi |
| 1540 Aspen Dr Florissant, MO | 3.0 | 2.0 | 912 | $1,395 | $1.53 | 0d | 1 | 0.55mi |
| 2160 Splendor Dr Florissant, MO | 3.0 | 2.0 | 1100 | $1,800 | $1.64 | 4d | 1 | 0.83mi |
| 3 Champlain Ct Florissant, MO | 3.0 | 1.0 | 1100 | $1,600 | $1.45 | 45d | 1 | 0.88mi |
| 13 Bruce Dr Florissant, MO | 2.0 | 1.0 | 880 | $975 | $1.11 | 25d | 1 | 0.88mi |
| 13 Bruce Dr Unit Bruce 13-2 Florissant, MO | 2.0 | 1.0 | 880 | $975 | $1.11 | 45d | 1 | 0.88mi |
| 14 Bruce Dr Unit Bruce 14-4 Florissant, MO | 2.0 | 1.0 | 880 | $975 | $1.11 | 45d | 1 | 0.89mi |
| 9 Saint Celeste Dr Florissant, MO | 3.0 | 1.0 | 992 | $1,450 | $1.46 | 45d | 1 | 0.92mi |
| 1710 Kay Dr Florissant, MO | 3.0 | 1.0 | 960 | $1,500 | $1.56 | 3d | 1 | 0.93mi |
| 10 Saint Celeste Dr Florissant, MO | 2.0 | 1.0 | 716 | $1,290 | $1.80 | 14d | 1 | 0.94mi |
| 1315 Bobolink Dr Florissant, MO | 3.0 | 2.0 | 1025 | $1,700 | $1.66 | 14d | 1 | 0.97mi |
| 330 Moule Dr Florissant, MO | 3.0 | 1.0 | 1014 | $1,575 | $1.55 | 45d | 1 | 0.97mi |
| 785 Florland Dr Florissant, MO | 3.0 | 1.0 | 1100 | $1,700 | $1.55 | 19d | 1 | 1.02mi |
| 155 Reeb Ln Apt 2 Florissant, MO | 2.0 | 1.0 | 850 | $995 | $1.17 | 45d | 1 | 1.04mi |
| 167 Reeb Ln Florissant, MO | 1.0–2.0 | 1.0 | 850 | $1,300 | $1.53 | 3d | 4 | 1.07mi |
| 21 Quick Dr Apt 3 Florissant, MO | 2.0 | 1.0 | 850 | $995 | $1.17 | 25d | 1 | 1.15mi |
| 21 Quick Dr Apt 1 Florissant, MO | 2.0 | 1.0 | 850 | $1,100 | $1.29 | 45d | 1 | 1.15mi |
| 775 Sherwood Dr Florissant, MO | 3.0 | 1.0 | 1023 | $1,690 | $1.65 | 45d | 1 | 1.15mi |
| 651 Southwell Ln Florissant, MO | 2.0 | 1.0 | 694 | $1,100 | $1.59 | 19d | 1 | 1.16mi |
| 23 Quick Dr Apt 2 Florissant, MO | 2.0 | 1.0 | 850 | $1,100 | $1.29 | 45d | 1 | 1.17mi |
| 840 Dawnview Ct Florissant, MO | 3.0 | 1.5 | 750 | $900 | $1.20 | 25d | 1 | 1.21mi |
| 1545 Swan Dr Florissant, MO | 3.0 | 1.0 | 1064 | $1,590 | $1.49 | 9d | 1 | 1.22mi |
| 1095 Cedar Pl Florissant, MO | 3.0 | 1.5 | 1107 | $1,710 | $1.54 | 0d | 1 | 1.24mi |
| 1045 N New Florissant Rd Florissant, MO | 2.0 | 1.0 | 783 | $1,250 | $1.60 | 16d | 1 | 1.31mi |
| 1004 N New Florissant Rd Florissant, MO | 2.0 | 1.0 | 719 | $1,375 | $1.91 | 25d | 1 | 1.34mi |
| 2857 Dawnview Dr Florissant, MO | 3.0 | 1.0 | 890 | $1,325 | $1.49 | 9d | 1 | 1.36mi |
| 305 S Lafayette St Florissant, MO | 3.0 | 1.0 | 864 | $1,384 | $1.60 | 0d | 1 | 1.38mi |
| 858 Hazelvalley Dr Hazelwood, MO | 3.0 | 1.5 | 912 | $1,450 | $1.59 | 45d | 1 | 1.39mi |
| 2485 Jenkee Dr Florissant, MO | 3.0 | 1.0 | 960 | $1,376 | $1.43 | 0d | 1 | 1.41mi |
| 2942 Chance Dr Florissant, MO | 3.0 | 1.0 | 912 | $1,700 | $1.86 | 14d | 1 | 1.44mi |
Listing history 9 events
-
2026-04-22status Pending
-
2026-04-10$139,900 Active
-
2019-05-20soldstatus $67,750
-
2019-05-17soldstatus $57,500
-
2013-01-11soldstatus 196-char remark
Show marketing remark (196 chars)
Charming three bedroom home with a 1 car garage. HUD Aquired Property. Property Being sold ' AS IS '. All utilities are turned OFF. Please , use discretion when showing and bring a flashlight.
-
2012-10-20$37,000 196-char remark
Show marketing remark (196 chars)
Charming three bedroom home with a 1 car garage. HUD Aquired Property. Property Being sold ' AS IS '. All utilities are turned OFF. Please , use discretion when showing and bring a flashlight.
-
1991-04-30soldstatus $64,800
-
1991-04-01soldstatus
-
1989-12-01soldstatus $42,500
ⓘ Source: listings_history table (triggers on properties + properties_extension) + one-shot
backfill from property_details.listing_events for pre-trigger history.
Tax reassessment forecast MO · Resets to sale price
- Current annual tax
- $1,975 · $165/mo
- Projected year-2 tax
- $1,975 · $165/mo
- Expected delta
- $0/yr ($0/mo · 0.0%)
ⓘ Screening estimate from a state-policy table — verify with the county assessor before closing.
Climate risk First Street
- Flood 6/10 Major FEMA zone X (unshaded) · 73% chance over 30 yrs
- Wildfire 1/10 Low
- Heat 4/10 Moderate 7 d/yr ≥105°F today · 21 d/yr by 30 yrs out
- Wind 2/10 Low 100% chance of damaging wind over 30 yrs
- Air quality 3/10 Moderate 3 unhealthy d/yr today · 5 by 30 yrs out
Nearby sold comps map
Loading sold comps map…
Walkable amenities ~0.75 mi
Loading nearby amenities…
Taxation est. · year 1
- Rental income
- $18,665
- − Mortgage interest
- −$7,837
- − Property taxes
- −$1,975
- − Insurance
- −$700
- − Repairs & maintenance
- −$1,493
- − Management
- −$1,493
- − Depreciation
- −$4,070
- Taxable income
- $1,097
- Est. tax owed @ 24.0%
- −$263
- After-tax cash flow
- $3,003/yr
For passive investors: Depreciation is non-cash, so a rental often shows a tax loss while cash-flowing — sheltering income. Rental losses are passive: they offset passive income freely, and up to $25,000/yr can offset ordinary (W-2) income if you actively participate and your MAGI is under $100k (phasing out to $0 by $150k); unused losses carry forward. On sale, claimed depreciation is recaptured at up to 25%, and gains may owe capital-gains tax (a 1031 exchange can defer both). Figures are a year-1 estimate at your 24.0% rate — not tax advice; consult a CPA.
Schools (NCES district)
- District
- Hazelwood
- NCES district ID
- 2913830
- Math proficiency
- 11% ▼ -13.00%
- Reading proficiency
- 26% ▼ -6.00%
- Median HH income
- $51,621
- Composite
- 16.77/100
- National rank
- #9156
- State rank
- #306 of 324 in MO
Livability — Florissant
- Score
- 73/100
- State rank
- #82
- US rank
- #5406
Category grades
Schools grade is shown separately in the Schools card above.
Census & demographics
- Census place
- Florissant, MO
- County
- Saint Louis County · 888,823 people
- City population
- 69,104
- Metro
- St. Louis, MO-IL
- Population (ZIP)
- 50,196
- Household income
- $70,811
- Rent vs Own
- Severe rent burden
- 1279.0
Population outlook (St. Louis County) Hauer SSP2
- Today (2025)
- 1,025,227 people
- By 2030
- 1,028,023 · +0.3%
- By 2040
- 1,020,940 · -0.4%
- By 2050
- 1,007,280 · -1.8%
- By 2075
- 987,277 · -3.7%
- By 2100
- 921,984 · -10.1%
Race, ethnicity, and origin ACS 2023
- Neighborhood character
- Diverse neighborhood (Simpson 0.58)
- Race & ethnicity
- White 49% Black 41% Two or more races 7% Hispanic / Latino 2%
- Common ancestry
- Romanian 3% Lithuanian 3% Swedish 1%
- Foreign-born
- 5% · Canada, Jamaica
- Languages at home
- 94% English-only · Spanish 2% Arabic 1%
Political lean MEDSL · St. Louis
- 2024 margin
- Strong D (+23.4) · D 60.8% · R 37.4% · Other 1.7%
- 2008→2024 swing
- +3.5pp toward D · 2008: 19.9pp · 2024: 23.4pp
- All cycles
- 2024: D+23.4 2020: D+24.0 2016: D+16.2 2012: D+13.7 2008: D+19.9
Not yet ingested
- Civics
- —
Market trends
- HPI YoY
- ▼ -223.57%
- Current HPI
- 202.7192
- Rent YoY
- ▲ 4.27%
- Metro
- St. Louis, MO-IL
- State GDP YoY
- ▲ 1.84%
- F500 in state
- 20
Industry mix (Fortune 500 HQ in MO)
| Industry | F500 HQs | Revenue |
|---|---|---|
| Healthcare | 1 | $163B |
|
||
| Insurance | 1 | $21B |
|
||
| Industrial Technology | 1 | $17B |
|
||
| Retail | 1 | $16B |
|
||
| Industrial Distribution | 1 | $10B |
|
||
| Utilities | 1 | $9B |
|
||
Price history
+229.2% since first listed9 events — show timeline
- 2026-04-22 Pending — MARIS as Distributed by MLS Grid
- 2026-04-10 Listed $139,900 MARIS as Distributed by MLS Grid
- 2019-05-20 Sold (Public Records) $67,750 Public Records
- 2019-05-17 Sold (Public Records) $57,500 Public Records
- 2013-01-11 Sold (MLS) — MARIS as Distributed by MLS Grid
- 2012-10-20 Listed $37,000 MARIS as Distributed by MLS Grid
- 1991-04-30 Sold (Public Records) $64,800 Public Records
- 1991-04-01 Sold (Public Records) — Public Records
- 1989-12-01 Sold (Public Records) $42,500 Public Records
Property tax history
+3.0%/yrLatest (2022): $1,975 · +2.7% YoY. Source: county tax records.
Cash-flow waterfall
monthlySold comps — $/sqft
last 12 mo · ≤1 miLoading sold comps…