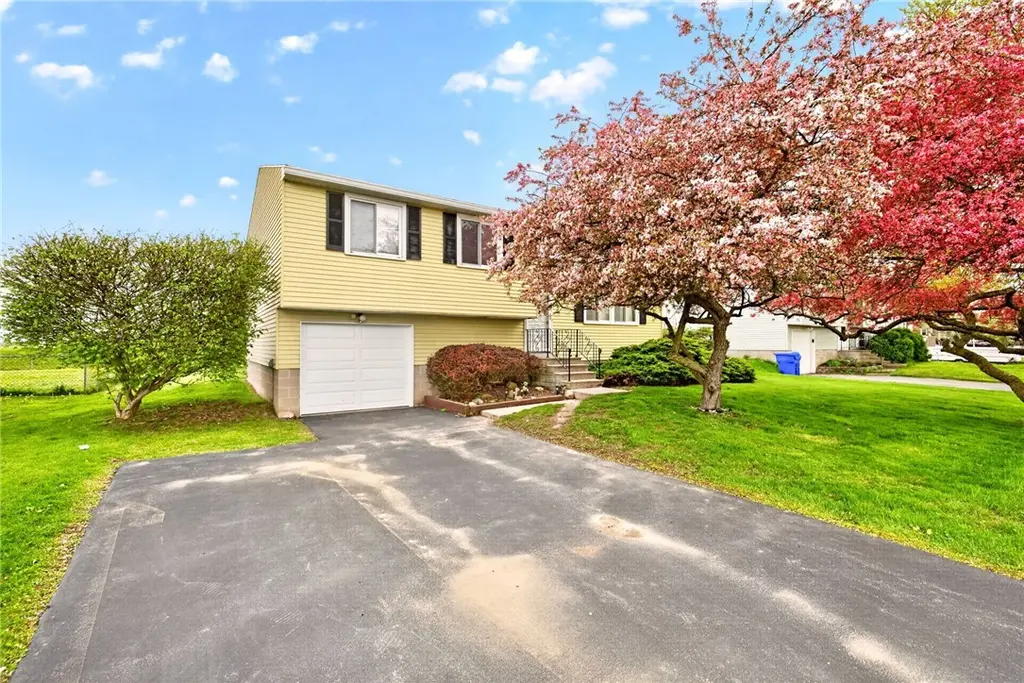
17 Fox Hollow Dr · Hamlin, NY
Flood risk 1/10 · Minimal
- FEMA flood zone
- X (unshaded)
- Chance of flooding over 30 yrs
- 0.0%
- Est. flood insurance / yr
- $473 – $860
Fire risk 3/10 · Minor
- Est. fire insurance / yr
- $691 – $1,283
Heat risk 2/10 · Minimal
- Hot days now (above 95°F)
- 7 days/yr
- Hot days in 30 yrs
- 15 days/yr
Wind risk 1/10 · Minimal
- Chance of severe wind over 30 yrs
- 1.0%
Air-quality risk 2/10 · Minimal
- Unhealthy air days now
- 1 days/yr
- Unhealthy air days in 30 yrs
- 2 days/yr
Risk factors via First Street. Map © Google.
Why this score? — see what drove the D grade
The composite is a weighted blend of 9 inputs, each scored 0–100. Each bar is that input's sub-score; the figure is the points it added to the 100-point composite (weight × sub-score).
- ARV discount +15.0/15.0
- Cash flow +7.7/30.0
- Schools +4.3/10.0
- Livability +3.4/5.0
- 1% rule +3.2/10.0
- Rent growth +2.5/5.0
- Condition / age +2.5/5.0
- DSCR +1.8/10.0
- Appreciation +0.0/10.0
$164,900
🖨 Deal sheet (PDF) 📄 Offer letter ✓ Due diligence
Key facts
- 8,712 sq ft lot
- Garage
- Built 1977
Property features AI
Exterior
- Parking: Attached garage (1 car)
- Utilities: Public water (connected); Sewer connected
- Home design: Single-story property; Vinyl siding; Existing/resale condition
- Construction: Block foundation
- Exterior features: Blacktop driveway; Rectangular residential lot (approx. 0.2 acres, 62 x 140); City street frontage
Interior
- Kitchen: Electric oven; Electric range; Refrigerator
- Bedrooms: 1 main-level bedroom
- Flooring: Carpet; Varied flooring
- Bathrooms: 1 full bathroom
- Heating & cooling: Gas forced-air heating; Central air conditioning
- Interior features: Eat-in kitchen; Full basement; 7 total rooms; Laundry in basement; Family room
- Laundry & utility: Washer/dryer hookups in basement; Gas water heater
Neighborhood map
What this means for you Summary
Snapshot
- This is a 4-bed/1.0-bath single-family listed at $165k.
Deal economics
- At list price, monthly cash flow is $-188 ($-2k/yr) — negative.
- To cash-flow at today's rent, offer at most $132k (20.1% below list).
- To meet the 1% rule (rent ≥ 1% of price), the offer needs to be $135k (17.9% below list).
- Recommended offer: $132k (20.1% below list) — sets the bar for cash-flow.
- Cap rate 4.9% vs local median 4.1% in Hamlin — meaningfully above typical; check what's discounted (condition, days-on-market, listing class) to confirm the premium yield is real.
Location & tenants
- Location reads 68/100 on livability (#557 in NY) — a middle-class / working-renter tenant base. Strengths: housing A+, cost of living A; Watch: employment C-, crime D, schools F.
- Brockport Central School District (town): math 45% / reading 55% proficiency, ranked #369 of 590 in NY (top 62%) — acceptable for families but not a draw, mixed tenant base, ~2y average lease.
- Market conditions: 51 active listings in the ZIP; 1,169 units permitted in Monroe County in 2024 (591 in 5+ unit buildings).
Forward outlook
- Local home prices are declining (-3.0%/yr); year-one equity from $1k of loan paydown is wiped out by about $5k of value loss. Plan a longer hold.
- Monroe County population projected to shrink 6% by 2050 — rents likely to lag national; underwrite the cash flow, not the appreciation.
Negotiation context
- Only 6 days on market — expect competitive offers; lowballing is unlikely to land.
Questions for the listing agent
- What do current leases actually rent for vs. the listed asking? Can we see a recent rent roll and the last 12 months of T-12 income?
- Built in 1977 — when were the roof, HVAC, electrical panel, plumbing, and water heater last replaced?
- Is there a deadline driving the sale (1031 exchange, divorce, estate, relocation)? That informs how much negotiation room exists.
- Schools are F-rated, which usually means shorter tenancies and higher turnover. Who's the typical renter profile here, and what's been the actual vacancy rate?
- Crime grade is D in this area — have there been break-ins, vandalism, or insurance claims at this property in the last 3 years? What carrier currently insures it and at what premium?
- The area grade is low — what's the realistic commute time and amenity access for the typical tenant pool here? Any planned neighborhood developments (good or bad) we should know about?
- What's the average days-on-market for RENTAL listings here right now (not sales)? A rising rental-DOM trend means longer vacancies and softer asking-rent achievability than the comps imply.
- What's the recent tenant-quality profile in this submarket — average credit score on applications, eviction rate, late-payment / NSF rate, and stable-employment percentage? A property-management company in the area should have these aggregated.
- How much new for-sale + rental construction is in the pipeline within 1–3 miles? Heavy new supply typically softens prices + rents 12–24 months out; constrained supply supports both.
Investment metrics
- 1% rule
- 0.82% ✗
- Cap rate
- 4.93%
- Cash-on-cash
- -4.88%
- DSCR
- 0.78
- GRM
- 10.2
CMA / ARV
- ARV (median comp)
- $224,577
- List price
- $164,900
- Delta
- -26.57%
- Verdict
- UNDERPRICED
- Comps
- 20 within 1.0 mi
Show comp detail 11 sales within ~0.75 mi
| Address | Dist | Beds/Ba | Sqft | Sold | Price | $/sf | Match |
|---|---|---|---|---|---|---|---|
| 8 Close Hollow Dr | 0.11mi | 3/1.5 (-1) | 1,250 (-0%) | 12mo | $175,000 | $140 | 77 |
| 29 Huntington Pkwy | 0.24mi | 3/1.5 (-1) | 1,260 (+0%) | 9mo | $215,000 | $171 | 74 |
| 2229 Lake Rd | 0.30mi | 3/1.0 (-1) | 1,316 (+5%) | 11mo | $195,000 | $148 | 63 |
| 15 Blossomdale Cir | 0.25mi | 3/1.0 (-1) | 1,212 (-4%) | 18mo | $175,000 | $144 | 62 |
| 49 Huntington Pkwy | 0.36mi | 3/1.5 (-1) | 1,343 (+7%) | 7mo | $210,000 | $156 | 59 |
| 66 Curtisdale Ln | 0.46mi | 3/1.5 (-1) | 1,328 (+6%) | 9mo | $210,000 | $158 | 54 |
| 56 Curtisdale Ln | 0.52mi | 3/1.5 (-1) | 1,200 (-4%) | 10mo | $200,000 | $167 | 53 |
| 23 Settlers Ln | 0.33mi | 3/1.5 (-1) | 1,185 (-6%) | 20mo | $212,000 | $179 | 52 |
| 45 Greenridge Cres | 0.34mi | 3/1.5 (-1) | 1,328 (+6%) | 19mo | $188,220 | $142 | 51 |
| 62 Curtisdale Ln | 0.49mi | 3/1.5 (-1) | 1,328 (+6%) | 13mo | $230,000 | $173 | 50 |
| 2969 Roosevelt Hwy | 0.69mi | 3/1.5 (-1) | 1,308 (+4%) | 24mo | $203,000 | $155 | 34 |
Match score weights: distance 35% · size 25% · config 20% · recency 20%. Top-matched comps best support the ARV.
Projected returns pro-forma
-3.0% appreciation · 3.0% rent growth · sell at horizon
- IRR
- -24.5%
- Equity multiple
- 0.16×
- Total profit
- $-38,585
- Equity at exit
- $24,587
- IRR
- -19.8%
- Equity multiple
- -0.05×
- Total profit
- $-48,619
- Equity at exit
- $14,258
Cash invested: $46,172 (down + closing). Projections, not guarantees.
Landlord ↔ Tenant lean methodology
- Overall (STATE)
- 15 Strongly Tenant-Friendly
- State New York
- 15 Strongly Tenant-Friendly · D+10
- County
- — inherits STATE
- City
- — inherits STATE
ZIP-level market 14464
- Home prices YoY
- -15.0%
- Active inventory
- 51
- Price-to-rent
- 10.2×
Monthly cashflow live
- Estimated rent
- $1,353 medium interval (Pro) →
- Mortgage (P&I)
- −$865
- Tax from tax record
- −$323 /mo · $3,878/yr
- Insurance
- −$69
- HOA
- −$0
- Vacancy / Maint / Mgmt
- −$284
- Net cashflow
- $-188
Break-even live
Sensitivity live
| Price | -10% $-94 | -5% $-141 | +0% $-188 | +5% $-234 | +10% $-281 |
|---|---|---|---|---|---|
| Rent | -10% $-295 | -5% $-241 | +0% $-188 | +5% $-134 | +10% $-81 |
| Rate | -1.0pp $-105 | -0.5pp $-146 | base $-188 | +0.5pp $-230 | +1.0pp $-274 |
UW: 25.0% down · 7.5% · 30yr · 1.5% tax · 5.0% vac · 8.0% maint · 8.0% mgmt
Financing live
Cash to close
- Down payment
- $41,225
- Closing costs
- $4,947
- Reserves months
- —
- Total cash needed
- —
Loan-product check · same deal, 3 products live
Conventional
25% down · 7.5% · 30yr
- Down + closing
- —
- Monthly P&I
- —
- Monthly cashflow
- —
- DSCR
- —
- Eligible?
- —
Personal DTI + credit; lowest rate.
DSCR
20% down · 8.5% · 30yr
- Down + closing
- —
- Monthly P&I
- —
- Monthly cashflow
- —
- DSCR
- —
- Eligible?
- —
No personal income docs; deal must DSCR.
Hard money
10% down · 12.0% · 12mo
- Down + closing
- —
- Monthly P&I
- —
- Monthly cashflow
- —
- DSCR
- —
- Eligible?
- —
Short-term bridge; refi at stabilization.
Listing history 2 events
-
2026-05-12status Pending 1145-char remark
-
2026-05-06$164,900 Active 1145-char remark
ⓘ Source: listings_history table (triggers on properties + properties_extension) + one-shot
backfill from property_details.listing_events for pre-trigger history.
Tax reassessment forecast NY · Partial reset (capped growth)
- Current annual tax
- $3,878 · $323/mo
- Projected year-2 tax
- $3,878 · $323/mo
- Expected delta
- $0/yr ($0/mo · 0.0%)
ⓘ Screening estimate from a state-policy table — verify with the county assessor before closing.
Climate risk First Street
- Flood 1/10 Low FEMA zone X (unshaded) · 0% chance over 30 yrs
- Wildfire 3/10 Moderate
- Heat 2/10 Low 7 d/yr ≥95°F today · 15 d/yr by 30 yrs out
- Wind 1/10 Low 100% chance of damaging wind over 30 yrs
- Air quality 2/10 Low 1 unhealthy d/yr today · 2 by 30 yrs out
Nearby sold comps map
Loading sold comps map…
Walkable amenities ~0.75 mi
Loading nearby amenities…
Taxation est. · year 1
- Rental income
- $16,237
- − Mortgage interest
- −$9,237
- − Property taxes
- −$3,878
- − Insurance
- −$824
- − Repairs & maintenance
- −$1,299
- − Management
- −$1,299
- − Depreciation
- −$4,797
- Taxable loss
- −$5,098
- Est. tax savings @ 24.0%
- +$1,223
- After-tax cash flow
- $-1,029/yr
For passive investors: Depreciation is non-cash, so a rental often shows a tax loss while cash-flowing — sheltering income. Rental losses are passive: they offset passive income freely, and up to $25,000/yr can offset ordinary (W-2) income if you actively participate and your MAGI is under $100k (phasing out to $0 by $150k); unused losses carry forward. On sale, claimed depreciation is recaptured at up to 25%, and gains may owe capital-gains tax (a 1031 exchange can defer both). Figures are a year-1 estimate at your 24.0% rate — not tax advice; consult a CPA.
Schools (NCES district)
- District
- Brockport Central School District
- NCES district ID
- 3605580
- Math proficiency
- 45% ▼ -14.00%
- Reading proficiency
- 55% ▲ 1.00%
- Median HH income
- $55,571
- Composite
- 43.28/100
- National rank
- #3044
- State rank
- #369 of 590 in NY
Livability — Hamlin
- Score
- 68/100
- State rank
- #557
- US rank
- #10030
Category grades
Schools grade is shown separately in the Schools card above.
Census & demographics
- Census place
- Hamlin, NY
- Population (ZIP)
- 6,725
Population outlook (Monroe County) Hauer SSP2
- Today (2025)
- 759,460 people
- By 2030
- 757,154 · -0.3%
- By 2040
- 740,644 · -2.5%
- By 2050
- 714,443 · -5.9%
- By 2075
- 645,883 · -15.0%
- By 2100
- 547,084 · -28.0%
Race, ethnicity, and origin ACS 2023
- Neighborhood character
- Predominantly White (95%)
- Race & ethnicity
- White 95% Two or more races 4% Black 2%
- Common ancestry
- Romanian 7% Slovak 4% Lithuanian 2%
- Foreign-born
- 0%
- Languages at home
- 99% English-only · Other Indo-European 1%
Political lean MEDSL · Monroe
- 2024 margin
- D (+19.1) · D 59.5% · R 40.5%
- 2008→2024 swing
- +1.4pp toward D · 2008: 17.7pp · 2024: 19.1pp
- All cycles
- 2024: D+19.1 2020: D+21.0 2016: D+14.1 2012: D+17.4 2008: D+17.7
Not yet ingested
- Civics
- —
Market trends
- HPI YoY
- ▼ -43.89%
- Current HPI
- 248.1985
- Rent YoY
- —
- Metro
- —
- State GDP YoY
- ▲ 2.60%
- F500 in state
- 92
Industry mix (Fortune 500 HQ in NY)
| Industry | F500 HQs | Revenue |
|---|---|---|
| Financial Services | 10 | $950B |
|
||
| Consumer Goods | 9 | $162B |
|
||
| Insurance | 4 | $225B |
|
||
| Telecommunications | 2 | $144B |
|
||
| Pharmaceuticals | 2 | $112B |
|
||
| Media / Entertainment | 2 | $69B |
|
||
Price history
2 events — show timeline
- 2026-05-12 Pending — UNYREIS
- 2026-05-06 Listed $164,900 UNYREIS
Property tax history
+6.5%/yrLatest (2025): $3,878 · +68.3% YoY. Source: county tax records.
Cash-flow waterfall
monthlySold comps — $/sqft
last 12 mo · ≤1 miLoading sold comps…