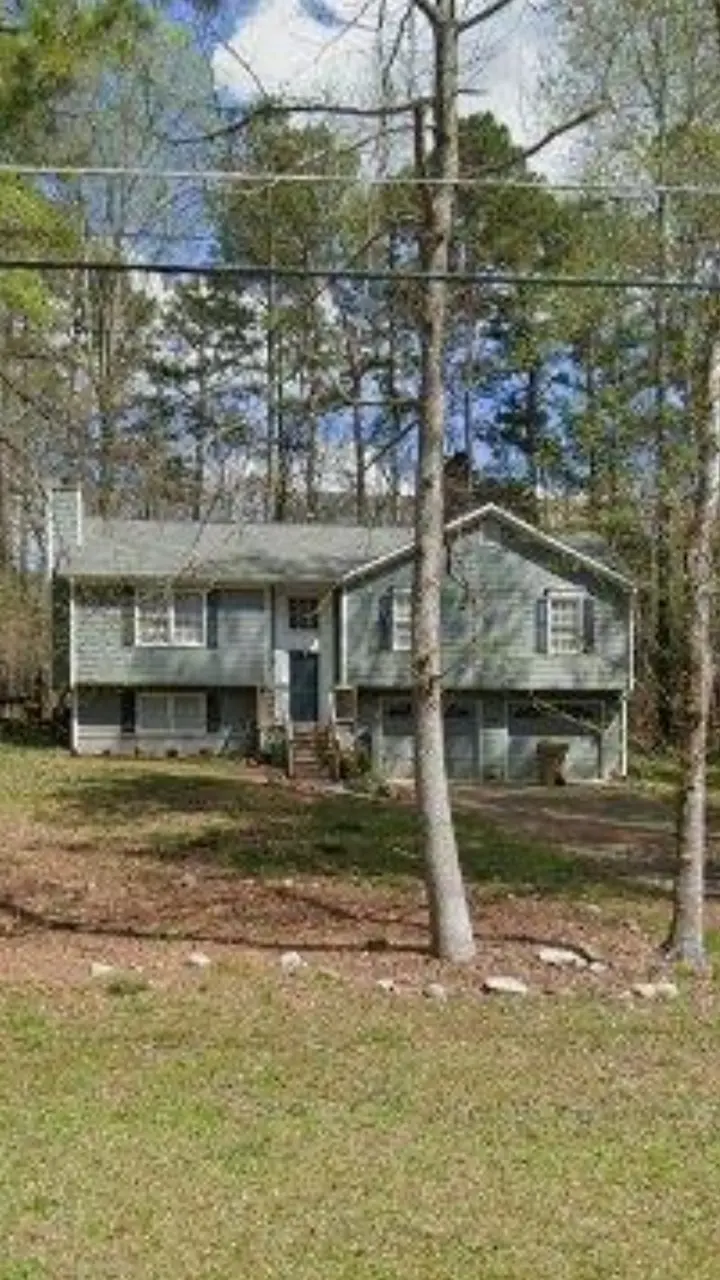
276 N Briar Rdg · Woodstock, GA
Flood risk 1/10 · Minimal
- FEMA flood zone
- X (unshaded)
- Chance of flooding over 30 yrs
- 0.0%
- Est. flood insurance / yr
- $473 – $860
Fire risk 3/10 · Minor
- Est. fire insurance / yr
- $963 – $1,789
Heat risk 5/10 · Moderate
- Hot days now (above 103°F)
- 7 days/yr
- Hot days in 30 yrs
- 19 days/yr
Wind risk 4/10 · Minor
- Chance of severe wind over 30 yrs
- 16.0%
Air-quality risk 4/10 · Minor
- Unhealthy air days now
- 6 days/yr
- Unhealthy air days in 30 yrs
- 7 days/yr
Risk factors via First Street. Map © Google.
Why this score? — see what drove the D grade
The composite is a weighted blend of 9 inputs, each scored 0–100. Each bar is that input's sub-score; the figure is the points it added to the 100-point composite (weight × sub-score).
- ARV discount +15.0/15.0
- Cash flow +9.5/30.0
- Schools +4.2/10.0
- Livability +3.7/5.0
- Rent growth +2.8/5.0
- DSCR +2.7/10.0
- Condition / age +2.5/5.0
- 1% rule +2.4/10.0
- Appreciation +0.0/10.0
$310,000
🖨 Deal sheet (PDF) 📄 Offer letter ✓ Due diligence
Listing remarks MLS
Lovely home in a quiet, friendly neighborhood in a fast-growing area of Woodstock. Cozy yet conveniently located, its close to everything you need and situated within great school districts.
Key facts
- Built 1988
- Listed 177 days
Neighborhood map
What this means for you Summary
Snapshot
- This is a 3-bed/2.0-bath single-family listed at $310k.
Deal economics
- At list price, monthly cash flow is $-214 ($-3k/yr) — negative.
- To cash-flow at today's rent, offer at most $272k (12.2% below list).
- To meet the 1% rule (rent ≥ 1% of price), the offer needs to be $228k (26.4% below list).
- Recommended offer: $228k (26.4% below list) — sets the bar for 1% rule.
- Cap rate 5.5% vs local median 3.3% in Woodstock — top-decile yield for the area; either an underpriced asset or a hidden risk that comps aren't pricing in. Stress-test before assuming the spread holds.
Location & tenants
- Location reads 73/100 on livability (#46 in GA) — a middle-class / working-renter tenant base. Strengths: crime A+, employment A+, housing A+; Watch: amenities F, commute F, health & safety F.
- Cherokee County (suburban): math 46% / reading 48% proficiency, ranked #17 of 174 in GA (top 10%) — families likely to look elsewhere, expect single-tenant / working-renter base with shorter leases.
- Zoned schools: Boston Elementary School (math 45% / reading 42%, grade F, #364 of 1,228 statewide, top 30%, 633 students, 29% FRL); E. T. Booth Middle School (math 41% / reading 50%, grade D+, #97 of 470 statewide, top 22%, 1,654 students, 33% FRL); Etowah High School (math 14% / reading 36%, grade F, #181 of 424 statewide, top 43%, 2,441 students, 28% FRL) — zoned schools at 30% FRL track the district average.
- Market conditions: Rents rising (+1.1%/yr); 274 active listings in the ZIP; 16 comparable units currently listed for rent nearby; rentals at typical pace (median 26d on market — plan ~3-4 weeks tenant-placement turnaround); high-income renter base; 2,665 units permitted in Cherokee County in 2024 (852 in 5+ unit buildings).
Forward outlook
- Local home prices are declining (-3.0%/yr); year-one equity from $2k of loan paydown is wiped out by about $9k of value loss. Plan a longer hold.
- Cherokee County population projected at +34% by 2050 — long-run rental-demand tailwind backs the buy-and-hold thesis.
Negotiation context
- It's been on market 177 days — a 12% lower offer ($273k) is reasonable based on typical stale-listing flexibility.
- Current owner paid $128k; list at $310k implies a 143% gain — meaningful room to come down on a strong offer.
Risks & watch-outs
- Climate carrying-cost: extreme-heat days projected 7→19/yr by 2055 (HVAC capex compounding) — expect insurance premiums to compound above CPI over the hold.
Questions for the listing agent
- What do current leases actually rent for vs. the listed asking? Can we see a recent rent roll and the last 12 months of T-12 income?
- It's been on market 177 days. Have you received any prior offers? Is the seller open to a 26% concession, seller financing, or rate buy-down credit?
- Why hasn't it sold? Are there any deal-killer items the seller is aware of (foundation, flood, title, zoning, code violations)?
- Is there a deadline driving the sale (1031 exchange, divorce, estate, relocation)? That informs how much negotiation room exists.
- Schools are B-rated — typically a magnet for longer-tenancy family renters. What's the average tenant stay here, and is there a school-zone premium baked into asking?
- The area grade is low — what's the realistic commute time and amenity access for the typical tenant pool here? Any planned neighborhood developments (good or bad) we should know about?
- What's the average days-on-market for RENTAL listings here right now (not sales)? A rising rental-DOM trend means longer vacancies and softer asking-rent achievability than the comps imply.
- What's the recent tenant-quality profile in this submarket — average credit score on applications, eviction rate, late-payment / NSF rate, and stable-employment percentage? A property-management company in the area should have these aggregated.
- How much new for-sale + rental construction is in the pipeline within 1–3 miles? Heavy new supply typically softens prices + rents 12–24 months out; constrained supply supports both.
Investment metrics
- 1% rule
- 0.74% ✗
- Cap rate
- 5.47%
- Cash-on-cash
- -2.95%
- DSCR
- 0.87
- GRM
- 11.3
CMA / ARV
- ARV (median comp)
- $415,069
- List price
- $310,000
- Delta
- -25.31%
- Verdict
- UNDERPRICED
- Comps
- 20 within 1.0 mi
Show comp detail 12 sales within ~0.75 mi
| Address | Dist | Beds/Ba | Sqft | Sold | Price | $/sf | Match |
|---|---|---|---|---|---|---|---|
| 2006 Hawthorne Way | 0.33mi | 3/2.0 | 1,723 (-3%) | 3mo | $360,000 | $209 | 76 |
| 308 Ascott Ln | 0.22mi | 3/2.0 | 1,624 (-9%) | 1mo | $390,000 | $240 | 74 |
| 112 Countryside Ct | 0.20mi | 2/2.0 (-1) | 1,647 (-8%) | 7mo | $425,000 | $258 | 67 |
| 507 Huntgate Rd | 0.57mi | 3/2.0 | 1,854 (+4%) | 4mo | $420,000 | $227 | 63 |
| 7038 Surrey Dr | 0.52mi | 4/2.5 (+1) | 1,724 (-3%) | 2mo | $350,000 | $203 | 62 |
| 522 Huntgate Rd | 0.59mi | 4/2.0 (+1) | 1,754 (-2%) | 4mo | $385,000 | $219 | 62 |
| 239 Cedar Mill Ln | 0.55mi | 3/2.0 | 1,944 (+9%) | 4mo | $250,000 | $129 | 56 |
| 7138 Big Woods Dr | 0.70mi | 3/2.5 | 1,892 (+6%) | 2mo | $387,000 | $205 | 53 |
| 204 Captains Quarters | 0.28mi | 4/3.0 (+1) | 1,552 (-13%) | 7mo | $260,000 | $168 | 50 |
| 312 N Briar Rdg | 0.42mi | 3/2.0 | 2,031 (+14%) | 10mo | $360,000 | $177 | 49 |
| 403 Allatoona Ct | 0.59mi | 3/2.0 | 2,028 (+14%) | 4mo | $389,000 | $192 | 46 |
| 2037 Castlemaine Cir | 0.57mi | 3/2.5 | 2,036 (+14%) | 11mo | $465,000 | $228 | 39 |
Match score weights: distance 35% · size 25% · config 20% · recency 20%. Top-matched comps best support the ARV.
Projected returns pro-forma
-3.0% appreciation · 1.14% rent growth · sell at horizon
- IRR
- -23.2%
- Equity multiple
- 0.22×
- Total profit
- $-68,076
- Equity at exit
- $46,222
- IRR
- -23.2%
- Equity multiple
- -0.08×
- Total profit
- $-93,544
- Equity at exit
- $26,803
Cash invested: $86,800 (down + closing). Projections, not guarantees.
Landlord ↔ Tenant lean methodology
- Overall (STATE)
- 90 Strongly Landlord-Friendly
- State Georgia
- 90 Strongly Landlord-Friendly · R+3
- County
- — inherits STATE
- City
- — inherits STATE
ZIP-level market 30189
- Rents YoY
- 1.1%
- Active inventory
- 274
- Price-to-rent
- 11.3×
Monthly cashflow live
- Estimated rent
- $2,280 high interval (Pro) →
- Mortgage (P&I)
- −$1,626
- Tax from tax record
- −$260 /mo · $3,122/yr
- Insurance
- −$129
- HOA
- −$0
- Vacancy / Maint / Mgmt
- −$479
- Net cashflow
- $-214
Break-even live
Sensitivity live
| Price | -10% $-38 | -5% $-126 | +0% $-214 | +5% $-301 | +10% $-389 |
|---|---|---|---|---|---|
| Rent | -10% $-394 | -5% $-304 | +0% $-214 | +5% $-124 | +10% $-34 |
| Rate | -1.0pp $-58 | -0.5pp $-135 | base $-214 | +0.5pp $-294 | +1.0pp $-376 |
UW: 25.0% down · 7.5% · 30yr · 1.5% tax · 5.0% vac · 8.0% maint · 8.0% mgmt
Financing live
Cash to close
- Down payment
- $77,500
- Closing costs
- $9,300
- Reserves months
- —
- Total cash needed
- —
Loan-product check · same deal, 3 products live
Conventional
25% down · 7.5% · 30yr
- Down + closing
- —
- Monthly P&I
- —
- Monthly cashflow
- —
- DSCR
- —
- Eligible?
- —
Personal DTI + credit; lowest rate.
DSCR
20% down · 8.5% · 30yr
- Down + closing
- —
- Monthly P&I
- —
- Monthly cashflow
- —
- DSCR
- —
- Eligible?
- —
No personal income docs; deal must DSCR.
Hard money
10% down · 12.0% · 12mo
- Down + closing
- —
- Monthly P&I
- —
- Monthly cashflow
- —
- DSCR
- —
- Eligible?
- —
Short-term bridge; refi at stabilization.
Rent comps 16 comps
| Address | Beds | Baths | Sqft | Rent | $/sqft | DOM | Units | Dist |
|---|---|---|---|---|---|---|---|---|
| 237 Ascott Ln Woodstock, GA | 4.0 | 2.5 | 2183 | $2,265 | $1.04 | 45d | 1 | 0.07mi |
| 259 Ascott Ln Woodstock, GA | 4.0 | 2.5 | 2102 | $2,250 | $1.07 | 19d | 1 | 0.17mi |
| 208 Pebble Creek Ct Woodstock, GA | 3.0 | 2.5 | 2068 | $2,320 | $1.12 | 45d | 1 | 0.38mi |
| 323 N Briar Rdg Woodstock, GA | 3.0 | 2.0 | 1800 | $2,273 | $1.26 | 26d | 1 | 0.55mi |
| 608 Silver Trace Ct Woodstock, GA | 4.0 | 2.5 | 1984 | $2,545 | $1.28 | 0d | 1 | 0.64mi |
| 163 Sunset Ln Woodstock, GA | 3.0 | 2.5 | 1758 | $2,010 | $1.14 | 45d | 1 | 0.67mi |
| 149 Sunset Ln Woodstock, GA | 3.0 | 2.5 | 1793 | $2,000 | $1.12 | 45d | 1 | 0.67mi |
| 145 Sunset Ln Woodstock, GA | 3.0 | 3.0 | 1776 | $2,070 | $1.17 | 6d | 1 | 0.69mi |
| 467 Colonial Walk Woodstock, GA | 2.0 | 2.5 | 1346 | $2,150 | $1.60 | 0d | 1 | 0.76mi |
| 212 Ridge Valley Dr Woodstock, GA | 3.0 | 2.5 | 1905 | $2,200 | $1.15 | 19d | 1 | 0.87mi |
| 205 Ridge Valley Dr Woodstock, GA | 4.0 | 3.0 | 2343 | $2,495 | $1.06 | 23d | 1 | 0.90mi |
| 205 Ridge Valley Dr Woodstock, GA | 4.0 | 2.5 | 2343 | $2,495 | $1.06 | 45d | 1 | 0.90mi |
| 331 Mirramont Ct Woodstock, GA | 4.0 | 3.0 | 2458 | $2,600 | $1.06 | 45d | 1 | 1.31mi |
| 331 Mirramont Ct Woodstock, GA | 4.0 | 3.0 | 2458 | $2,700 | $1.10 | 26d | 1 | 1.31mi |
| 635 Driftwood Dr Woodstock, GA | 3.0 | 2.0 | 1800 | $2,600 | $1.44 | 14d | 1 | 1.36mi |
| 200 Mirramont St Woodstock, GA | 4.0 | 2.5 | 2480 | $2,226 | $0.90 | 26d | 1 | 1.36mi |
Listing history 9 events
-
2026-06-03days on market $310,000 Active 177 DOM
-
2026-06-02days on market $310,000 Active 176 DOM
-
2026-06-01days on market $310,000 Active 175 DOM
-
2026-05-31days on market $310,000 Active 174 DOM
-
2026-01-23price $310,000 190-char remark
Show marketing remark (190 chars)
Lovely home in a quiet, friendly neighborhood in a fast-growing area of Woodstock. Cozy yet conveniently located, its close to everything you need and situated within great school districts.
-
2026-01-11price $315,000 190-char remark
Show marketing remark (190 chars)
Lovely home in a quiet, friendly neighborhood in a fast-growing area of Woodstock. Cozy yet conveniently located, its close to everything you need and situated within great school districts.
-
2025-12-08$340,000 Active 190-char remark
Show marketing remark (190 chars)
Lovely home in a quiet, friendly neighborhood in a fast-growing area of Woodstock. Cozy yet conveniently located, its close to everything you need and situated within great school districts.
-
2002-07-10soldstatus $127,500
-
1999-07-26soldstatus $110,500
ⓘ Source: listings_history table (triggers on properties + properties_extension) + one-shot
backfill from property_details.listing_events for pre-trigger history.
Tax reassessment forecast GA · Resets to sale price
- Current annual tax
- $3,122 · $260/mo
- Projected year-2 tax
- $3,122 · $260/mo
- Expected delta
- $0/yr ($0/mo · 0.0%)
ⓘ Screening estimate from a state-policy table — verify with the county assessor before closing.
Climate risk First Street
- Flood 1/10 Low FEMA zone X (unshaded) · 0% chance over 30 yrs
- Wildfire 3/10 Moderate
- Heat 5/10 Major 7 d/yr ≥103°F today · 19 d/yr by 30 yrs out
- Wind 4/10 Moderate 16% chance of damaging wind over 30 yrs
- Air quality 4/10 Moderate 6 unhealthy d/yr today · 7 by 30 yrs out
Nearby sold comps map
Loading sold comps map…
Walkable amenities ~0.75 mi
Loading nearby amenities…
Taxation est. · year 1
- Rental income
- $27,362
- − Mortgage interest
- −$17,365
- − Property taxes
- −$3,122
- − Insurance
- −$1,550
- − Repairs & maintenance
- −$2,189
- − Management
- −$2,189
- − Depreciation
- −$9,018
- Taxable loss
- −$8,071
- Est. tax savings @ 24.0%
- +$1,937
- After-tax cash flow
- $-627/yr
For passive investors: Depreciation is non-cash, so a rental often shows a tax loss while cash-flowing — sheltering income. Rental losses are passive: they offset passive income freely, and up to $25,000/yr can offset ordinary (W-2) income if you actively participate and your MAGI is under $100k (phasing out to $0 by $150k); unused losses carry forward. On sale, claimed depreciation is recaptured at up to 25%, and gains may owe capital-gains tax (a 1031 exchange can defer both). Figures are a year-1 estimate at your 24.0% rate — not tax advice; consult a CPA.
Schools (NCES district)
- District
- Cherokee County
- NCES district ID
- 1301110
- Math proficiency
- 46% ▼ -11.00%
- Reading proficiency
- 48% ▼ -8.00%
- Median HH income
- $69,295
- Composite
- 42.14/100
- National rank
- #3304
- State rank
- #17 of 174 in GA
Livability — Woodstock
- Score
- 73/100
- State rank
- #46
- US rank
- #5116
Category grades
Schools grade is shown separately in the Schools card above.
Census & demographics
- County
- Cherokee County · 289,977 people
- City population
- 109,446
- Metro
- Atlanta-Sandy Springs-Alpharetta, GA
- Population (ZIP)
- 39,928
- Household income
- $114,130
- Rent vs Own
- Severe rent burden
- 953.0
Population outlook (Cherokee County) Hauer SSP2
- Today (2025)
- 281,923 people
- By 2030
- 303,845 · +7.8%
- By 2040
- 344,738 · +22.3%
- By 2050
- 379,010 · +34.4%
- By 2075
- 449,617 · +59.5%
- By 2100
- 484,103 · +71.7%
Race, ethnicity, and origin ACS 2023
- Neighborhood character
- Predominantly White (73%)
- Race & ethnicity
- White 73% Hispanic / Latino 14% Two or more races 10% Black 8% Asian 1%
- Hispanic origin (detail)
- Mexican 6% Puerto Rican 1%
- Common ancestry
- Italian 3% Slovak 2% Romanian 2%
- Foreign-born
- 13% · Canada, Jamaica
- Languages at home
- 85% English-only · Spanish 10% Other Indo-European 1% French/Haitian/Cajun 1%
Political lean MEDSL · Cherokee
- 2024 margin
- Solid R (+39.0) · D 30.1% · R 69.1%
- 2008→2024 swing
- +12.1pp toward D · 2008: -51.1pp · 2024: -39.0pp
- All cycles
- 2024: R+39.0 2020: R+39.2 2016: R+50.0 2012: R+57.8 2008: R+51.1
Not yet ingested
- Civics
- —
Market trends
- HPI YoY
- ▼ -247.82%
- Current HPI
- 249.6793
- Rent YoY
- ▲ 1.14%
- Metro
- Atlanta-Sandy Springs-Alpharetta, GA
- State GDP YoY
- ▲ 2.66%
- F500 in state
- 28
Industry mix (Fortune 500 HQ in GA)
| Industry | F500 HQs | Revenue |
|---|---|---|
| Paper / Packaging | 2 | $29B |
|
||
| Retail | 1 | $160B |
|
||
| Transportation / Logistics | 1 | $91B |
|
||
| Airlines | 1 | $62B |
|
||
| Consumer Goods | 1 | $47B |
|
||
| Utilities | 1 | $25B |
|
||
Price history
+180.5% since first listed5 events — show timeline
- 2026-01-23 Price Changed $310,000 ForSaleByOwner.com
- 2026-01-11 Price Changed $315,000 ForSaleByOwner.com
- 2025-12-08 Listed $340,000 ForSaleByOwner.com
- 2002-07-10 Sold (Public Records) $127,500 Public Records
- 1999-07-26 Sold (Public Records) $110,500 Public Records
Property tax history
+4.1%/yrLatest (2025): $3,122 · -2.4% YoY. Source: county tax records.
Cash-flow waterfall
monthlySold comps — $/sqft
last 12 mo · ≤1 miLoading sold comps…