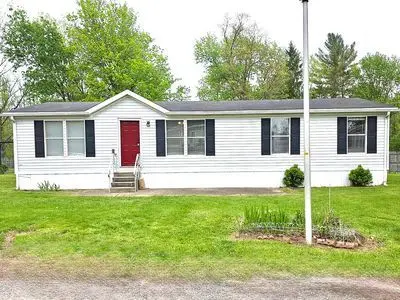
3250 Maysville Pike · South Zanesville, OH
Flood risk No data
- FEMA flood zone
- —
- Chance of flooding over 30 yrs
- —
- Est. flood insurance / yr
- —
Fire risk No data
- Est. fire insurance / yr
- —
Heat risk No data
- Hot days now (above threshold)
- —
- Hot days in 30 yrs
- —
Wind risk No data
- Chance of severe wind over 30 yrs
- —
Air-quality risk No data
- Unhealthy air days now
- —
- Unhealthy air days in 30 yrs
- —
Risk factors via First Street. Map © Google.
Why this score? — see what drove the B grade
The composite is a weighted blend of 9 inputs, each scored 0–100. Each bar is that input's sub-score; the figure is the points it added to the 100-point composite (weight × sub-score).
- Cash flow +30.0/30.0
- 1% rule +10.0/10.0
- DSCR +10.0/10.0
- ARV discount +7.5/15.0
- Schools +4.3/10.0
- Livability +3.8/5.0
- Rent growth +3.6/5.0
- Condition / age +2.5/5.0
- Appreciation +0.0/10.0
$69,900
🖨 Deal sheet (PDF) 📄 Offer letter ✓ Due diligence
Listing remarks MLS
RENOVATED OPEN CONCEPT & MOVE-IN READY 2001 3BD/2BA DOUBLEWIDE 1350 sq ft. $69,900 | Seller Financing Available 3250 Maysville Pike, Lot 13, Zanesville OH | Maysville City Schools Relax on your private patio under the gazebo, enjoy a large yard in a quiet neighborhood, and never worry about errands Walmart, Save-A-Lot, and Dollar General are less than a mile away on Maysville Pike. - Brand new HVAC lower utility bills, no surprise repairs - New LVP flooring throughout easy to clean, built to last - Fresh paint every room - Updated kitchen with white cabinets & new countertops - Spacious master bath with soaking tub, separate shower & vanity area - Outdoor patio & gazebo - Large yard, off-street parking - Maysville City Schools district - Large living room and office areas Priced at $69,900 SELLER FINANCING AVAILABLE payments as low as $743/mo with 20% down! Lot rent: $520/mo + $50/mo sewer No felonies | No evictions within last 3 years Call to schedule a showing. Serious buyers only. 74O. 923.2646 CALL only, do not text.
Key facts
- Fresh paint
- New hvac
- Large yard
Tags
Neighborhood map
What this means for you Summary
Snapshot
- This is a 3-bed/2.0-bath other listed at $70k.
Deal economics
- At list price, monthly cash flow is $635 ($8k/yr) — positive.
- The deal already cash-flows at list — no discount required.
- Meets the 1% rule at list price ($1k rent vs $70k).
- Recommended offer: $68k (3.0% below list) — sets the bar for market timing.
Location & tenants
- Location reads 75/100 on livability (#242 in OH, #3,856 nationally) — a middle-class / working-renter tenant base. Strengths: crime A+, cost of living A+, health & safety A+; Watch: commute F, employment F.
- Maysville Local (town): math 46% / reading 56% proficiency, ranked #435 of 656 in OH (top 66%) — acceptable for families but not a draw, mixed tenant base, ~2y average lease.
- Zoned schools: Maysville Elementary School (math 61% / reading 64%, grade B, #580 of 1,584 statewide, top 37%, 807 students, 0% FRL); Maysville Middle School (math 35% / reading 46%, grade F, #509 of 654 statewide, top 78%, 479 students, 0% FRL); Maysville High School (math 32% / reading 62%, grade D-, #435 of 781 statewide, top 59%, 444 students, 0% FRL) — zoned schools average 0% FRL vs 46% district-wide (46 pts lower); this property's tenant base skews higher-income than the district average.
- Market conditions: Rents rising fast (+4.2%/yr); 300 active listings in the ZIP; 140 units permitted in Muskingum County in 2024 (100 in 5+ unit buildings).
Forward outlook
- Local home prices are declining (-3.0%/yr); year-one equity from $483 of loan paydown is wiped out by about $2k of value loss. Plan a longer hold.
- Muskingum County population projected at -10% by 2050 — secular population decline; favor cash flow + early exit over multi-decade hold.
- At projected returns (-3.0% appreciation + 4.2% rent growth), your $20k cash investment doubles in ~3 years — after that, you're playing with house money.
Negotiation context
- It's been on market 38 days — a 3% lower offer ($68k) is reasonable based on typical stale-listing flexibility.
- 8 sale attempts since 21y ago with the ask held roughly flat each time — persistent listings suggest the price (not the market) is what's stuck; bring a comps-based counter.
- Current owner paid $50k; 40% above their basis — modest negotiation headroom, anchor on the comps not their cost.
Questions for the listing agent
- It's been on market 38 days. Have you received any prior offers? Is the seller open to a 3% concession, seller financing, or rate buy-down credit?
- Is there a deadline driving the sale (1031 exchange, divorce, estate, relocation)? That informs how much negotiation room exists.
- Schools are F-rated, which usually means shorter tenancies and higher turnover. Who's the typical renter profile here, and what's been the actual vacancy rate?
- What's the average days-on-market for RENTAL listings here right now (not sales)? A rising rental-DOM trend means longer vacancies and softer asking-rent achievability than the comps imply.
- What's the recent tenant-quality profile in this submarket — average credit score on applications, eviction rate, late-payment / NSF rate, and stable-employment percentage? A property-management company in the area should have these aggregated.
- How much new for-sale + rental construction is in the pipeline within 1–3 miles? Heavy new supply typically softens prices + rents 12–24 months out; constrained supply supports both.
Investment metrics
- 1% rule
- 2.02% ✓
- Cap rate
- 17.20%
- Cash-on-cash
- 38.94%
- DSCR
- 2.73
- GRM
- 4.1
CMA / ARV
No comps found within radius.
Projected returns pro-forma
-3.0% appreciation · 4.23% rent growth · sell at horizon
- IRR
- 36.5%
- Equity multiple
- 2.58×
- Total profit
- $30,920
- Equity at exit
- $10,422
- IRR
- 43.8%
- Equity multiple
- 5.42×
- Total profit
- $86,560
- Equity at exit
- $6,044
Cash invested: $19,572 (down + closing). Projections, not guarantees.
Landlord ↔ Tenant lean methodology
- Overall (STATE)
- 73 Landlord-Friendly
- State Ohio
- 73 Landlord-Friendly · R+6
- County
- — inherits STATE
- City
- — inherits STATE
ZIP-level market 43701
- Home prices YoY
- -23.2%
- Rents YoY
- 4.2%
- Active inventory
- 300
- Price-to-rent
- 4.1×
Monthly cashflow live
- Estimated rent
- $1,415 medium interval (Pro) →
- Mortgage (P&I)
- −$367
- Tax est. 1.5%
- −$87 /mo · $1,048/yr
- Insurance
- −$29
- HOA
- −$0
- Vacancy / Maint / Mgmt
- −$297
- Net cashflow
- $635
Break-even live
Sensitivity live
| Price | -10% $683 | -5% $659 | +0% $635 | +5% $611 | +10% $587 |
|---|---|---|---|---|---|
| Rent | -10% $523 | -5% $579 | +0% $635 | +5% $691 | +10% $747 |
| Rate | -1.0pp $670 | -0.5pp $653 | base $635 | +0.5pp $617 | +1.0pp $599 |
UW: 25.0% down · 7.5% · 30yr · 1.5% tax · 5.0% vac · 8.0% maint · 8.0% mgmt
Financing live
Cash to close
- Down payment
- $17,475
- Closing costs
- $2,097
- Reserves months
- —
- Total cash needed
- —
Loan-product check · same deal, 3 products live
Conventional
25% down · 7.5% · 30yr
- Down + closing
- —
- Monthly P&I
- —
- Monthly cashflow
- —
- DSCR
- —
- Eligible?
- —
Personal DTI + credit; lowest rate.
DSCR
20% down · 8.5% · 30yr
- Down + closing
- —
- Monthly P&I
- —
- Monthly cashflow
- —
- DSCR
- —
- Eligible?
- —
No personal income docs; deal must DSCR.
Hard money
10% down · 12.0% · 12mo
- Down + closing
- —
- Monthly P&I
- —
- Monthly cashflow
- —
- DSCR
- —
- Eligible?
- —
Short-term bridge; refi at stabilization.
Listing history 27 events
-
2026-06-19days on market $69,900 Active 38 DOM
-
2026-06-18days on market $69,900 Active 37 DOM
-
2026-06-17days on market $69,900 Active 36 DOM
-
2026-06-16days on market $69,900 Active 35 DOM
-
2026-06-15days on market $69,900 Active 34 DOM
-
2026-06-14days on market $69,900 Active 32 DOM
-
2026-06-12days on market $69,900 Active 31 DOM
-
2026-06-09days on market $69,900 Active 28 DOM
-
2026-06-08days on market $69,900 Active 27 DOM
-
2026-06-07days on market $69,900 Active 26 DOM
-
2026-06-02days on market $69,900 Active 21 DOM
-
2026-06-01days on market $69,900 Active 20 DOM
-
2026-05-31days on market $69,900 Active 19 DOM
-
2026-05-30days on market $69,900 Active 18 DOM
-
2026-05-12$69,900 Active 1093-char remark
-
2024-04-15historical
-
2024-03-12$82,000 Active
-
2023-08-21soldstatus $49,900 Closed
-
2023-07-20status Pending
-
2023-07-19$49,900 Active
-
2017-10-30soldstatus $19,500
-
2017-05-14$24,900
-
2017-05-06historical
-
2016-11-06$30,000
-
2005-09-02soldstatus $17,000
-
2005-05-17$22,000
-
1997-03-11soldstatus $192,500
ⓘ Source: listings_history table (triggers on properties + properties_extension) + one-shot
backfill from property_details.listing_events for pre-trigger history.
Nearby sold comps map
Loading sold comps map…
Walkable amenities ~0.75 mi
Loading nearby amenities…
Taxation est. · year 1
- Rental income
- $16,985
- − Mortgage interest
- −$3,915
- − Property taxes
- −$1,048
- − Insurance
- −$350
- − Repairs & maintenance
- −$1,359
- − Management
- −$1,359
- − Depreciation
- −$2,033
- Taxable income
- $6,921
- Est. tax owed @ 24.0%
- −$1,661
- After-tax cash flow
- $5,961/yr
For passive investors: Depreciation is non-cash, so a rental often shows a tax loss while cash-flowing — sheltering income. Rental losses are passive: they offset passive income freely, and up to $25,000/yr can offset ordinary (W-2) income if you actively participate and your MAGI is under $100k (phasing out to $0 by $150k); unused losses carry forward. On sale, claimed depreciation is recaptured at up to 25%, and gains may owe capital-gains tax (a 1031 exchange can defer both). Figures are a year-1 estimate at your 24.0% rate — not tax advice; consult a CPA.
Schools (NCES district)
- District
- Maysville Local
- NCES district ID
- 3904885
- Math proficiency
- 46% ▼ -19.00%
- Reading proficiency
- 56% ▼ -11.00%
- Median HH income
- $40,901
- Composite
- 42.71/100
- National rank
- #3167
- State rank
- #435 of 656 in OH
Livability — South Zanesville
- Score
- 75/100
- State rank
- #242
- US rank
- #3856
Category grades
Schools grade is shown separately in the Schools card above.
Census & demographics
- County
- Muskingum County · 56,402 people
- Metro
- Zanesville, OH
- Population (ZIP)
- 56,402
- Household income
- $57,565
- Rent vs Own
- Severe rent burden
- 1619.0
Population outlook (Muskingum County) Hauer SSP2
- Today (2025)
- 85,625 people
- By 2030
- 84,592 · -1.2%
- By 2040
- 81,288 · -5.1%
- By 2050
- 76,751 · -10.4%
- By 2075
- 64,143 · -25.1%
- By 2100
- 47,598 · -44.4%
Race, ethnicity, and origin ACS 2023
- Neighborhood character
- Predominantly White (88%)
- Race & ethnicity
- White 88% Two or more races 6% Black 4% Hispanic / Latino 2%
- Common ancestry
- Slovak 2% Iranian 1% Italian 1%
- Foreign-born
- 1% · Canada
- Languages at home
- 98% English-only · Spanish 1%
Political lean MEDSL · Muskingum
- 2024 margin
- Solid R (+43.9) · D 27.6% · R 71.6%
- 2008→2024 swing
- -36.7pp toward R · 2008: -7.2pp · 2024: -43.9pp
- All cycles
- 2024: R+43.9 2020: R+39.3 2016: R+35.0 2012: R+7.0 2008: R+7.2
Not yet ingested
- Civics
- —
Market trends
- HPI YoY
- ▼ -90.41%
- Current HPI
- 298.9994
- Rent YoY
- ▲ 4.23%
- Metro
- Zanesville, OH
- State GDP YoY
- ▲ 1.98%
- F500 in state
- 48
Industry mix (Fortune 500 HQ in OH)
| Industry | F500 HQs | Revenue |
|---|---|---|
| Insurance | 3 | $145B |
|
||
| Industrial Machinery | 3 | $49B |
|
||
| Financial Services | 3 | $24B |
|
||
| Consumer Goods | 2 | $93B |
|
||
| Aerospace / Defense | 2 | $47B |
|
||
| Utilities | 2 | $33B |
|
||
Price history
-99.4% since first listed16 events — show timeline
- 2026-06-06 Price Changed $1,249 SHOWMOJO
- 2026-06-04 Listed $69,900 ForSaleByOwner.com
- 2026-05-24 Listed for Rent $1,349 SHOWMOJO
- 2026-05-12 Listed $69,900 FSBO.com
- 2024-04-15 Listing Removed — CBRMLS
- 2024-03-12 Listed $82,000 CBRMLS
- 2023-08-21 Sold (MLS) $49,900 MLSNOW
- 2023-07-20 Pending — MLSNOW
- 2023-07-19 Listed $49,900 MLSNOW
- 2017-10-30 Sold (MLS) $19,500 MLSNOW
- 2017-05-14 Listed $24,900 MLSNOW
- 2017-05-06 Listing Removed — MLSNOW
- 2016-11-06 Listed $30,000 MLSNOW
- 2005-09-02 Sold (MLS) $17,000 MLSNOW
- 2005-05-17 Listed $22,000 MLSNOW
- 1997-03-11 Sold (Public Records) $192,500 Public Records
Property tax history
+6.5%/yrLatest (2025): $3,540 · -18.4% YoY. Source: county tax records.
Cash-flow waterfall
monthlySold comps — $/sqft
last 12 mo · ≤1 miLoading sold comps…