 🌊 Lakefront
14929 Lakeshore · Casey, IL
Flood risk 1/10 · Minimal
- FEMA flood zone
- X (unshaded)
- Chance of flooding over 30 yrs
- 0.0%
- Est. flood insurance / yr
- $507 – $1,088
Fire risk 1/10 · Minimal
- Est. fire insurance / yr
- $804 – $1,492
Heat risk 3/10 · Minor
- Hot days now (above 104°F)
- 7 days/yr
- Hot days in 30 yrs
- 19 days/yr
Wind risk 2/10 · Minimal
- Chance of severe wind over 30 yrs
- 1.0%
Air-quality risk 2/10 · Minimal
- Unhealthy air days now
- 0 days/yr
- Unhealthy air days in 30 yrs
- 1 days/yr
Risk factors via First Street. Map © Google.
Why this score? — see what drove the D grade
The composite is a weighted blend of 9 inputs, each scored 0–100. Each bar is that input's sub-score; the figure is the points it added to the 100-point composite (weight × sub-score).
- Cash flow +11.5/30.0
- ARV discount +7.5/15.0
- Appreciation +6.6/10.0
- DSCR +3.4/10.0
- 1% rule +3.3/10.0
- Livability +3.1/5.0
- Rent growth +2.5/5.0
- Schools +2.2/10.0
- Condition / age +2.2/5.0
$124,900
🖨 Deal sheet (PDF) 📄 Offer letter ✓ Due diligence
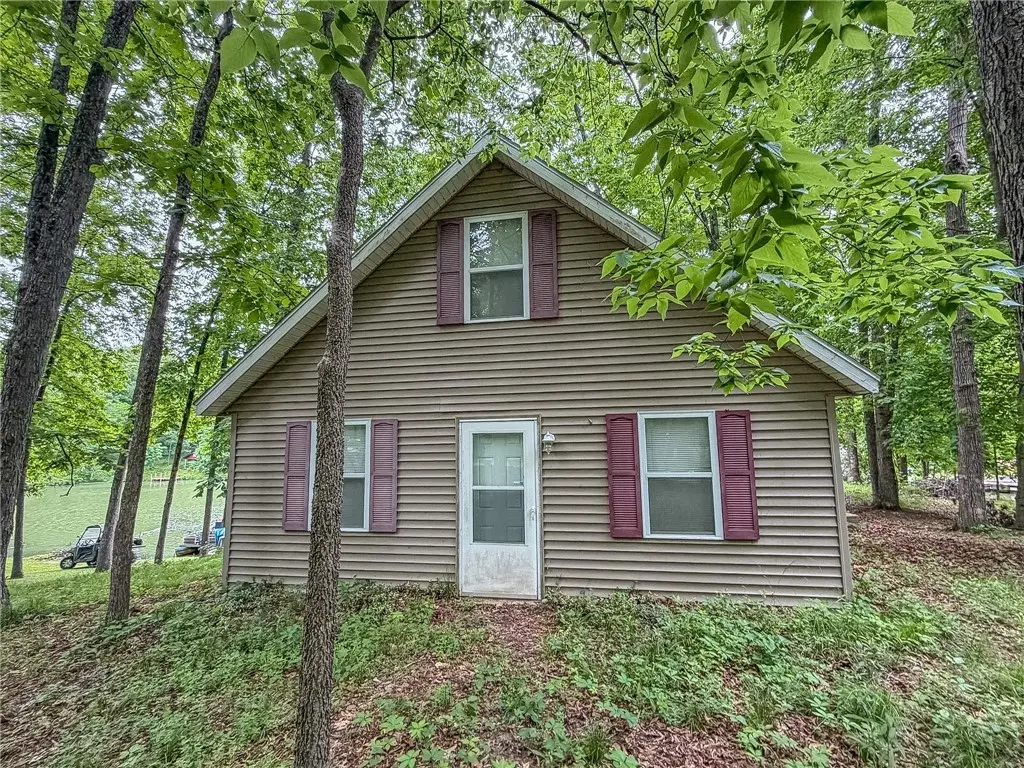
Listing remarks MLS
Escape to your own private retreat with this secluded 3 bedroom lakefront cabin nestled among the trees in Martinsville! Surrounded by nature and offering peaceful water views, this charming getaway is the perfect place to relax and unwind. Inside, you'll find a warm and inviting atmosphere with plenty of rustic character and comfortable living space. This property comes fully furnished, making it truly move-in or vacation-ready. A lawn mower and pedal boat are also included, so you can start enjoying lake life right away! All-electric home with city water for added convenience. Whether you're looking for a weekend escape, full-time residence, or investment opportunity, this hidden gem offers privacy, tranquility, and the perfect lakeside setting!
Key facts
- 0.25 acre lot
- 2 parking spots
- Built 2007
Property features AI
Finance
- HOA & community: No master association fee required
Exterior
- Parking: Gravel owned parking for 2 vehicles
- Utilities: Public water; Holding tank sewer
- Home design: Detached single-family home; One-story with some upper area (upper area listed); Fee simple ownership
- Construction: Vinyl siding; Property age approximately 16–20 years
- Exterior features: Lakefront view; Wooded lot with mature trees; Lot dimensions approximately 64 x 202
Interior
- Kitchen: Range; Microwave; Refrigerator
- Bedrooms: Master bedroom on the main level (carpeted); Second bedroom on the main level (laminate flooring, 9 x 8); Third bedroom on the second level (10 x 12)
- Flooring: Laminate flooring in living areas and kitchen; Carpet in master bedroom
- Bathrooms: One full bathroom
- Heating & cooling: Electric heating; Window air conditioning units
- Interior features: Five total rooms; Living room; Family room; Dining room
- Laundry & utility: Laundry room
Neighborhood map
What this means for you Summary
Snapshot
- This is a 3-bed/1.0-bath single-family listed at $125k. Condition is rated fair.
Deal economics
- At list price, monthly cash flow is $-42 ($-505/yr) — negative.
- To cash-flow at today's rent, offer at most $119k (4.9% below list).
- To meet the 1% rule (rent ≥ 1% of price), the offer needs to be $104k (16.8% below list).
- Recommended offer: $104k (16.8% below list) — sets the bar for 1% rule.
Location & tenants
- Location reads 62/100 on livability (#849 in IL) — a middle-class / working-renter tenant base. Strengths: cost of living A+, housing A+, crime B+; Watch: employment C-, amenities F, commute F.
- Casey-Westfield CUSD 4C (town): math 19% / reading 32% proficiency, ranked #322 of 620 in IL (top 52%) — low school quality limits family demand, transient renter base, plan for 1-2y turnover.
- Zoned schools: Monroe Elem School (math 18% / reading 33%, grade F, #829 of 2,056 statewide, top 41%, 534 students, 0% FRL); Casey-Westfield Jr/Sr Hs (math 22% / reading 32%, grade F, #218 of 693 statewide, top 35%, 365 students, 0% FRL) — zoned schools average 0% FRL vs 43% district-wide (43 pts lower); this property's tenant base skews higher-income than the district average.
- Market conditions: 10 active listings in the ZIP; 1 units permitted in Clark County in 2024 (0 in 5+ unit buildings).
Forward outlook
- In year one you build about $5k of equity ($864 loan paydown + $4k appreciation (3.1% local appreciation)).
- Clark County population projected at -20% by 2050 — secular population decline; favor cash flow + early exit over multi-decade hold.
- At projected returns (3.1% appreciation + 3.0% rent growth), your $35k cash investment doubles in ~7 years — after that, you're playing with house money.
- By year 7, paydown + projected appreciation supports a ~$30k cash-out refi (75% LTV) — recoverable capital for the next deal without selling this one.
Negotiation context
- It's been on market 26 days — a 2% lower offer ($123k) is reasonable based on typical stale-listing flexibility.
- 2 sale attempts with the ask held roughly flat each time — persistent listings suggest the price (not the market) is what's stuck; bring a comps-based counter.
Questions for the listing agent
- What do current leases actually rent for vs. the listed asking? Can we see a recent rent roll and the last 12 months of T-12 income?
- Have any recent inspections been done? Can we get a copy of the seller's disclosures and any deferred-maintenance estimates?
- Is there a deadline driving the sale (1031 exchange, divorce, estate, relocation)? That informs how much negotiation room exists.
- Schools are D-rated, which usually means shorter tenancies and higher turnover. Who's the typical renter profile here, and what's been the actual vacancy rate?
- The area grade is low — what's the realistic commute time and amenity access for the typical tenant pool here? Any planned neighborhood developments (good or bad) we should know about?
- This sits on a lake — are riparian / water-frontage rights deeded with the parcel? Any dock permits, shoreline easements, or HOA water-use restrictions?
- What's the documented flood / surge / shoreline-erosion history here (FEMA AND non-FEMA — e.g., storm surge, creek backup, septic-field saturation)?
- Any water-quality or seasonal algae-bloom issues that affect tenant satisfaction or short-term-rental demand?
- What's the average days-on-market for RENTAL listings here right now (not sales)? A rising rental-DOM trend means longer vacancies and softer asking-rent achievability than the comps imply.
- What's the recent tenant-quality profile in this submarket — average credit score on applications, eviction rate, late-payment / NSF rate, and stable-employment percentage? A property-management company in the area should have these aggregated.
- How much new for-sale + rental construction is in the pipeline within 1–3 miles? Heavy new supply typically softens prices + rents 12–24 months out; constrained supply supports both.
Investment metrics
- 1% rule
- 0.83% ✗
- Cap rate
- 5.89%
- Cash-on-cash
- -1.44%
- DSCR
- 0.94
- GRM
- 10.0
CMA / ARV
No comps found within radius.
Projected returns pro-forma
3.11% appreciation · 3.0% rent growth · sell at horizon
- IRR
- 6.5%
- Equity multiple
- 1.38×
- Total profit
- $13,123
- Equity at exit
- $56,952
- IRR
- 9.3%
- Equity multiple
- 2.42×
- Total profit
- $49,599
- Equity at exit
- $88,389
Cash invested: $34,972 (down + closing). Projections, not guarantees.
Landlord ↔ Tenant lean methodology
- Overall (STATE)
- 43 Moderately Tenant-Leaning
- State Illinois
- 43 Moderately Tenant-Leaning · D+7
- County
- — inherits STATE
- City
- — inherits STATE
ZIP-level market 62442
- Home prices YoY
- 2.9%
- Active inventory
- 10
- Price-to-rent
- 10.0×
Monthly cashflow live
- Estimated rent
- $1,039 medium interval (Pro) →
- Mortgage (P&I)
- −$655
- Tax est. 1.5%
- −$156 /mo · $1,874/yr
- Insurance
- −$52
- HOA
- −$0
- Vacancy / Maint / Mgmt
- −$218
- Net cashflow
- $-42
Break-even live
Sensitivity live
| Price | -10% $44 | -5% $1 | +0% $-42 | +5% $-85 | +10% $-128 |
|---|---|---|---|---|---|
| Rent | -10% $-124 | -5% $-83 | +0% $-42 | +5% $-1 | +10% $40 |
| Rate | -1.0pp $21 | -0.5pp $-10 | base $-42 | +0.5pp $-74 | +1.0pp $-107 |
UW: 25.0% down · 7.5% · 30yr · 1.5% tax · 5.0% vac · 8.0% maint · 8.0% mgmt
Financing live
Cash to close
- Down payment
- $31,225
- Closing costs
- $3,747
- Reserves months
- —
- Total cash needed
- —
Loan-product check · same deal, 3 products live
Conventional
25% down · 7.5% · 30yr
- Down + closing
- —
- Monthly P&I
- —
- Monthly cashflow
- —
- DSCR
- —
- Eligible?
- —
Personal DTI + credit; lowest rate.
DSCR
20% down · 8.5% · 30yr
- Down + closing
- —
- Monthly P&I
- —
- Monthly cashflow
- —
- DSCR
- —
- Eligible?
- —
No personal income docs; deal must DSCR.
Hard money
10% down · 12.0% · 12mo
- Down + closing
- —
- Monthly P&I
- —
- Monthly cashflow
- —
- DSCR
- —
- Eligible?
- —
Short-term bridge; refi at stabilization.
Listing history 16 events
-
2026-06-22days on market $124,900 Active 26 DOM
-
2026-06-21days on market $124,900 Active 25 DOM
-
2026-06-19days on market $124,900 Active 23 DOM
-
2026-06-18days on market $124,900 Active 22 DOM
-
2026-06-17days on market $124,900 Active 21 DOM
-
2026-06-16days on market $124,900 Active 20 DOM
-
2026-06-15days on market $124,900 Active 19 DOM
-
2026-06-14days on market $124,900 Active 17 DOM
-
2026-06-12days on market $124,900 Active 16 DOM
-
2026-06-09days on market $124,900 Active 13 DOM
-
2026-06-08days on market $124,900 Active 12 DOM
-
2026-06-07days on market $124,900 Active 11 DOM
-
2026-06-02days on market $124,900 Active 6 DOM
-
2026-06-01days on market $124,900 Active 5 DOM
-
2026-05-31days on market $124,900 Active 4 DOM
-
2026-05-30days on market $124,900 Active 3 DOM
ⓘ Source: listings_history table (triggers on properties + properties_extension) + one-shot
backfill from property_details.listing_events for pre-trigger history.
Climate risk First Street
- Flood 1/10 Low FEMA zone X (unshaded) · 0% chance over 30 yrs
- Wildfire 1/10 Low
- Heat 3/10 Moderate 7 d/yr ≥104°F today · 19 d/yr by 30 yrs out
- Wind 2/10 Low 100% chance of damaging wind over 30 yrs
- Air quality 2/10 Low 0 unhealthy d/yr today · 1 by 30 yrs out
Nearby sold comps map
Loading sold comps map…
Walkable amenities ~0.75 mi
Loading nearby amenities…
Taxation est. · year 1
- Rental income
- $12,472
- − Mortgage interest
- −$6,996
- − Property taxes
- −$1,874
- − Insurance
- −$624
- − Repairs & maintenance
- −$998
- − Management
- −$998
- − Depreciation
- −$3,633
- Taxable loss
- −$2,652
- Est. tax savings @ 24.0%
- +$636
- After-tax cash flow
- $131/yr
For passive investors: Depreciation is non-cash, so a rental often shows a tax loss while cash-flowing — sheltering income. Rental losses are passive: they offset passive income freely, and up to $25,000/yr can offset ordinary (W-2) income if you actively participate and your MAGI is under $100k (phasing out to $0 by $150k); unused losses carry forward. On sale, claimed depreciation is recaptured at up to 25%, and gains may owe capital-gains tax (a 1031 exchange can defer both). Figures are a year-1 estimate at your 24.0% rate — not tax advice; consult a CPA.
Condition & rehab AI · 13 photos
This lakefront cabin requires moderate renovations, including updating appliances, repainting, and replacing flooring. The property's natural setting and lake views offer significant potential for increased value with these improvements.
Repairs flagged
- Major Kitchen appliances — Outdated and in need of replacement.
- Major Bathtub and fixtures — Dated appearance and potential need for replacement.
- Major Paint — Peeling in some areas, indicating the need for repainting.
- Major Flooring — Worn and may need replacement.
- Major Deck — Appears to be in need of maintenance or replacement.
Value-add opportunities
- Resale Updating the kitchen appliances and fixtures — Modernizing the kitchen will attract more buyers and increase its appeal.
- Resale Repainting the interior walls — Fresh paint will make the interior look more inviting and appealing to potential buyers.
- Resale Replacing the flooring — New flooring will improve the overall look and feel of the home, making it more attractive to potential buyers.
- Both Maintaining and updating the deck — A well-maintained deck can add value to both the resale and rental market.
Renovation cost estimate screening
| Repair item | Severity | Est. cost |
|---|---|---|
| Kitchen appliances · Outdated and in need of replacement. | Major | $15,000–50,000 |
| Bathtub and fixtures · Dated appearance and potential need for replacement. | Major | $15,000–50,000 |
| Paint · Peeling in some areas, indicating the need for repainting. | Major | $15,000–50,000 |
| Flooring · Worn and may need replacement. | Major | $15,000–50,000 |
| Deck · Appears to be in need of maintenance or replacement. | Major | $15,000–50,000 |
| Total estimated repair cost · 5 items | $75,000–250,000 |
Value-add ROI direction
- Resale Updating the kitchen appliances and fixtures — Modernizing the kitchen will attract more buyers and increase its appeal. ↑
- Resale Repainting the interior walls — Fresh paint will make the interior look more inviting and appealing to potential buyers. ↑
- Resale Replacing the flooring — New flooring will improve the overall look and feel of the home, making it more attractive to potential buyers. ↑
- Both Maintaining and updating the deck — A well-maintained deck can add value to both the resale and rental market. ↑
ⓘ Cost ranges are severity-bucket heuristics (US national rule-of-thumb). Get contractor quotes + a written scope before underwriting a rehab budget.
Schools (NCES district)
- District
- Casey-Westfield CUSD 4C
- NCES district ID
- 1700002
- Math proficiency
- 19% ▼ -13.00%
- Reading proficiency
- 32% ▼ -12.00%
- Median HH income
- $45,497
- Composite
- 21.99/100
- National rank
- #8208
- State rank
- #322 of 620 in IL
Livability — Casey
- Score
- 62/100
- State rank
- #849
- US rank
- #16670
Category grades
Schools grade is shown separately in the Schools card above.
Census & demographics
- Population (ZIP)
- 2,629
Population outlook (Clark County) Hauer SSP2
- Today (2025)
- 14,978 people
- By 2030
- 14,380 · -4.0%
- By 2040
- 13,135 · -12.3%
- By 2050
- 11,920 · -20.4%
- By 2075
- 9,254 · -38.2%
- By 2100
- 6,737 · -55.0%
Race, ethnicity, and origin ACS 2023
- Neighborhood character
- Predominantly White (96%)
- Race & ethnicity
- White 96% Two or more races 3%
- Common ancestry
- Lithuanian 1% Iranian 1% Italian 1%
- Foreign-born
- 1%
- Languages at home
- 99% English-only · Other Indo-European 1%
Political lean MEDSL · Clark
- 2024 margin
- Solid R (+51.2) · D 23.5% · R 74.7% · Other 1.8%
- 2008→2024 swing
- -43.2pp toward R · 2008: -8.1pp · 2024: -51.2pp
- All cycles
- 2024: R+51.2 2020: R+50.7 2016: R+47.9 2012: R+32.5 2008: R+8.1
Not yet ingested
- Civics
- —
Market trends
- HPI YoY
- ▲ 3.11%
- Current HPI
- 110.8748
- Rent YoY
- —
- Metro
- —
- State GDP YoY
- ▲ 1.59%
- F500 in state
- 60
Industry mix (Fortune 500 HQ in IL)
| Industry | F500 HQs | Revenue |
|---|---|---|
| Insurance | 4 | $201B |
|
||
| Consumer Goods | 4 | $87B |
|
||
| Industrial Machinery | 3 | $64B |
|
||
| Healthcare | 2 | $55B |
|
||
| Retail / Pharmacy | 1 | $148B |
|
||
| Agriculture / Food | 1 | $86B |
|
||
Price history
+0.0% since first listed2 events — show timeline
- 2026-05-27 Listed $124,900 MRED as Distributed by MLS Grid
- 2026-05-27 Listed $124,900 CIBR
Cash-flow waterfall
monthlySold comps — $/sqft
last 12 mo · ≤1 miLoading sold comps…