 🔨 Auction
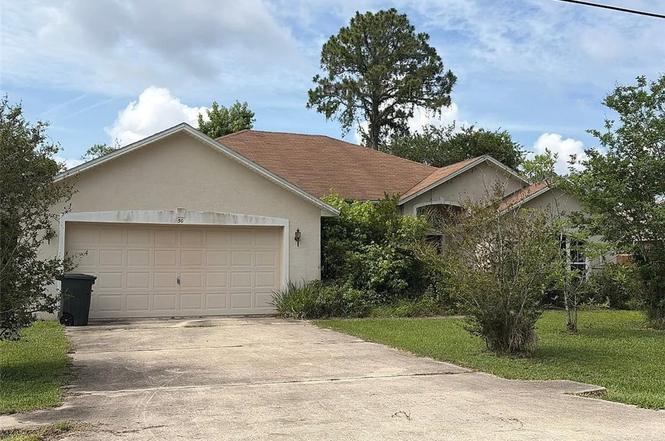
50 Potterville Ln · Palm Coast, FL
Flood risk 1/10 · Minimal
- FEMA flood zone
- X (unshaded)
- Chance of flooding over 30 yrs
- 0.0%
- Est. flood insurance / yr
- $507 – $1,088
Fire risk 4/10 · Minor
- Est. fire insurance / yr
- $947 – $1,759
Heat risk 9/10 · Severe
- Hot days now (above 106°F)
- 7 days/yr
- Hot days in 30 yrs
- 21 days/yr
Wind risk 10/10 · Severe
- Chance of severe wind over 30 yrs
- 99.0%
Air-quality risk 2/10 · Minimal
- Unhealthy air days now
- 2 days/yr
- Unhealthy air days in 30 yrs
- 2 days/yr
Risk factors via First Street. Map © Google.
Why this score? — see what drove the F grade
The composite is a weighted blend of 9 inputs, each scored 0–100. Each bar is that input's sub-score; the figure is the points it added to the 100-point composite (weight × sub-score).
- ARV discount +7.5/15.0
- Schools +4.6/10.0
- Cash flow +4.4/30.0
- Livability +3.5/5.0
- Rent growth +2.8/5.0
- Condition / age +2.5/5.0
- 1% rule +0.4/10.0
- DSCR +0.0/10.0
- Appreciation +0.0/10.0
$5,000
🖨 Deal sheet 📄 Offer letter ✓ Due diligence
Listing remarks
Foreclosure Auction Ends June 26, 2026 at 11:00 AM EST. Explore this charming 3-bedroom, 2-bath residence set in a peaceful and well-located Palm Coast community. The list price is the opening bid for the online auction. Sold As-is. Explore more details and submit your bid through Federa Home App.
Key facts
- 0.23 acre lot
- 2 garage spots
- Built 2001
Property features AI
Finance
- Other: Lot size: 0.23 acres; Zoning: SFR
Exterior
- Parking: Garage (2 spaces)
- Utilities: Other water source; Other sewer
- Home design: Single-family residence; One level; Residential property
- Construction: Construction materials: see remarks
- Exterior features: Front porch; Other roof
Interior
- Bedrooms: 1 total room
- Flooring: Other
- Bathrooms: 2 full bathrooms
- Heating & cooling: No heating specified; No cooling specified
- Interior features: Other flooring
Neighborhood map
What this means for you Summary
Snapshot
- This is a 3-bed/2.0-bath single-family listed at $5k.
Deal economics
- At list price, monthly cash flow is $-1k ($-12k/yr) — negative.
- The deal already cash-flows at list — no discount required.
- Meets the 1% rule at list price ($2k rent vs $5k).
Location & tenants
- Location reads 69/100 on livability (#478 in FL) — a middle-class / working-renter tenant base. Strengths: housing A+, health & safety A+, cost of living B+; Watch: amenities F, commute F.
- Flagler (rural): math 53% / reading 56% proficiency, ranked #20 of 73 in FL (top 27%) — acceptable for families but not a draw, mixed tenant base, ~2y average lease.
- Market conditions: Rents rising (+1.2%/yr); 1367 active listings in the ZIP; 40 comparable units currently listed for rent nearby; rentals at typical pace (median 14d on market — plan ~3-4 weeks tenant-placement turnaround); solid renter incomes; 2,588 units permitted in Flagler County in 2024 (0 in 5+ unit buildings).
- This rent runs 33% of the median local income ($76k/yr) — at the standard rent-burdened threshold; future hikes will face affordability resistance.
Forward outlook
- Local home prices are declining (-3.0%/yr); year-one equity from $3k of loan paydown is wiped out by about $12k of value loss. Plan a longer hold.
- Flagler County population projected at +28% by 2050 — long-run rental-demand tailwind backs the buy-and-hold thesis.
Negotiation context
- Only 1 days on market — expect competitive offers; lowballing is unlikely to land.
Risks & watch-outs
- Watch-outs: property tax is 115.1% of price.
- Climate carrying-cost: severe wind risk, 99% chance of damaging wind over 30y; extreme-heat days projected 7→21/yr by 2055 (HVAC capex compounding) — expect insurance premiums to compound above CPI over the hold.
Questions for the listing agent
- What do current leases actually rent for vs. the listed asking? Can we see a recent rent roll and the last 12 months of T-12 income?
- Property tax is high relative to price — has the assessment been appealed recently, and will the sale trigger a re-assessment?
- Is there a deadline driving the sale (1031 exchange, divorce, estate, relocation)? That informs how much negotiation room exists.
- The area grade is low — what's the realistic commute time and amenity access for the typical tenant pool here? Any planned neighborhood developments (good or bad) we should know about?
- What's the average days-on-market for RENTAL listings here right now (not sales)? A rising rental-DOM trend means longer vacancies and softer asking-rent achievability than the comps imply.
- What's the recent tenant-quality profile in this submarket — average credit score on applications, eviction rate, late-payment / NSF rate, and stable-employment percentage? A property-management company in the area should have these aggregated.
- How much new for-sale + rental construction is in the pipeline within 1–3 miles? Heavy new supply typically softens prices + rents 12–24 months out; constrained supply supports both.
Investment metrics
- 1% rule
- 0.54% ✗
- Cap rate
- 3.14%
- Cash-on-cash
- -11.25%
- DSCR
- 0.50
- GRM
- 15.4
CMA / ARV
- ARV (on-the-fly)
- $383,719
- Comps found
- 12
Show comp detail 12 sales within ~0.75 mi
| Address | Dist | Beds/Ba | Sqft | Sold | Price | $/sf | Match |
|---|---|---|---|---|---|---|---|
| 10 Poinfield Pl | 0.51mi | 3/2.0 | 2,044 (+2%) | 3mo | $439,000 | $215 | 71 |
| 48 Ponce Preserve Dr | 0.39mi | 4/3.0 (+1) | 2,070 (+3%) | 1mo | $391,650 | $189 | 67 |
| 42 Ponce Preserve Dr | 0.40mi | 4/3.0 (+1) | 2,070 (+3%) | 2mo | $417,997 | $202 | 65 |
| 38 Ponce Preserve Dr | 0.42mi | 4/3.0 (+1) | 2,070 (+3%) | 2mo | $421,832 | $204 | 65 |
| 16 Powder Ln | 0.25mi | 4/2.0 (+1) | 1,752 (-13%) | 0mo | $335,000 | $191 | 62 |
| 75 Pheasant Dr | 0.73mi | 3/2.0 | 1,934 (-4%) | 2mo | $432,000 | $223 | 58 |
| 224 Thornberry Way | 0.73mi | 4/2.0 (+1) | 1,950 (-3%) | 3mo | $381,997 | $196 | 54 |
| 66 Postwood Dr | 0.73mi | 4/2.0 (+1) | 2,134 (+6%) | 1mo | $344,990 | $162 | 50 |
| 15 Postman Ln | 0.47mi | 4/2.0 (+1) | 1,728 (-14%) | 0mo | $290,000 | $168 | 50 |
| 41 Post Tree Ln | 0.73mi | 4/2.0 (+1) | 2,134 (+6%) | 2mo | $349,990 | $164 | 49 |
| 36 Raemoor Dr | 0.75mi | 4/3.0 (+1) | 2,117 (+5%) | 1mo | $356,000 | $168 | 46 |
| 77 Pheasant Dr | 0.72mi | 4/2.0 (+1) | 1,801 (-10%) | 0mo | $334,990 | $186 | 44 |
Match score weights: distance 35% · size 25% · config 20% · recency 20%. Top-matched comps best support the ARV.
Projected returns pro-forma
-3.0% appreciation · 1.18% rent growth · sell at horizon
- IRR
- -38.8%
- Equity multiple
- -0.21×
- Total profit
- $-130,068
- Equity at exit
- $57,214
- IRR
- -72.9%
- Equity multiple
- -0.96×
- Total profit
- $-210,580
- Equity at exit
- $33,177
Cash invested: $107,441 (down + closing). Projections, not guarantees.
Landlord ↔ Tenant lean methodology
- Overall (STATE)
- 87 Strongly Landlord-Friendly
- State Florida
- 87 Strongly Landlord-Friendly · R+3
- County
- — inherits STATE
- City
- — inherits STATE
ZIP-level market 32164
- Home prices YoY
- -6.3%
- Rents YoY
- 1.2%
- Active inventory
- 1367
- Price-to-rent
- 0.2×
Monthly cashflow live
- Estimated rent
- $2,081 high interval (Pro) →
- Mortgage (P&I)
- −$2,012
- Tax est. 1.5%
- −$480 /mo · $5,756/yr
- Insurance
- −$160
- HOA
- −$0
- Vacancy / Maint / Mgmt
- −$437
- Net cashflow
- $-1,008
Break-even live
UW: 25.0% down · 7.5% · 30yr · 1.5% tax · 5.0% vac · 8.0% maint · 8.0% mgmt
Financing live
Cash to close
- Down payment
- $95,930
- Closing costs
- $11,512
- Reserves months
- —
- Total cash needed
- —
Loan-product check · same deal, 3 products live
Conventional
25% down · 7.5% · 30yr
- Down + closing
- —
- Monthly P&I
- —
- Monthly cashflow
- —
- DSCR
- —
- Eligible?
- —
Personal DTI + credit; lowest rate.
DSCR
20% down · 8.5% · 30yr
- Down + closing
- —
- Monthly P&I
- —
- Monthly cashflow
- —
- DSCR
- —
- Eligible?
- —
No personal income docs; deal must DSCR.
Hard money
10% down · 12.0% · 12mo
- Down + closing
- —
- Monthly P&I
- —
- Monthly cashflow
- —
- DSCR
- —
- Eligible?
- —
Short-term bridge; refi at stabilization.
Rent comps 40 comps
| Address | Beds | Baths | Sqft | Rent | $/sqft | DOM | Units | Dist |
|---|---|---|---|---|---|---|---|---|
| 65 Raintree Pl Palm Coast, FL | 4.0 | 2.0 | 1706 | $1,600 | $0.94 | 23d | 1 | 0.44mi |
| 22 Pony Ln Unit B Palm Coast, FL | 3.0 | 2.0 | 2168 | $1,850 | $0.85 | 14d | 1 | 0.45mi |
| 15 Postman Ln Palm Coast, FL | 4.0 | 2.0 | 1728 | $1,975 | $1.14 | 2d | 1 | 0.48mi |
| 10 Pontiac Ln Unit B Palm Coast, FL | 4.0 | 2.0 | 1524 | $1,825 | $1.20 | 2d | 1 | 0.53mi |
| 9 Pony Express Dr Palm Coast, FL | 2.0 | 2.0 | 1400 | $1,450 | $1.04 | 23d | 1 | 0.54mi |
| 32 Emerson Dr Palm Coast, FL | 3.0 | 2.0 | 1510 | $2,150 | $1.42 | 2d | 1 | 0.54mi |
| 35 Postman Ln Palm Coast, FL | 3.0 | 2.0 | 1900 | $1,950 | $1.03 | 23d | 1 | 0.61mi |
| 131 Rae Dr Palm Coast, FL | 4.0 | 2.0 | 1738 | $2,150 | $1.24 | 2d | 1 | 0.66mi |
| 15 Raeland Ln Palm Coast, FL | 4.0 | 2.0 | 1891 | $799 | $0.42 | 23d | 1 | 0.74mi |
| 20 Empress Ln Palm Coast, FL | 3.0 | 2.0 | 2256 | $2,100 | $0.93 | 23d | 1 | 0.76mi |
| 41 Raemoor Dr Palm Coast, FL | 4.0 | 3.0 | 1836 | $1,995 | $1.09 | 2d | 1 | 0.76mi |
| 3 Port Ln Palm Coast, FL | 3.0 | 2.0 | 1442 | $1,750 | $1.21 | 2d | 1 | 0.78mi |
| 33 Pinwheel Ln Palm Coast, FL | 3.0 | 2.0 | 1500 | $2,400 | $1.60 | 23d | 1 | 0.80mi |
| 121 Raintree Cir Palm Coast, FL | 3.0 | 2.0 | 1939 | $1,900 | $0.98 | 14d | 1 | 0.84mi |
| 16 Porpoise Ln Palm Coast, FL | 4.0 | 3.0 | 2427 | $2,650 | $1.09 | 2d | 1 | 0.88mi |
| 64 Ramblewood Dr Palm Coast, FL | 3.0 | 2.0 | 2014 | $1,976 | $0.98 | 21d | 1 | 0.90mi |
| 14 Pitt Ln Palm Coast, FL | 3.0 | 2.0 | 1481 | $1,750 | $1.18 | 23d | 1 | 0.92mi |
| 4 Pin Oak Dr Palm Coast, FL | 4.0 | 2.0 | 2236 | $2,200 | $0.98 | 23d | 1 | 0.94mi |
| 26 Pitt Ln Palm Coast, FL | 3.0 | 2.0 | 1502 | $1,995 | $1.33 | 14d | 1 | 0.94mi |
| 5 Pine Haven Dr Palm Coast, FL | 3.0 | 2.0 | 1635 | $1,850 | $1.13 | 14d | 1 | 1.01mi |
| 13 Elder Dr Palm Coast, FL | 3.0 | 3.0 | 2012 | $5,500 | $2.73 | 23d | 1 | 1.01mi |
| 13 Elder Dr Unit 1261619P Palm Coast, FL | 3.0 | 3.0 | 1991 | $5,699 | $2.86 | 11d | 1 | 1.01mi |
| 21 Spring St Palm Coast, FL | 3.0 | 2.0 | 2122 | $2,690 | $1.27 | 23d | 1 | 1.08mi |
| 44 Pinetree Dr Palm Coast, FL | 3.0 | 2.0 | 2357 | $2,000 | $0.85 | 23d | 1 | 1.10mi |
| 38 Pine Hill Ln Palm Coast, FL | 3.0 | 2.0 | 1400 | $1,750 | $1.25 | 14d | 1 | 1.11mi |
| 56 Pine Brook Dr Palm Coast, FL | 3.0 | 2.0 | 1500 | $1,895 | $1.26 | 14d | 1 | 1.16mi |
| 19 Rykill Way Palm Coast, FL | 4.0 | 2.0 | 1806 | $2,066 | $1.14 | 2d | 1 | 1.19mi |
| 38 Pinelynn Dr Palm Coast, FL | 4.0 | 2.0 | 1617 | $1,985 | $1.23 | 23d | 1 | 1.19mi |
| 33 Rybark Ln Palm Coast, FL | 3.0 | 2.0 | 1980 | $1,850 | $0.93 | 23d | 1 | 1.24mi |
| 8 Oriole Rd Palm Coast, FL | 3.0 | 2.0 | 1401 | $2,400 | $1.71 | 14d | 1 | 1.25mi |
| 38 E Diamond Dr Palm Coast, FL | 3.0 | 2.0 | 1551 | $2,800 | $1.81 | 23d | 1 | 1.25mi |
| 176 Pine Grove Dr Palm Coast, FL | 3.0 | 2.0 | 1989 | $2,200 | $1.11 | 23d | 1 | 1.30mi |
| 29 E Diamond Dr Palm Coast, FL | 4.0 | 2.0 | 2217 | $2,500 | $1.13 | 23d | 1 | 1.32mi |
| 9 White Hawk Pl Palm Coast, FL | 3.0 | 2.0 | 1608 | $1,900 | $1.18 | 2d | 1 | 1.32mi |
| 37 Pine Croft Ln Palm Coast, FL | 3.0 | 2.0 | 1832 | $2,100 | $1.15 | 2d | 1 | 1.36mi |
| 57 Pilgrim Dr Palm Coast, FL | 3.0 | 2.0 | 1680 | $2,049 | $1.22 | 2d | 1 | 1.38mi |
| 192 Pine Grove Dr Palm Coast, FL | 3.0 | 2.0 | 1928 | $2,300 | $1.19 | 21d | 1 | 1.40mi |
| 17 Eastgate Ln Palm Coast, FL | 3.0 | 2.0 | 1757 | $1,800 | $1.02 | 2d | 1 | 1.43mi |
| 13 Pilgrim Dr Palm Coast, FL | 4.0 | 2.0 | 1617 | $2,060 | $1.27 | 21d | 1 | 1.44mi |
| 11 Ripcord Ln Palm Coast, FL | 3.0 | 2.0 | 1500 | $1,925 | $1.28 | 2d | 1 | 1.47mi |
Listing history 2 events
-
2026-06-17remarks 298-char remark
-
2026-06-17$5,000 Active 1 DOM
ⓘ Source: listings_history table (triggers on properties + properties_extension) + one-shot
backfill from property_details.listing_events for pre-trigger history.
Climate risk First Street
- Flood 1/10 Low FEMA zone X (unshaded) · 0% chance over 30 yrs
- Wildfire 4/10 Moderate
- Heat 9/10 Extreme 7 d/yr ≥106°F today · 21 d/yr by 30 yrs out
- Wind 10/10 Extreme 99% chance of damaging wind over 30 yrs
- Air quality 2/10 Low 2 unhealthy d/yr today · 2 by 30 yrs out
Nearby sold comps map
Loading sold comps map…
Walkable amenities ~0.75 mi
Loading nearby amenities…
Taxation est. · year 1
- Rental income
- $24,975
- − Mortgage interest
- −$21,494
- − Property taxes
- −$5,756
- − Insurance
- −$1,919
- − Repairs & maintenance
- −$1,998
- − Management
- −$1,998
- − Depreciation
- −$11,163
- Taxable loss
- −$19,353
- Est. tax savings @ 24.0%
- +$4,645
- After-tax cash flow
- $-7,447/yr
For passive investors: Depreciation is non-cash, so a rental often shows a tax loss while cash-flowing — sheltering income. Rental losses are passive: they offset passive income freely, and up to $25,000/yr can offset ordinary (W-2) income if you actively participate and your MAGI is under $100k (phasing out to $0 by $150k); unused losses carry forward. On sale, claimed depreciation is recaptured at up to 25%, and gains may owe capital-gains tax (a 1031 exchange can defer both). Figures are a year-1 estimate at your 24.0% rate — not tax advice; consult a CPA.
Schools (NCES district)
- District
- Flagler
- NCES district ID
- 1200540
- Math proficiency
- 53% ▼ -9.00%
- Reading proficiency
- 56% ▼ -4.00%
- Median HH income
- $48,354
- Composite
- 46.35/100
- National rank
- #2464
- State rank
- #20 of 73 in FL
Livability — Palm Coast
- Score
- 69/100
- State rank
- #478
- US rank
- #8721
Category grades
Schools grade is shown separately in the Schools card above.
Census & demographics
- Census place
- Palm Coast, FL
- County
- Flagler County · 113,412 people
- City population
- 105,049
- Metro
- Deltona-Daytona Beach-Ormond Beach, FL
- Population (ZIP)
- 56,658
- Household income
- $76,399
- Rent vs Own
- Severe rent burden
- 1291.0
Population outlook (Flagler County) Hauer SSP2
- Today (2025)
- 123,474 people
- By 2030
- 131,864 · +6.8%
- By 2040
- 146,176 · +18.4%
- By 2050
- 157,398 · +27.5%
- By 2075
- 177,990 · +44.2%
- By 2100
- 183,381 · +48.5%
Race, ethnicity, and origin ACS 2023
- Neighborhood character
- Predominantly White (65%)
- Race & ethnicity
- White 65% Hispanic / Latino 14% Black 13% Two or more races 8% Asian 2%
- Hispanic origin (detail)
- Mexican 4% Puerto Rican 4% Cuban 2%
- Common ancestry
- Romanian 3% Russian 2% Slovak 2%
- Foreign-born
- 16% · Canada, Jamaica
- Languages at home
- 81% English-only · Spanish 9% Russian/Polish/Slavic 3% Other Indo-European 3%
Political lean MEDSL · Flagler
- 2024 margin
- Strong R (+28.2) · D 35.6% · R 63.8%
- 2008→2024 swing
- -29.8pp toward R · 2008: 1.6pp · 2024: -28.2pp
- All cycles
- 2024: R+28.2 2020: R+20.8 2016: R+20.6 2012: R+7.4 2008: D+1.6
Not yet ingested
- Civics
- —
Market trends
- HPI YoY
- ▼ -19.89%
- Current HPI
- 297.4942
- Rent YoY
- ▲ 1.18%
- Metro
- Deltona-Daytona Beach-Ormond Beach, FL
- State GDP YoY
- ▲ 3.28%
- F500 in state
- 36
Industry mix (Fortune 500 HQ in FL)
| Industry | F500 HQs | Revenue |
|---|---|---|
| Industrial Technology | 2 | $29B |
|
||
| Insurance | 2 | $17B |
|
||
| Retail | 1 | $60B |
|
||
| Technology Distribution | 1 | $58B |
|
||
| Homebuilding | 1 | $35B |
|
||
| Technology Manufacturing | 1 | $35B |
|
||
Price history
1 event — show timeline
- 2026-06-17 Listed $5,000 HAOR as distributed by MLS GRID
Property tax history
+5.3%/yrLatest (2025): $2,536 · +50.1% YoY. Source: county tax records.
Cash-flow waterfall
monthlySold comps — $/sqft
last 12 mo · ≤1 miLoading sold comps…