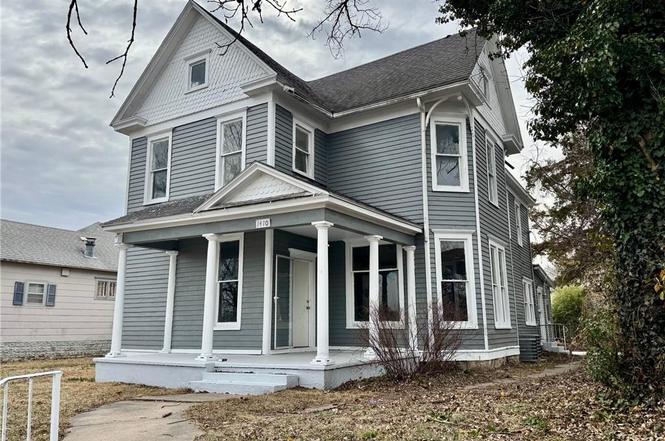
1410 Broadway Ave · Parsons, KS
Flood risk 1/10 · Minimal
- FEMA flood zone
- X (unshaded)
- Chance of flooding over 30 yrs
- 0.0%
- Est. flood insurance / yr
- $507 – $1,088
Fire risk 4/10 · Minor
- Est. fire insurance / yr
- $1,154 – $2,142
Heat risk 5/10 · Moderate
- Hot days now (above 108°F)
- 7 days/yr
- Hot days in 30 yrs
- 19 days/yr
Wind risk 2/10 · Minimal
- Chance of severe wind over 30 yrs
- 2.0%
Air-quality risk 2/10 · Minimal
- Unhealthy air days now
- 1 days/yr
- Unhealthy air days in 30 yrs
- 1 days/yr
Risk factors via First Street. Map © Google.
Why this score? — see what drove the B- grade
The composite is a weighted blend of 9 inputs, each scored 0–100. Each bar is that input's sub-score; the figure is the points it added to the 100-point composite (weight × sub-score).
- Cash flow +30.0/30.0
- DSCR +10.0/10.0
- 1% rule +8.7/10.0
- ARV discount +7.5/15.0
- Livability +3.5/5.0
- Rent growth +2.5/5.0
- Condition / age +2.5/5.0
- Schools +2.0/10.0
- Appreciation +0.0/10.0
$73,300
🖨 Deal sheet (PDF) 📄 Offer letter ✓ Due diligence
Listing remarks MLS
Remodeled large family home, close to the college in the middle of town.
Key facts
- New carpet
- New flooring
- Updated kitchen
Tags
Property features AI
Finance
- Other: Lot approximately 7,200 square feet (60 x 120); Not located in a flood plain; Located inside city limits
- HOA & community: No association fee
Exterior
- Parking: Off-street parking
- Utilities: Public water; Public sewer
- Home design: Single-family residence; Residential property; 2-story floor plan; Property faces north
- Construction: Wood siding exterior; Composition roof; Approximately 101+ years old (age description); Appraiser source for finished area
- Exterior features: Paved road access; Public maintenance for roadway
Interior
- Bedrooms: 5 bedrooms
- Bathrooms: 2 full bathrooms
- Heating & cooling: Natural gas heating; Electric cooling (has cooling)
- Interior features: Ceiling track for accessibility; Crawl space basement
- Laundry & utility: Main-level laundry
Neighborhood map
What this means for you Summary
Snapshot
- This is a 2-bed/2.0-bath single-family listed at $73k.
Deal economics
- At list price, monthly cash flow is $289 ($3k/yr) — positive.
- The deal already cash-flows at list — no discount required.
- Meets the 1% rule at list price ($1k rent vs $73k).
- Recommended offer: $67k (9.0% below list) — sets the bar for market timing.
- Cap rate 11.0% vs local median 5.0% in Parsons — top-decile yield for the area; either an underpriced asset or a hidden risk that comps aren't pricing in. Stress-test before assuming the spread holds.
Location & tenants
- Location reads 70/100 on livability (#164 in KS) — a middle-class / working-renter tenant base. Strengths: cost of living A+, housing A+, health & safety A+; Watch: employment D, crime F, commute F.
- Parsons (town): math 21% / reading 28% proficiency, ranked #143 of 169 in KS (top 85%) — low school quality limits family demand, transient renter base, plan for 1-2y turnover.
- Zoned schools: Lincoln School (283 students, 78% FRL); Parsons Middle School (math 18% / reading 23%, grade F, #144 of 219 statewide, top 66%, 295 students, 84% FRL); Parsons Sr High (math 12% / reading 17%, grade F, #267 of 327 statewide, top 84%, 394 students, 68% FRL) — zoned schools average 77% FRL vs 60% district-wide (17 pts higher); higher-poverty schools than district average — tighter screening recommended.
- Market conditions: 45 active listings in the ZIP; 1 units permitted in Labette County in 2024 (0 in 5+ unit buildings).
Forward outlook
- Local home prices are declining (-3.0%/yr); year-one equity from $507 of loan paydown is wiped out by about $2k of value loss. Plan a longer hold.
- Labette County population projected at -24% by 2050 — secular population decline; favor cash flow + early exit over multi-decade hold.
- At projected returns (-3.0% appreciation + 3.0% rent growth), your $21k cash investment doubles in ~8 years — after that, you're playing with house money.
Negotiation context
- It's been on market 114 days — a 9% lower offer ($67k) is reasonable based on typical stale-listing flexibility.
- 2 sale attempts; this cycle's ask has dropped $46k (38%) from the opening price — seller is motivated, your offer sets the floor, not the list.
- Current owner paid $20k; list at $73k implies a 266% gain — meaningful room to come down on a strong offer.
Risks & watch-outs
- Watch-outs: built in 1890 — expect roof / HVAC / electrical / plumbing capex.
- Climate carrying-cost: extreme-heat days projected 7→19/yr by 2055 (HVAC capex compounding) — expect insurance premiums to compound above CPI over the hold.
Questions for the listing agent
- It's been on market 114 days. Have you received any prior offers? Is the seller open to a 9% concession, seller financing, or rate buy-down credit?
- Built in 1890 — when were the roof, HVAC, electrical panel, plumbing, and water heater last replaced?
- Why hasn't it sold? Are there any deal-killer items the seller is aware of (foundation, flood, title, zoning, code violations)?
- Is there a deadline driving the sale (1031 exchange, divorce, estate, relocation)? That informs how much negotiation room exists.
- Schools are F-rated, which usually means shorter tenancies and higher turnover. Who's the typical renter profile here, and what's been the actual vacancy rate?
- Crime grade is F in this area — have there been break-ins, vandalism, or insurance claims at this property in the last 3 years? What carrier currently insures it and at what premium?
- What's the average days-on-market for RENTAL listings here right now (not sales)? A rising rental-DOM trend means longer vacancies and softer asking-rent achievability than the comps imply.
- What's the recent tenant-quality profile in this submarket — average credit score on applications, eviction rate, late-payment / NSF rate, and stable-employment percentage? A property-management company in the area should have these aggregated.
- How much new for-sale + rental construction is in the pipeline within 1–3 miles? Heavy new supply typically softens prices + rents 12–24 months out; constrained supply supports both.
Investment metrics
- 1% rule
- 1.37% ✓
- Cap rate
- 11.02%
- Cash-on-cash
- 16.89%
- DSCR
- 1.75
- GRM
- 6.1
CMA / ARV
- ARV (on-the-fly)
- $176,715
- Comps found
- 1
Show comp detail 1 sale within ~0.75 mi
| Address | Dist | Beds/Ba | Sqft | Sold | Price | $/sf | Match |
|---|---|---|---|---|---|---|---|
| 2212 Washington Ave | 0.74mi | 3/2.5 (+1) | 2,677 (-5%) | 22mo | $169,000 | $63 | 33 |
Match score weights: distance 35% · size 25% · config 20% · recency 20%. Top-matched comps best support the ARV.
Projected returns pro-forma
-3.0% appreciation · 3.0% rent growth · sell at horizon
- IRR
- 8.1%
- Equity multiple
- 1.32×
- Total profit
- $6,541
- Equity at exit
- $10,929
- IRR
- 17.4%
- Equity multiple
- 2.44×
- Total profit
- $29,454
- Equity at exit
- $6,338
Cash invested: $20,524 (down + closing). Projections, not guarantees.
Landlord ↔ Tenant lean methodology
- Overall (STATE)
- 83 Strongly Landlord-Friendly
- State Kansas
- 83 Strongly Landlord-Friendly · R+10
- County
- — inherits STATE
- City
- — inherits STATE
ZIP-level market 67357
- Home prices YoY
- -20.4%
- Active inventory
- 45
- Price-to-rent
- 6.1×
Monthly cashflow live
- Estimated rent
- $1,007 medium interval (Pro) →
- Mortgage (P&I)
- −$384
- Tax est. 1.5%
- −$92 /mo · $1,100/yr
- Insurance
- −$31
- HOA
- −$0
- Vacancy / Maint / Mgmt
- −$211
- Net cashflow
- $289
Break-even live
Sensitivity live
| Price | -10% $340 | -5% $314 | +0% $289 | +5% $264 | +10% $238 |
|---|---|---|---|---|---|
| Rent | -10% $209 | -5% $249 | +0% $289 | +5% $329 | +10% $368 |
| Rate | -1.0pp $326 | -0.5pp $308 | base $289 | +0.5pp $270 | +1.0pp $251 |
UW: 25.0% down · 7.5% · 30yr · 1.5% tax · 5.0% vac · 8.0% maint · 8.0% mgmt
Financing live
Cash to close
- Down payment
- $18,325
- Closing costs
- $2,199
- Reserves months
- —
- Total cash needed
- —
Loan-product check · same deal, 3 products live
Conventional
25% down · 7.5% · 30yr
- Down + closing
- —
- Monthly P&I
- —
- Monthly cashflow
- —
- DSCR
- —
- Eligible?
- —
Personal DTI + credit; lowest rate.
DSCR
20% down · 8.5% · 30yr
- Down + closing
- —
- Monthly P&I
- —
- Monthly cashflow
- —
- DSCR
- —
- Eligible?
- —
No personal income docs; deal must DSCR.
Hard money
10% down · 12.0% · 12mo
- Down + closing
- —
- Monthly P&I
- —
- Monthly cashflow
- —
- DSCR
- —
- Eligible?
- —
Short-term bridge; refi at stabilization.
Listing history 23 events
-
2026-06-21statusdays on market $73,300 Pending 114 DOM
-
2026-06-18days on market $73,300 Active 113 DOM
-
2026-06-17days on market $73,300 Active 112 DOM
-
2026-06-16days on market $73,300 Active 111 DOM
-
2026-06-15days on market $73,300 Active 110 DOM
-
2026-06-13days on market $73,300 Active 108 DOM
-
2026-06-12days on market $73,300 Active 107 DOM
-
2026-06-09days on market $73,300 Active 104 DOM
-
2026-06-08days on market $73,300 Active 103 DOM
-
2026-06-07days on market $73,300 Active 102 DOM
-
2026-06-05pricedays on market $73,300 Active 100 DOM
-
2026-06-04days on market $88,400 Active 98 DOM
-
2026-06-02days on market $88,400 Active 97 DOM
-
2026-06-01days on market $88,400 Active 96 DOM
-
2026-05-31days on market $88,400 Active 95 DOM
-
2026-05-31days on market $88,400 Active 94 DOM
-
2026-04-29price $88,400
-
2026-03-13price $109,900
-
2026-02-25$119,000 Active
-
2026-01-21$120,000 Active 72-char remark
Show marketing remark (72 chars)
Remodeled large family home, close to the college in the middle of town.
-
1998-01-01soldstatus $20,000
-
1993-12-01soldstatus $37,500
-
1989-11-01soldstatus $22,500
ⓘ Source: listings_history table (triggers on properties + properties_extension) + one-shot
backfill from property_details.listing_events for pre-trigger history.
Climate risk First Street
- Flood 1/10 Low FEMA zone X (unshaded) · 0% chance over 30 yrs
- Wildfire 4/10 Moderate
- Heat 5/10 Major 7 d/yr ≥108°F today · 19 d/yr by 30 yrs out
- Wind 2/10 Low 2% chance of damaging wind over 30 yrs
- Air quality 2/10 Low 1 unhealthy d/yr today · 1 by 30 yrs out
Nearby sold comps map
Loading sold comps map…
Walkable amenities ~0.75 mi
Loading nearby amenities…
Taxation est. · year 1
- Rental income
- $12,084
- − Mortgage interest
- −$4,106
- − Property taxes
- −$1,100
- − Insurance
- −$366
- − Repairs & maintenance
- −$967
- − Management
- −$967
- − Depreciation
- −$2,132
- Taxable income
- $2,446
- Est. tax owed @ 24.0%
- −$587
- After-tax cash flow
- $2,880/yr
For passive investors: Depreciation is non-cash, so a rental often shows a tax loss while cash-flowing — sheltering income. Rental losses are passive: they offset passive income freely, and up to $25,000/yr can offset ordinary (W-2) income if you actively participate and your MAGI is under $100k (phasing out to $0 by $150k); unused losses carry forward. On sale, claimed depreciation is recaptured at up to 25%, and gains may owe capital-gains tax (a 1031 exchange can defer both). Figures are a year-1 estimate at your 24.0% rate — not tax advice; consult a CPA.
Schools (NCES district)
- District
- Parsons
- NCES district ID
- 2010560
- Math proficiency
- 21% ▼ -7.00%
- Reading proficiency
- 28% ▼ -3.00%
- Median HH income
- $37,868
- Composite
- 20.46/100
- National rank
- #8576
- State rank
- #143 of 169 in KS
Livability — Parsons
- Score
- 70/100
- State rank
- #164
- US rank
- #7726
Category grades
Schools grade is shown separately in the Schools card above.
Census & demographics
- Census place
- Parsons, KS
- City population
- 11,786
- Population (ZIP)
- 11,786
Population outlook (Labette County) Hauer SSP2
- Today (2025)
- 19,413 people
- By 2030
- 18,552 · -4.4%
- By 2040
- 16,701 · -14.0%
- By 2050
- 14,832 · -23.6%
- By 2075
- 11,046 · -43.1%
- By 2100
- 8,020 · -58.7%
Race, ethnicity, and origin ACS 2023
- Neighborhood character
- Predominantly White (81%)
- Race & ethnicity
- White 81% Two or more races 7% Hispanic / Latino 7% Black 5%
- Hispanic origin (detail)
- Mexican 5% Puerto Rican 1%
- Common ancestry
- Slovak 2% Lithuanian 2% Italian 1%
- Foreign-born
- 0%
- Languages at home
- 98% English-only · Spanish 1% German/W. Germanic 1%
Political lean MEDSL · Labette
- 2024 margin
- Solid R (+38.2) · D 30.1% · R 68.3% · Other 1.6%
- 2008→2024 swing
- -25.3pp toward R · 2008: -12.9pp · 2024: -38.2pp
- All cycles
- 2024: R+38.2 2020: R+36.0 2016: R+37.9 2012: R+20.2 2008: R+12.9
Not yet ingested
- Civics
- —
Market trends
- HPI YoY
- ▼ -37.97%
- Current HPI
- 147.8259
- Rent YoY
- —
- Metro
- —
- State GDP YoY
- —
- F500 in state
- 0
Price history
+292.9% since first listed7 events — show timeline
- 2026-04-29 Price Changed $88,400 Heartland MLS as Distributed by MLS Grid
- 2026-03-13 Price Changed $109,900 Heartland MLS as Distributed by MLS Grid
- 2026-02-25 Listed $119,000 Heartland MLS as Distributed by MLS Grid
- 2026-01-21 Listed $120,000 ForSaleByOwner.com
- 1998-01-01 Sold (Public Records) $20,000 Public Records
- 1993-12-01 Sold (Public Records) $37,500 Public Records
- 1989-11-01 Sold (Public Records) $22,500 Public Records
Cash-flow waterfall
monthlySold comps — $/sqft
last 12 mo · ≤1 miLoading sold comps…