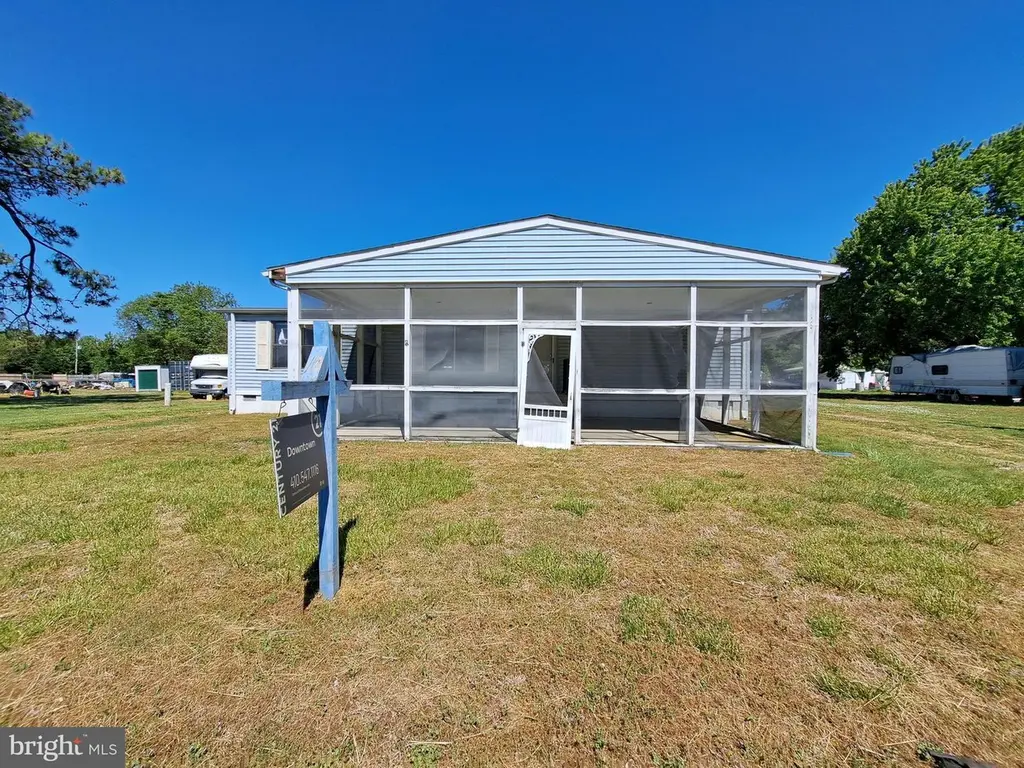
6706 Whiteley Rd · Hurlock, MD
Flood risk 1/10 · Minimal
- FEMA flood zone
- X (unshaded)
- Chance of flooding over 30 yrs
- 0.0%
- Est. flood insurance / yr
- $507 – $1,088
Fire risk 2/10 · Minimal
- Est. fire insurance / yr
- $755 – $1,403
Heat risk 8/10 · Major
- Hot days now (above 105°F)
- 7 days/yr
- Hot days in 30 yrs
- 16 days/yr
Wind risk 6/10 · Moderate
- Chance of severe wind over 30 yrs
- 67.0%
Air-quality risk 2/10 · Minimal
- Unhealthy air days now
- 1 days/yr
- Unhealthy air days in 30 yrs
- 2 days/yr
Risk factors via First Street. Map © Google.
Why this score? — see what drove the B grade
The composite is a weighted blend of 9 inputs, each scored 0–100. Each bar is that input's sub-score; the figure is the points it added to the 100-point composite (weight × sub-score).
- Cash flow +24.5/30.0
- ARV discount +15.0/15.0
- Appreciation +10.0/10.0
- DSCR +7.9/10.0
- 1% rule +5.6/10.0
- Livability +3.1/5.0
- Rent growth +2.5/5.0
- Condition / age +2.5/5.0
- Schools +1.5/10.0
$189,900
🖨 Deal sheet 📄 Offer letter ✓ Due diligence
Listing remarks
Welcome to this ranch-style home, nestled in the serene Hurlock community. With 1,344 square feet of thoughtfully designed living space, this residence features three spacious bedrooms and two full bathrooms with tub shower, ensuring ample room for relaxation and privacy. Venture inside to discover a warm and inviting atmosphere showing a spacious living room that opens to a combined kitchen and dining area that encourages gatherings and shared meals. Natural light pours in through well-placed windows, enhancing the cozy ambiance throughout the home. The screened porch invites you to unwind while enjoying the gentle breeze and views of the expansive half-acre lot, perfect for outdoor activi
Key facts
- Half-acre lot
- Ranch-style home
- Screened porch
Tags
Property features AI
Exterior
- Parking: Circular driveway; Off-street parking
- Utilities: Well water; Septic system; Electric hot water; Electric cooling; Oil heating
- Home design: Detached single-family home; Single-story living (primary rooms on main level)
- Construction: Vinyl siding; Crawl space foundation; Above- and below-grade structures noted; Estimated year built
- Exterior features: Screened outdoor living area (porch/patio); No tidal water on the property
Interior
- Kitchen: Kitchen integrated with dining area
- Bedrooms: Three bedrooms on the main level
- Flooring: Wood floors; Carpet
- Bathrooms: Two full bathrooms (both on the main level)
- Heating & cooling: Forced air heating (oil-fired); Central air conditioning (electric)
- Interior features: Open floor plan; Combination kitchen and dining area; Tub with shower; Ceiling fans; Carpeted areas; Wood floors; Drywall, paneled and plaster walls
Neighborhood map
What this means for you Summary
Snapshot
- This is a 3-bed/2.0-bath manufactured listed at $190k.
Deal economics
- At list price, monthly cash flow is $391 ($5k/yr) — positive.
- The deal already cash-flows at list — no discount required.
- Meets the 1% rule at list price ($2k rent vs $190k).
- Recommended offer: $184k (3.0% below list) — sets the bar for market timing.
- Cap rate 8.8% vs local median 4.7% in Hurlock — top-decile yield for the area; either an underpriced asset or a hidden risk that comps aren't pricing in. Stress-test before assuming the spread holds.
Location & tenants
- Location reads 61/100 on livability (#332 in MD) — a middle-class / working-renter tenant base. Strengths: cost of living A+, housing A+, crime B+; Watch: employment D+, schools F, amenities F.
- Dorchester County Public Schools (rural): math 10% / reading 23% proficiency, ranked #23 of 24 in MD (top 96%) — low school quality limits family demand, transient renter base, plan for 1-2y turnover.
- Market conditions: 34 active listings in the ZIP; 81 units permitted in Dorchester County in 2024 (0 in 5+ unit buildings).
Forward outlook
- In year one you build about $20k of equity ($1k loan paydown + $19k appreciation (10.0% local appreciation)).
- Dorchester County population projected to shrink 10% by 2050 — rents likely to lag national; underwrite the cash flow, not the appreciation.
- At projected returns (10.0% appreciation + 3.0% rent growth), your $53k cash investment doubles in ~3 years — after that, you're playing with house money.
- By year 2, paydown + projected appreciation supports a ~$33k cash-out refi (75% LTV) — recoverable capital for the next deal without selling this one.
Negotiation context
- It's been on market 48 days — a 3% lower offer ($184k) is reasonable based on typical stale-listing flexibility.
- 6 sale attempts since 29y ago with the ask held roughly flat each time — persistent listings suggest the price (not the market) is what's stuck; bring a comps-based counter.
- Current owner paid $25k; list at $190k implies a 660% gain — meaningful room to come down on a strong offer.
Risks & watch-outs
- Climate carrying-cost: major wind risk, 67% chance of damaging wind over 30y; extreme-heat days projected 7→16/yr by 2055 (HVAC capex compounding) — expect insurance premiums to compound above CPI over the hold.
Questions for the listing agent
- It's been on market 48 days. Have you received any prior offers? Is the seller open to a 3% concession, seller financing, or rate buy-down credit?
- Is there a deadline driving the sale (1031 exchange, divorce, estate, relocation)? That informs how much negotiation room exists.
- Schools are F-rated, which usually means shorter tenancies and higher turnover. Who's the typical renter profile here, and what's been the actual vacancy rate?
- What's the average days-on-market for RENTAL listings here right now (not sales)? A rising rental-DOM trend means longer vacancies and softer asking-rent achievability than the comps imply.
- What's the recent tenant-quality profile in this submarket — average credit score on applications, eviction rate, late-payment / NSF rate, and stable-employment percentage? A property-management company in the area should have these aggregated.
- How much new for-sale + rental construction is in the pipeline within 1–3 miles? Heavy new supply typically softens prices + rents 12–24 months out; constrained supply supports both.
Investment metrics
- 1% rule
- 1.06% ✓
- Cap rate
- 8.76%
- Cash-on-cash
- 8.82%
- DSCR
- 1.39
- GRM
- 7.9
CMA / ARV
- ARV (median comp)
- $255,461
- List price
- $189,900
- Delta
- -25.66%
- Verdict
- UNDERPRICED
- Comps
- 9 within 2.0 mi
Projected returns pro-forma
10.0% appreciation · 3.0% rent growth · sell at horizon
- IRR
- 30.7%
- Equity multiple
- 3.41×
- Total profit
- $128,273
- Equity at exit
- $171,077
- IRR
- 26.6%
- Equity multiple
- 7.73×
- Total profit
- $358,094
- Equity at exit
- $368,934
Cash invested: $53,172 (down + closing). Projections, not guarantees.
Landlord ↔ Tenant lean methodology
- Overall (STATE)
- 27 Tenant-Leaning
- State Maryland
- 27 Tenant-Leaning · D+14
- County
- — inherits STATE
- City
- — inherits STATE
ZIP-level market 21643
- Home prices YoY
- 15.5%
- Active inventory
- 34
- Price-to-rent
- 7.9×
Monthly cashflow live
- Estimated rent
- $2,013 medium interval (Pro) →
- Mortgage (P&I)
- −$996
- Tax from tax record
- −$125 /mo · $1,495/yr
- Insurance
- −$79
- HOA
- −$0
- Vacancy / Maint / Mgmt
- −$423
- Net cashflow
- $391
Break-even live
UW: 25.0% down · 7.5% · 30yr · 1.5% tax · 5.0% vac · 8.0% maint · 8.0% mgmt
Financing live
Cash to close
- Down payment
- $47,475
- Closing costs
- $5,697
- Reserves months
- —
- Total cash needed
- —
Loan-product check · same deal, 3 products live
Conventional
25% down · 7.5% · 30yr
- Down + closing
- —
- Monthly P&I
- —
- Monthly cashflow
- —
- DSCR
- —
- Eligible?
- —
Personal DTI + credit; lowest rate.
DSCR
20% down · 8.5% · 30yr
- Down + closing
- —
- Monthly P&I
- —
- Monthly cashflow
- —
- DSCR
- —
- Eligible?
- —
No personal income docs; deal must DSCR.
Hard money
10% down · 12.0% · 12mo
- Down + closing
- —
- Monthly P&I
- —
- Monthly cashflow
- —
- DSCR
- —
- Eligible?
- —
Short-term bridge; refi at stabilization.
Listing history 27 events
-
2026-06-18days on market $189,900 Active 48 DOM
-
2026-06-17days on market $189,900 Active 47 DOM
-
2026-06-16days on market $189,900 Active 46 DOM
-
2026-06-15days on market $189,900 Active 45 DOM
-
2026-06-13days on market $189,900 Active 43 DOM
-
2026-06-12days on market $189,900 Active 42 DOM
-
2026-06-09days on market $189,900 Active 39 DOM
-
2026-06-08days on market $189,900 Active 38 DOM
-
2026-06-07days on market $189,900 Active 37 DOM
-
2026-06-07days on market $189,900 Active 36 DOM
-
2026-06-04days on market $189,900 Active 33 DOM
-
2026-06-02days on market $189,900 Active 32 DOM
-
2026-06-01days on market $189,900 Active 31 DOM
-
2026-05-31days on market $189,900 Active 30 DOM
-
2026-05-31days on market $189,900 Active 29 DOM
-
2026-05-01$189,900 Active 867-char remark
-
2008-03-11historical
-
2007-12-03
-
2007-10-26historical
-
2006-10-27
-
2006-10-19historical
-
2005-10-25
-
2005-10-12historical
-
2005-07-01
-
1997-11-22historical
-
1997-05-22
-
1983-12-16soldstatus $25,000
ⓘ Source: listings_history table (triggers on properties + properties_extension) + one-shot
backfill from property_details.listing_events for pre-trigger history.
Tax reassessment forecast MD · Partial reset (capped growth)
- Current annual tax
- $1,495 · $125/mo
- Projected year-2 tax
- $1,783 · $149/mo
- Expected delta
- +$287/yr (+$24/mo · 19.2%)
ⓘ Screening estimate from a state-policy table — verify with the county assessor before closing.
Climate risk First Street
- Flood 1/10 Low FEMA zone X (unshaded) · 0% chance over 30 yrs
- Wildfire 2/10 Low
- Heat 8/10 Severe 7 d/yr ≥105°F today · 16 d/yr by 30 yrs out
- Wind 6/10 Major 67% chance of damaging wind over 30 yrs
- Air quality 2/10 Low 1 unhealthy d/yr today · 2 by 30 yrs out
Nearby sold comps map
Loading sold comps map…
Walkable amenities ~0.75 mi
Loading nearby amenities…
Taxation est. · year 1
- Rental income
- $24,157
- − Mortgage interest
- −$10,637
- − Property taxes
- −$1,495
- − Insurance
- −$950
- − Repairs & maintenance
- −$1,933
- − Management
- −$1,933
- − Depreciation
- −$5,524
- Taxable income
- $1,685
- Est. tax owed @ 24.0%
- −$405
- After-tax cash flow
- $4,285/yr
For passive investors: Depreciation is non-cash, so a rental often shows a tax loss while cash-flowing — sheltering income. Rental losses are passive: they offset passive income freely, and up to $25,000/yr can offset ordinary (W-2) income if you actively participate and your MAGI is under $100k (phasing out to $0 by $150k); unused losses carry forward. On sale, claimed depreciation is recaptured at up to 25%, and gains may owe capital-gains tax (a 1031 exchange can defer both). Figures are a year-1 estimate at your 24.0% rate — not tax advice; consult a CPA.
Schools (NCES district)
- District
- Dorchester County Public Schools
- NCES district ID
- 2400300
- Math proficiency
- 10% ▼ -14.00%
- Reading proficiency
- 23% ▼ -12.00%
- Median HH income
- $46,767
- Composite
- 14.65/100
- National rank
- #9404
- State rank
- #23 of 24 in MD
Livability — Hurlock
- Score
- 61/100
- State rank
- #332
- US rank
- #17536
Category grades
Schools grade is shown separately in the Schools card above.
Census & demographics
- Population (ZIP)
- 5,176
Population outlook (Dorchester County) Hauer SSP2
- Today (2025)
- 31,699 people
- By 2030
- 31,054 · -2.0%
- By 2040
- 29,712 · -6.3%
- By 2050
- 28,618 · -9.7%
- By 2075
- 28,436 · -10.3%
- By 2100
- 28,937 · -8.7%
Race, ethnicity, and origin ACS 2023
- Neighborhood character
- Diverse neighborhood (Simpson 0.55)
- Race & ethnicity
- White 61% Black 28% Two or more races 5% Hispanic / Latino 4%
- Common ancestry
- Lithuanian 2% Italian 2% Romanian 1%
- Foreign-born
- 3% · Canada
- Languages at home
- 96% English-only · Spanish 3%
Political lean MEDSL · Dorchester
- 2024 margin
- R (+14.6) · D 41.6% · R 56.1% · Other 2.3%
- 2008→2024 swing
- -6.3pp toward R · 2008: -8.2pp · 2024: -14.6pp
- All cycles
- 2024: R+14.6 2020: R+11.9 2016: R+16.0 2012: R+6.6 2008: R+8.2
Not yet ingested
- Civics
- —
Market trends
- HPI YoY
- ▲ 52.36%
- Current HPI
- 390.419
- Rent YoY
- —
- Metro
- —
- State GDP YoY
- ▲ 2.97%
- F500 in state
- 12
Industry mix (Fortune 500 HQ in MD)
| Industry | F500 HQs | Revenue |
|---|---|---|
| Aerospace / Defense | 1 | $71B |
|
||
| Utilities | 1 | $25B |
|
||
| Hotels | 1 | $24B |
|
||
| Consumer Goods | 1 | $7B |
|
||
| Real Estate | 1 | $6B |
|
||
| Chemicals | 1 | $2B |
|
||
Price history
+659.6% since first listed12 events — show timeline
- 2026-05-01 Listed $189,900 BRIGHT MLS
- 2008-03-11 Delisted — MRIS
- 2007-12-03 Listed — MRIS
- 2007-10-26 Delisted — MRIS
- 2006-10-27 Listed — MRIS
- 2006-10-19 Delisted — MRIS
- 2005-10-25 Listed — MRIS
- 2005-10-12 Delisted — MRIS
- 2005-07-01 Listed — MRIS
- 1997-11-22 Delisted — MRIS
- 1997-05-22 Listed — MRIS
- 1983-12-16 Sold (Public Records) $25,000 Public Records
Property tax history
+4.4%/yrLatest (2025): $1,495 · +9.6% YoY. Source: county tax records.
Cash-flow waterfall
monthlySold comps — $/sqft
last 12 mo · ≤1 miLoading sold comps…