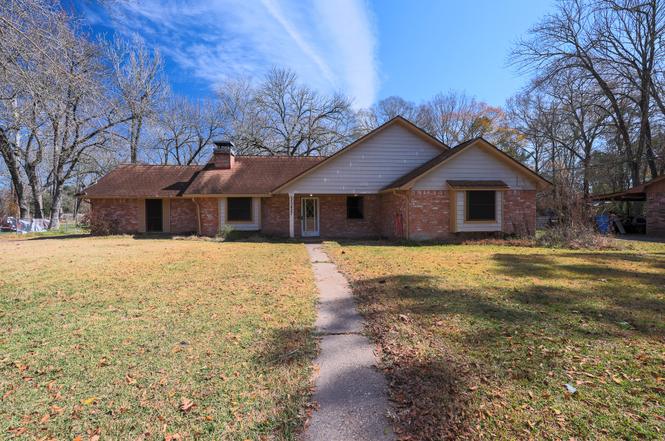
20427 Lakeside Dr · Porter Heights, TX
Flood risk 1/10 · Minimal
- FEMA flood zone
- X (unshaded)
- Chance of flooding over 30 yrs
- 0.0%
- Est. flood insurance / yr
- $507 – $1,088
Fire risk 3/10 · Minor
- Est. fire insurance / yr
- $1,222 – $2,270
Heat risk 8/10 · Major
- Hot days now (above 110°F)
- 7 days/yr
- Hot days in 30 yrs
- 24 days/yr
Wind risk 9/10 · Severe
- Chance of severe wind over 30 yrs
- 99.0%
Air-quality risk 3/10 · Minor
- Unhealthy air days now
- 2 days/yr
- Unhealthy air days in 30 yrs
- 3 days/yr
Risk factors via First Street. Map © Google.
Why this score? — see what drove the D+ grade
The composite is a weighted blend of 9 inputs, each scored 0–100. Each bar is that input's sub-score; the figure is the points it added to the 100-point composite (weight × sub-score).
- Cash flow +13.2/30.0
- ARV discount +13.0/15.0
- 1% rule +4.3/10.0
- DSCR +4.0/10.0
- Livability +3.2/5.0
- Rent growth +2.9/5.0
- Schools +2.8/10.0
- Condition / age +2.5/5.0
- Appreciation +0.0/10.0
$249,000
🖨 Deal sheet (PDF) 📄 Offer letter ✓ Due diligence
Listing remarks
This stunning 4-bedroom, 2-bath home perfectly balances comfort and style. Gather around the impressive wood-burning fireplace with built-ins that add warmth and character. The well-appointed kitchen features abundant cabinetry, offering plenty of space for cooking and storage. A spacious bonus room provides flexibility for a game room, media space, or additional living area. Enjoy outdoor living on the large covered patio—ideal for morning coffee or relaxing evenings overlooking the peaceful surroundings. Set on a generous lot, the property offers room to play and a charming country feel. Recent updates include a new washer, dryer, refrigerator, Lennox A/C unit, fresh paint, new carp
Key facts
- Generous lot
- Recent updates
- Spacious bonus room
Tags
Property features AI
Finance
- HOA & community: Golden Trails association with a $65 annual fee
Exterior
- Parking: Detached oversized garage (2 spaces)
- Utilities: Public water; Septic tank
- Home design: Residential property; Built in 1971; Slab foundation; Composition roof
- Construction: Brick construction
- Exterior features: Porch; Screened porch; Enclosed porch; Located in a subdivision
Interior
- Kitchen: Dishwasher; Electric oven; Electric range; Garbage disposal; Microwave; Breakfast nook
- Bedrooms: Primary bedroom (First floor); Bedroom (First floor); Bedroom (First floor); Bedroom (First floor)
- Flooring: Carpet; Tile; Wood
- Bathrooms: 2 full bathrooms
- Heating & cooling: Central heating (electric); Central air conditioning (electric)
- Interior features: Wood-burning fireplace (1); Enclosed porch; Screened porch
- Laundry & utility: Washer hookup; Electric dryer hookup; Gas dryer hookup
Neighborhood map
What this means for you Summary
Snapshot
- This is a 4-bed/2.0-bath single-family listed at $249k.
Deal economics
- At list price, monthly cash flow is $-3 ($-36/yr) — negative.
- To cash-flow at today's rent, offer at most $248k (0.2% below list).
- To meet the 1% rule (rent ≥ 1% of price), the offer needs to be $231k (7.3% below list).
- Recommended offer: $231k (7.3% below list) — sets the bar for 1% rule.
- Cap rate 6.3% vs local median 2.5% in Porter Heights — top-decile yield for the area; either an underpriced asset or a hidden risk that comps aren't pricing in. Stress-test before assuming the spread holds.
Location & tenants
- Location reads 65/100 on livability (#663 in TX) — a middle-class / working-renter tenant base. Strengths: crime A+, employment A+, cost of living A+; Watch: amenities F, commute F, health & safety F.
- New Caney ISD (suburban): math 31% / reading 32% proficiency, ranked #570 of 826 in TX (top 69%) — families likely to look elsewhere, expect single-tenant / working-renter base with shorter leases.
- Zoned schools: White Oak Middle (math 38% / reading 32%, grade F, #842 of 1,662 statewide, top 51%, 834 students, 75% FRL); New Caney H S (math 24% / reading 31%, grade F, #1,183 of 1,632 statewide, top 73%, 2,428 students, 78% FRL) — zoned schools average 76% FRL vs 57% district-wide (20 pts higher); higher-poverty schools than district average — tighter screening recommended.
- Market conditions: Rents rising (+1.6%/yr); 956 active listings in the ZIP; 2 comparable units currently listed for rent nearby; solid renter incomes; 13,259 units permitted in Montgomery County in 2024 (1,402 in 5+ unit buildings).
Forward outlook
- Local home prices are declining (-3.0%/yr); year-one equity from $2k of loan paydown is wiped out by about $7k of value loss. Plan a longer hold.
- Montgomery County population projected at +65% by 2050 — long-run rental-demand tailwind backs the buy-and-hold thesis.
Negotiation context
- It's been on market 62 days — a 6% lower offer ($234k) is reasonable based on typical stale-listing flexibility.
- 11 sale attempts since 12y ago; this cycle's ask is 11218% above the opening price — seller raised mid-cycle; expect resistance to lowballs.
Risks & watch-outs
- Climate carrying-cost: severe wind risk, 99% chance of damaging wind over 30y; extreme-heat days projected 7→24/yr by 2055 (HVAC capex compounding) — expect insurance premiums to compound above CPI over the hold.
Questions for the listing agent
- What do current leases actually rent for vs. the listed asking? Can we see a recent rent roll and the last 12 months of T-12 income?
- It's been on market 62 days. Have you received any prior offers? Is the seller open to a 7% concession, seller financing, or rate buy-down credit?
- Built in 1971 — when were the roof, HVAC, electrical panel, plumbing, and water heater last replaced?
- What does the HOA fee cover, when was the last increase, and are there any pending special assessments or reserve-fund shortfalls?
- Why hasn't it sold? Are there any deal-killer items the seller is aware of (foundation, flood, title, zoning, code violations)?
- Is there a deadline driving the sale (1031 exchange, divorce, estate, relocation)? That informs how much negotiation room exists.
- Schools are F-rated, which usually means shorter tenancies and higher turnover. Who's the typical renter profile here, and what's been the actual vacancy rate?
- The area grade is low — what's the realistic commute time and amenity access for the typical tenant pool here? Any planned neighborhood developments (good or bad) we should know about?
- What's the average days-on-market for RENTAL listings here right now (not sales)? A rising rental-DOM trend means longer vacancies and softer asking-rent achievability than the comps imply.
- What's the recent tenant-quality profile in this submarket — average credit score on applications, eviction rate, late-payment / NSF rate, and stable-employment percentage? A property-management company in the area should have these aggregated.
- How much new for-sale + rental construction is in the pipeline within 1–3 miles? Heavy new supply typically softens prices + rents 12–24 months out; constrained supply supports both.
Investment metrics
- 1% rule
- 0.93% ✗
- Cap rate
- 6.28%
- Cash-on-cash
- -0.05%
- DSCR
- 1.00
- GRM
- 9.0
CMA / ARV
- ARV (on-the-fly)
- $283,920
- Comps found
- 12
Show comp detail 12 sales within ~0.75 mi
| Address | Dist | Beds/Ba | Sqft | Sold | Price | $/sf | Match |
|---|---|---|---|---|---|---|---|
| 20427 Lakeside Dr | 0.00mi | 4/2.0 | 2,028 (0%) | 1mo | $249,000 | $123 | 99 |
| 16703 Holly St | 0.50mi | 4/2.5 | 2,003 (-1%) | 2mo | $289,900 | $145 | 71 |
| 20914 Wildbird Cherry St | 0.71mi | 4/2.5 | 2,003 (-1%) | 0mo | $289,900 | $145 | 63 |
| 20895 Wildbird Cherry Ln | 0.69mi | 4/2.5 | 2,003 (-1%) | 4mo | $279,900 | $140 | 61 |
| 21011 Voyage Ln | 0.48mi | 4/2.5 | 1,897 (-6%) | 6mo | $249,900 | $132 | 60 |
| 21022 Voyage Ln | 0.50mi | 3/2.5 (-1) | 1,952 (-4%) | 6mo | $259,900 | $133 | 58 |
| 16718 Brighter Blooms Ave | 0.73mi | 4/2.5 | 2,003 (-1%) | 6mo | $274,900 | $137 | 57 |
| 21018 Voyage Ln | 0.49mi | 4/2.5 | 1,789 (-12%) | 5mo | $239,900 | $134 | 51 |
| 16452 Moss Ln | 0.68mi | 4/2.5 | 2,260 (+11%) | 2mo | $299,900 | $133 | 46 |
| 20883 Wildbird Cherry Ln | 0.67mi | 4/2.5 | 1,785 (-12%) | 3mo | $269,900 | $151 | 44 |
| 20907 Wildbird Cherry Ln | 0.71mi | 4/2.5 | 1,785 (-12%) | 2mo | $269,900 | $151 | 43 |
| 16722 Brighter Blooms Ave | 0.73mi | 4/2.5 | 1,785 (-12%) | 5mo | $269,900 | $151 | 39 |
Match score weights: distance 35% · size 25% · config 20% · recency 20%. Top-matched comps best support the ARV.
Projected returns pro-forma
-3.0% appreciation · 1.65% rent growth · sell at horizon
- IRR
- -18.0%
- Equity multiple
- 0.38×
- Total profit
- $-43,535
- Equity at exit
- $37,127
- IRR
- -13.1%
- Equity multiple
- 0.28×
- Total profit
- $-50,107
- Equity at exit
- $21,529
Cash invested: $69,720 (down + closing). Projections, not guarantees.
Landlord ↔ Tenant lean methodology
- Overall (STATE)
- 87 Strongly Landlord-Friendly
- State Texas
- 87 Strongly Landlord-Friendly · R+5
- County
- — inherits STATE
- City
- — inherits STATE
ZIP-level market 77365
- Home prices YoY
- -33.0%
- Rents YoY
- 1.6%
- Active inventory
- 956
- Price-to-rent
- 9.0×
Monthly cashflow live
- Estimated rent
- $2,308 medium interval (Pro) →
- Mortgage (P&I)
- −$1,306
- Tax from tax record
- −$412 /mo · $4,945/yr
- Insurance
- −$104
- HOA
- −$5
- Lot rent
- −$0
- Vacancy / Maint / Mgmt
- −$485
- Net cashflow
- $-3
Break-even live
Sensitivity live
| Price | -10% $138 | -5% $67 | +0% $-3 | +5% $-73 | +10% $-144 |
|---|---|---|---|---|---|
| Rent | -10% $-185 | -5% $-94 | +0% $-3 | +5% $88 | +10% $179 |
| Rate | -1.0pp $122 | -0.5pp $60 | base $-3 | +0.5pp $-68 | +1.0pp $-133 |
UW: 25.0% down · 7.5% · 30yr · 1.5% tax · 5.0% vac · 8.0% maint · 8.0% mgmt
Financing live
Cash to close
- Down payment
- $62,250
- Closing costs
- $7,470
- Reserves months
- —
- Total cash needed
- —
Loan-product check · same deal, 3 products live
Conventional
25% down · 7.5% · 30yr
- Down + closing
- —
- Monthly P&I
- —
- Monthly cashflow
- —
- DSCR
- —
- Eligible?
- —
Personal DTI + credit; lowest rate.
DSCR
20% down · 8.5% · 30yr
- Down + closing
- —
- Monthly P&I
- —
- Monthly cashflow
- —
- DSCR
- —
- Eligible?
- —
No personal income docs; deal must DSCR.
Hard money
10% down · 12.0% · 12mo
- Down + closing
- —
- Monthly P&I
- —
- Monthly cashflow
- —
- DSCR
- —
- Eligible?
- —
Short-term bridge; refi at stabilization.
Rent comps 2 comps
| Address | Beds | Baths | Sqft | Rent | $/sqft | DOM | Units | Dist |
|---|---|---|---|---|---|---|---|---|
| 21019 Voyage Ln Porter, TX | 3.0 | 2.5 | 1678 | $1,795 | $1.07 | 46d | 1 | 0.50mi |
| 16658 Moss Ln Porter, TX | 3.0 | 2.0 | 1402 | $1,750 | $1.25 | 26d | 1 | 0.76mi |
HOA detail
- Monthly dues
- $5 · $60/yr
Listing history 32 events
-
2026-05-05historical $1,900
-
2026-05-01status Pending
-
2026-04-14price $1,900
-
2026-04-13price $249,000
-
2026-03-31$2,200
-
2026-03-30price $259,000
-
2026-03-16price $269,000
-
2026-03-05price $279,000
-
2026-02-28$290,000 Active
-
2026-02-24historical
-
2026-02-12$290,000 Active
-
2025-01-20historical $2,300
-
2024-12-22$2,300
-
2024-12-20$2,300 Active
-
2024-12-20historical
-
2024-02-20soldstatus
-
2018-12-18historical
-
2018-11-01$198,500 Active
-
2014-06-20soldstatus Sold
-
2014-06-20soldstatus
-
2014-05-16price $72,500 Active
-
2014-05-16status Active
-
2014-05-16status Option Pending
-
2014-05-16status Active
-
2014-05-16status Pending
-
2014-05-08historical
-
2014-05-08status Active
-
2014-04-22status Pending, Continue to Show
-
2014-04-14status Active
-
2014-04-11status Pending, Continue to Show
-
2014-04-09$82,500 Active
-
2000-03-01soldstatus
ⓘ Source: listings_history table (triggers on properties + properties_extension) + one-shot
backfill from property_details.listing_events for pre-trigger history.
Tax reassessment forecast TX · Resets to sale price
- Current annual tax
- $4,945 · $412/mo
- Projected year-2 tax
- $4,945 · $412/mo
- Expected delta
- $0/yr ($0/mo · 0.0%)
ⓘ Screening estimate from a state-policy table — verify with the county assessor before closing.
Climate risk First Street
- Flood 1/10 Low FEMA zone X (unshaded) · 0% chance over 30 yrs
- Wildfire 3/10 Moderate
- Heat 8/10 Severe 7 d/yr ≥110°F today · 24 d/yr by 30 yrs out
- Wind 9/10 Extreme 99% chance of damaging wind over 30 yrs
- Air quality 3/10 Moderate 2 unhealthy d/yr today · 3 by 30 yrs out
Nearby sold comps map
Loading sold comps map…
Walkable amenities ~0.75 mi
Loading nearby amenities…
Taxation est. · year 1
- Rental income
- $27,701
- − Mortgage interest
- −$13,948
- − Property taxes
- −$4,945
- − Insurance
- −$1,245
- − Repairs & maintenance
- −$2,216
- − Management
- −$2,216
- − HOA
- −$60
- − Depreciation
- −$7,244
- Taxable loss
- −$4,173
- Est. tax savings @ 24.0%
- +$1,002
- After-tax cash flow
- $965/yr
For passive investors: Depreciation is non-cash, so a rental often shows a tax loss while cash-flowing — sheltering income. Rental losses are passive: they offset passive income freely, and up to $25,000/yr can offset ordinary (W-2) income if you actively participate and your MAGI is under $100k (phasing out to $0 by $150k); unused losses carry forward. On sale, claimed depreciation is recaptured at up to 25%, and gains may owe capital-gains tax (a 1031 exchange can defer both). Figures are a year-1 estimate at your 24.0% rate — not tax advice; consult a CPA.
Schools (NCES district)
- District
- New Caney ISD
- NCES district ID
- 4832400
- Math proficiency
- 31% ▼ -16.00%
- Reading proficiency
- 32% ▼ -6.00%
- Median HH income
- $55,380
- Composite
- 27.97/100
- National rank
- #6857
- State rank
- #570 of 826 in TX
Livability — Porter Heights
- Score
- 65/100
- State rank
- #663
- US rank
- #12479
Category grades
Schools grade is shown separately in the Schools card above.
Census & demographics
- Census place
- Porter Heights, TX
- County
- Montgomery County · 663,713 people
- Metro
- Houston-The Woodlands-Sugar Land, TX
- Population (ZIP)
- 46,418
- Household income
- $95,702
- Rent vs Own
- Severe rent burden
- 1016.0
Population outlook (Montgomery County) Hauer SSP2
- Today (2025)
- 713,896 people
- By 2030
- 805,263 · +12.8%
- By 2040
- 992,708 · +39.1%
- By 2050
- 1,179,590 · +65.2%
- By 2075
- 1,628,084 · +128.1%
- By 2100
- 1,937,880 · +171.5%
Race, ethnicity, and origin ACS 2023
- Neighborhood character
- Diverse neighborhood (Simpson 0.59)
- Race & ethnicity
- Hispanic / Latino 46% White 44% Two or more races 15% Black 5% Asian 3%
- Hispanic origin (detail)
- Mexican 39% Puerto Rican 1%
- Common ancestry
- Lithuanian 4% Slovak 2% Romanian 2%
- Foreign-born
- 18% · Canada
- Languages at home
- 59% English-only · Spanish 36% Other Indo-European 2% Russian/Polish/Slavic 1%
Political lean MEDSL · Montgomery
- 2024 margin
- Solid R (+45.5) · D 26.8% · R 72.3%
- 2008→2024 swing
- +7.2pp toward D · 2008: -52.7pp · 2024: -45.5pp
- All cycles
- 2024: R+45.5 2020: R+43.8 2016: R+51.4 2012: R+60.7 2008: R+52.7
Not yet ingested
- Civics
- —
Market trends
- HPI YoY
- ▼ -111.46%
- Current HPI
- 225.9903
- Rent YoY
- ▲ 1.65%
- Metro
- Houston-The Woodlands-Sugar Land, TX
- State GDP YoY
- ▲ 3.95%
- F500 in state
- 110
Industry mix (Fortune 500 HQ in TX)
| Industry | F500 HQs | Revenue |
|---|---|---|
| Energy | 16 | $1,198B |
|
||
| Technology | 5 | $198B |
|
||
| Engineering / Construction | 4 | $72B |
|
||
| Energy Services | 3 | $60B |
|
||
| Utilities | 3 | $41B |
|
||
| Healthcare | 2 | $330B |
|
||
Price history
-97.7% since first listed32 events — show timeline
- 2026-05-05 Rental Removed $1,900 HARMLS
- 2026-05-01 Pending — HARMLS
- 2026-04-14 Price Changed $1,900 HARMLS
- 2026-04-13 Price Changed $249,000 HARMLS
- 2026-03-31 Listed for Rent $2,200 HARMLS
- 2026-03-30 Price Changed $259,000 HARMLS
- 2026-03-16 Price Changed $269,000 HARMLS
- 2026-03-05 Price Changed $279,000 HARMLS
- 2026-02-28 Listed $290,000 HARMLS
- 2026-02-24 Listing Removed — HARMLS
- 2026-02-12 Listed $290,000 HARMLS
- 2025-01-20 Rental Removed $2,300 HARMLS
- 2024-12-22 Listed for Rent $2,300 HARMLS
- 2024-12-20 Listing Removed — HARMLS
- 2024-12-20 Listed $2,300 HARMLS
- 2024-02-20 Sold (Public Records) — Public Records
- 2018-12-18 Listing Removed — HARMLS
- 2018-11-01 Listed $198,500 HARMLS
- 2014-06-20 Sold (Public Records) — Public Records
- 2014-06-20 Sold (MLS) — HARMLS
- 2014-05-16 Pending — HARMLS
- 2014-05-16 Relisted — HARMLS
- 2014-05-16 Pending — HARMLS
- 2014-05-16 Relisted — HARMLS
- 2014-05-16 Price Changed $72,500 HARMLS
- 2014-05-08 Listing Removed — HARMLS
- 2014-05-08 Relisted — HARMLS
- 2014-04-22 Pending — HARMLS
- 2014-04-14 Relisted — HARMLS
- 2014-04-11 Pending — HARMLS
- 2014-04-09 Listed $82,500 HARMLS
- 2000-03-01 Sold (Public Records) — Public Records
Property tax history
+5.6%/yrLatest (2025): $4,945 · -0.4% YoY. Source: county tax records.
Cash-flow waterfall
monthlySold comps — $/sqft
last 12 mo · ≤1 miLoading sold comps…