1856 Londoncrest Ct · Columbus, OH
Flood risk 1/10 · Minimal
- FEMA flood zone
- X (unshaded)
- Chance of flooding over 30 yrs
- 0.0%
- Est. flood insurance / yr
- $507 – $1,088
Fire risk 1/10 · Minimal
- Est. fire insurance / yr
- $713 – $1,323
Heat risk 4/10 · Minor
- Hot days now (above 102°F)
- 7 days/yr
- Hot days in 30 yrs
- 18 days/yr
Wind risk 2/10 · Minimal
- Chance of severe wind over 30 yrs
- 1.0%
Air-quality risk 2/10 · Minimal
- Unhealthy air days now
- 1 days/yr
- Unhealthy air days in 30 yrs
- 2 days/yr
Risk factors via First Street. Map © Google.
Why this score? — see what drove the C+ grade
The composite is a weighted blend of 9 inputs, each scored 0–100. Each bar is that input's sub-score; the figure is the points it added to the 100-point composite (weight × sub-score).
- Cash flow +22.5/30.0
- 1% rule +10.0/10.0
- ARV discount +7.5/15.0
- DSCR +7.2/10.0
- Livability +4.0/5.0
- Schools +3.8/10.0
- Rent growth +3.4/5.0
- Condition / age +2.2/5.0
- Appreciation +0.0/10.0
$124,900
🖨 Deal sheet (PDF) 📄 Offer letter ✓ Due diligence
Listing remarks
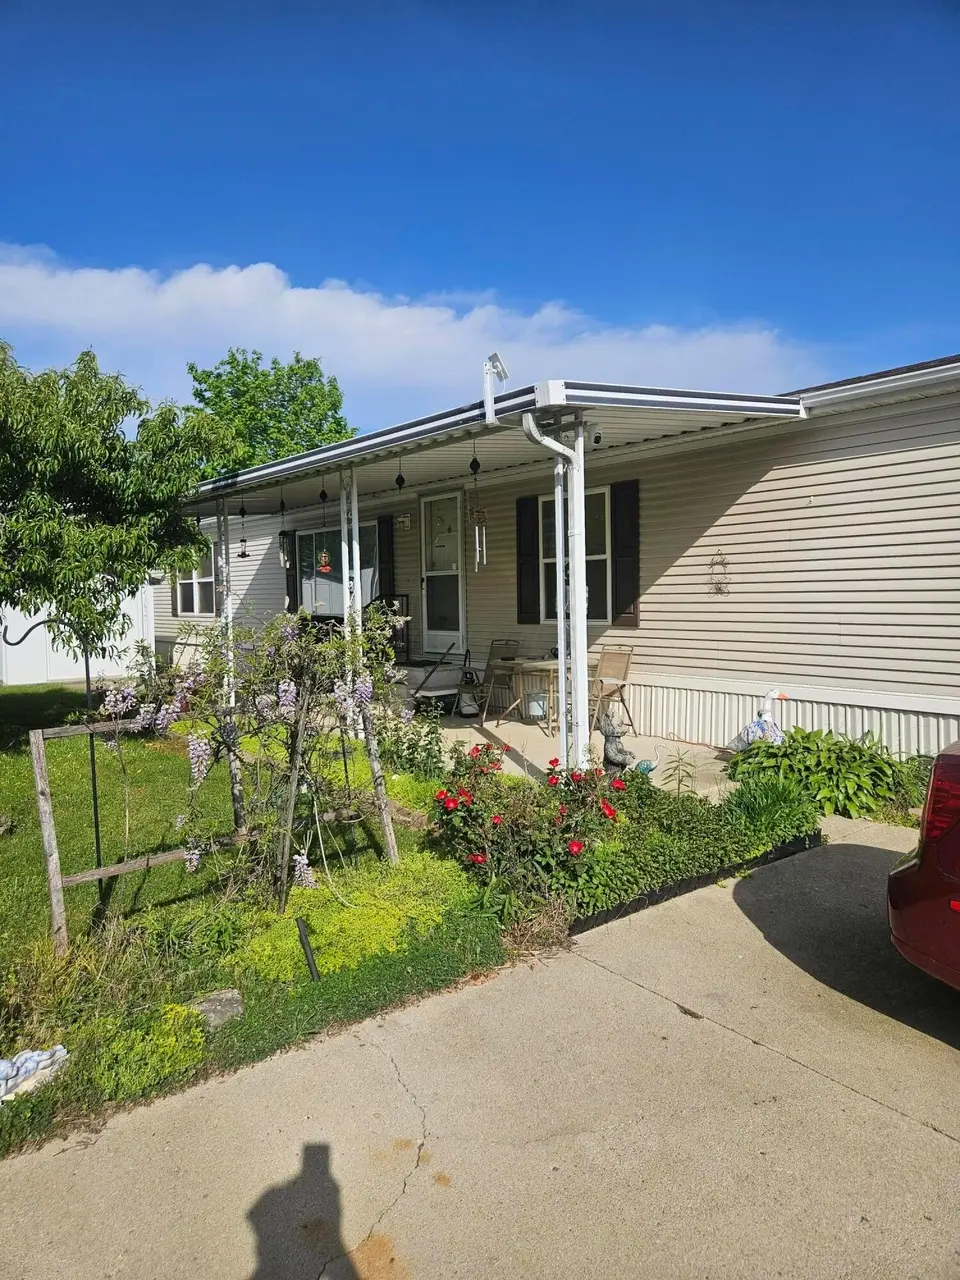
This is a 2001 Fairmont Homes, model Stratford Elite, double wide modular home. Serial No. MY01 114771AB. Model No. 7028 3B 2BA FM. It is approximately 1,900 sq. ft. This home features 3 bedrooms, all with walk-in closets, 2 full baths. A kitchen with center island, storage pantry and double stainless-steel sink, an adjacent dining area, a family room with built in entertainment center and a front living room with coat closet. Double-pane vinyl windows throughout the house. The furnace and stove operate with natural gas. The central AC and the hot water tank are electric. The house has two brand new 120 VAC smoke detectors, no batteries required. The exterior walls are 2''x6'' construction
Key facts
- Walk-in closets
- 2x6 construction
- Storage pantry
Tags
Property features AI
Finance
- HOA & community: Homeowners association with monthly fee of $550; HOA covers sewer, trash, and snow removal
Exterior
- Utilities: Public water; Public sewer
- Home design: Other residential without deeded land; One story; Built in 2001; No shared/common walls
- Construction: Other foundation type
- Exterior features: Shed(s)
Interior
- Bedrooms: 3 main-level bedrooms
- Bathrooms: 2 full bathrooms
- Heating & cooling: Central air conditioning
- Interior features: Approximately 1,848 livable area
Neighborhood map
What this means for you Summary
Snapshot
- This is a 3-bed/2.0-bath single-family listed at $125k. Condition is rated fair.
Deal economics
- At list price, monthly cash flow is $211 ($3k/yr) — positive.
- The deal already cash-flows at list — no discount required.
- Meets the 1% rule at list price ($2k rent vs $125k).
- Cap rate 8.3% vs local median 3.8% in Columbus — top-decile yield for the area; either an underpriced asset or a hidden risk that comps aren't pricing in. Stress-test before assuming the spread holds.
Location & tenants
- Location reads 81/100 on livability (#97 in OH, #1,491 nationally) — a professional / high-income tenant draw. Strengths: commute A+, cost of living A+, housing A+; Watch: employment C-, crime F.
- South-Western City (suburban): math 40% / reading 48% proficiency, ranked #500 of 656 in OH (top 76%) — families likely to look elsewhere, expect single-tenant / working-renter base with shorter leases.
- Zoned schools: James A Harmon Elementary School (math 52% / reading 42%, grade D-, #942 of 1,584 statewide, top 61%, 524 students, 63% FRL); Finland Middle School (math 37% / reading 40%, grade F, #529 of 654 statewide, top 81%, 637 students, 80% FRL); Franklin Heights High School (math 22% / reading 43%, grade F, #604 of 781 statewide, top 77%, 1,338 students, 65% FRL) — zoned schools average 69% FRL vs 51% district-wide (18 pts higher); higher-poverty schools than district average — tighter screening recommended.
- Market conditions: Rents rising (+3.7%/yr); 329 active listings in the ZIP; 11 comparable units currently listed for rent nearby; rentals leasing fast (median 13d on market — plan ~1-2 weeks tenant-placement turnaround); solid renter incomes; 8,139 units permitted in Franklin County in 2024 (5,940 in 5+ unit buildings).
Forward outlook
- Local home prices are declining (-3.0%/yr); year-one equity from $864 of loan paydown is wiped out by about $4k of value loss. Plan a longer hold.
- Franklin County population projected at +34% by 2050 — long-run rental-demand tailwind backs the buy-and-hold thesis.
Negotiation context
- Only 9 days on market — expect competitive offers; lowballing is unlikely to land.
Risks & watch-outs
- Watch-outs: HOA is 27% of rent.
Questions for the listing agent
- Have any recent inspections been done? Can we get a copy of the seller's disclosures and any deferred-maintenance estimates?
- What does the HOA fee cover, when was the last increase, and are there any pending special assessments or reserve-fund shortfalls?
- Is there a deadline driving the sale (1031 exchange, divorce, estate, relocation)? That informs how much negotiation room exists.
- Crime grade is F in this area — have there been break-ins, vandalism, or insurance claims at this property in the last 3 years? What carrier currently insures it and at what premium?
- What's the average days-on-market for RENTAL listings here right now (not sales)? A rising rental-DOM trend means longer vacancies and softer asking-rent achievability than the comps imply.
- What's the recent tenant-quality profile in this submarket — average credit score on applications, eviction rate, late-payment / NSF rate, and stable-employment percentage? A property-management company in the area should have these aggregated.
- How much new for-sale + rental construction is in the pipeline within 1–3 miles? Heavy new supply typically softens prices + rents 12–24 months out; constrained supply supports both.
Investment metrics
- 1% rule
- 1.65% ✓
- Cap rate
- 8.32%
- Cash-on-cash
- 7.23%
- DSCR
- 1.32
- GRM
- 5.1
CMA / ARV
- ARV (on-the-fly)
- $299,376
- Comps found
- 12
Show comp detail 12 sales within ~0.75 mi
| Address | Dist | Beds/Ba | Sqft | Sold | Price | $/sf | Match |
|---|---|---|---|---|---|---|---|
| 2123 Drumlin Dr | 0.49mi | 4/2.0 (+1) | 1,800 (-3%) | 10mo | $314,500 | $175 | 60 |
| 2159 Keller Pl E | 0.42mi | 4/2.5 (+1) | 1,996 (+8%) | 4mo | $330,000 | $165 | 57 |
| 1959 Little Water Dr | 0.72mi | 3/2.5 | 1,878 (+2%) | 8mo | $297,000 | $158 | 55 |
| 1935 Little Water Dr | 0.75mi | 3/2.5 | 1,808 (-2%) | 8mo | $290,000 | $160 | 53 |
| 2117 Drumlin Dr | 0.48mi | 4/2.5 (+1) | 1,932 (+4%) | 12mo | $222,250 | $115 | 53 |
| 2975 Crocker Run Rd | 0.70mi | 3/2.5 | 1,708 (-8%) | 3mo | $325,900 | $191 | 50 |
| 2903 Rivercliff Rd | 0.51mi | 4/1.5 (+1) | 1,680 (-9%) | 9mo | $242,500 | $144 | 46 |
| 1836 Glenmate Ct | 0.61mi | 4/1.5 (+1) | 1,754 (-5%) | 12mo | $285,000 | $162 | 46 |
| 2415 Kittrel Ct | 0.65mi | 3/2.0 | 1,668 (-10%) | 11mo | $240,000 | $144 | 45 |
| 2984 Crocker Run Rd | 0.70mi | 3/2.5 | 1,700 (-8%) | 12mo | $312,000 | $184 | 42 |
| 2305 Hyde Rd | 0.70mi | 4/2.0 (+1) | 2,000 (+8%) | 8mo | $239,900 | $120 | 41 |
| 2016 Sondra Ln | 0.66mi | 3/3.5 | 1,587 (-14%) | 12mo | $312,000 | $197 | 30 |
Match score weights: distance 35% · size 25% · config 20% · recency 20%. Top-matched comps best support the ARV.
Projected returns pro-forma
-3.0% appreciation · 3.68% rent growth · sell at horizon
- IRR
- -3.8%
- Equity multiple
- 0.86×
- Total profit
- $-5,043
- Equity at exit
- $18,623
- IRR
- 7.3%
- Equity multiple
- 1.58×
- Total profit
- $20,268
- Equity at exit
- $10,799
Cash invested: $34,972 (down + closing). Projections, not guarantees.
Landlord ↔ Tenant lean methodology
- Overall (STATE)
- 73 Landlord-Friendly
- State Ohio
- 73 Landlord-Friendly · R+6
- County
- — inherits STATE
- City
- — inherits STATE
ZIP-level market 43123
- Rents YoY
- 3.7%
- Active inventory
- 329
- Price-to-rent
- 5.1×
Monthly cashflow live
- Estimated rent
- $2,055 high interval (Pro) →
- Mortgage (P&I)
- −$655
- Tax est. 1.5%
- −$156 /mo · $1,874/yr
- Insurance
- −$52
- HOA
- −$550
- Vacancy / Maint / Mgmt
- −$432
- Net cashflow
- $211
Break-even live
Sensitivity live
| Price | -10% $297 | -5% $254 | +0% $211 | +5% $167 | +10% $124 |
|---|---|---|---|---|---|
| Rent | -10% $48 | -5% $129 | +0% $211 | +5% $292 | +10% $373 |
| Rate | -1.0pp $273 | -0.5pp $242 | base $211 | +0.5pp $178 | +1.0pp $145 |
UW: 25.0% down · 7.5% · 30yr · 1.5% tax · 5.0% vac · 8.0% maint · 8.0% mgmt
Financing live
Cash to close
- Down payment
- $31,225
- Closing costs
- $3,747
- Reserves months
- —
- Total cash needed
- —
Loan-product check · same deal, 3 products live
Conventional
25% down · 7.5% · 30yr
- Down + closing
- —
- Monthly P&I
- —
- Monthly cashflow
- —
- DSCR
- —
- Eligible?
- —
Personal DTI + credit; lowest rate.
DSCR
20% down · 8.5% · 30yr
- Down + closing
- —
- Monthly P&I
- —
- Monthly cashflow
- —
- DSCR
- —
- Eligible?
- —
No personal income docs; deal must DSCR.
Hard money
10% down · 12.0% · 12mo
- Down + closing
- —
- Monthly P&I
- —
- Monthly cashflow
- —
- DSCR
- —
- Eligible?
- —
Short-term bridge; refi at stabilization.
Rent comps 11 comps
| Address | Beds | Baths | Sqft | Rent | $/sqft | DOM | Units | Dist |
|---|---|---|---|---|---|---|---|---|
| 1640 Butterfly Ct Columbus, OH | 4.0 | 2.0 | 1433 | $1,849 | $1.29 | 0d | 1 | 0.54mi |
| 1640 Butterfly Ct Columbus, OH | 4.0 | 2.0 | 1433 | $1,849 | $1.29 | 5d | 1 | 0.54mi |
| 2290 Turquoise Dr Grove City, OH | 3.0 | 1.0 | 1232 | $2,225 | $1.81 | 18d | 1 | 0.59mi |
| 2348 Warfield Dr Grove City, OH | 4.0 | 2.0 | 1262 | $1,825 | $1.45 | 46d | 1 | 0.69mi |
| 1417 Fahy Dr Columbus, OH | 3.0 | 2.0 | 1932 | $2,345 | $1.21 | 12d | 1 | 0.90mi |
| 2284 Brookbank Dr Grove City, OH | 3.0 | 2.0 | 1478 | $2,275 | $1.54 | 12d | 1 | 1.03mi |
| 2656 Willowgate Rd Grove City, OH | 4.0 | 2.5 | 1820 | $2,625 | $1.44 | 3d | 1 | 1.28mi |
| 1576 Rock Creek Dr Grove City, OH | 3.0 | 2.5 | 1450 | $2,050 | $1.41 | 16d | 1 | 1.34mi |
| 1433 Tall Meadows Dr Columbus, OH | 3.0 | 1.5 | 1428 | $1,995 | $1.40 | 14d | 1 | 1.34mi |
| 1433 Tall Meadows Dr Columbus, OH | 3.0 | 1.5 | 1428 | $1,995 | $1.40 | 0d | 1 | 1.34mi |
| 1690 Dyer Rd Grove City, OH | 3.0 | 1.5 | 1440 | $1,749 | $1.21 | 23d | 1 | 1.48mi |
HOA detail
- Monthly dues
- $550 · $6,600/yr
- Likely covers
- watergaselectric
Listing history 7 events
-
2026-06-21days on market $124,900 Active 9 DOM
-
2026-06-18days on market $124,900 Active 6 DOM
-
2026-06-17days on market $124,900 Active 5 DOM
-
2026-06-16days on market $124,900 Active 4 DOM
-
2026-06-15days on market $124,900 Active 3 DOM
-
2026-06-13remarks 699-char remark
-
2026-06-13$124,900 Active 1 DOM
ⓘ Source: listings_history table (triggers on properties + properties_extension) + one-shot
backfill from property_details.listing_events for pre-trigger history.
Climate risk First Street
- Flood 1/10 Low FEMA zone X (unshaded) · 0% chance over 30 yrs
- Wildfire 1/10 Low
- Heat 4/10 Moderate 7 d/yr ≥102°F today · 18 d/yr by 30 yrs out
- Wind 2/10 Low 100% chance of damaging wind over 30 yrs
- Air quality 2/10 Low 1 unhealthy d/yr today · 2 by 30 yrs out
Nearby sold comps map
Loading sold comps map…
Walkable amenities ~0.75 mi
Loading nearby amenities…
Taxation est. · year 1
- Rental income
- $24,664
- − Mortgage interest
- −$6,996
- − Property taxes
- −$1,874
- − Insurance
- −$624
- − Repairs & maintenance
- −$1,973
- − Management
- −$1,973
- − HOA
- −$6,600
- − Depreciation
- −$3,633
- Taxable income
- $990
- Est. tax owed @ 24.0%
- −$238
- After-tax cash flow
- $2,289/yr
For passive investors: Depreciation is non-cash, so a rental often shows a tax loss while cash-flowing — sheltering income. Rental losses are passive: they offset passive income freely, and up to $25,000/yr can offset ordinary (W-2) income if you actively participate and your MAGI is under $100k (phasing out to $0 by $150k); unused losses carry forward. On sale, claimed depreciation is recaptured at up to 25%, and gains may owe capital-gains tax (a 1031 exchange can defer both). Figures are a year-1 estimate at your 24.0% rate — not tax advice; consult a CPA.
Condition & rehab AI · 2 photos
This home requires significant repairs, particularly to the roof and exterior siding, and would benefit from landscaping and painting to improve its resale and rental value.
Repairs flagged
- Major roof — Signs of wear and discoloration suggest significant damage.
- Moderate exterior siding — Minor damage and discoloration are visible on the siding.
- Minor landscaping — Some overgrown areas and dead plants are visible in the landscaping.
Value-add opportunities
- Resale repair roof — A new roof would significantly improve the home's curb appeal and overall condition.
- Rental paint exterior — Fresh paint would make the home more attractive to renters and improve its curb appeal.
- Both landscaping — A well-maintained landscape would enhance the home's curb appeal and attract both buyers and renters.
Renovation cost estimate screening
| Repair item | Severity | Est. cost |
|---|---|---|
| roof · Signs of wear and discoloration suggest significant damage. | Major | $15,000–50,000 |
| exterior siding · Minor damage and discoloration are visible on the siding. | Moderate | $3,000–15,000 |
| landscaping · Some overgrown areas and dead plants are visible in the landscaping. | Minor | $500–3,000 |
| Total estimated repair cost · 3 items | $18,500–68,000 |
Value-add ROI direction
- Resale repair roof — A new roof would significantly improve the home's curb appeal and overall condition. ↑
- Rental paint exterior — Fresh paint would make the home more attractive to renters and improve its curb appeal. ↑
- Both landscaping — A well-maintained landscape would enhance the home's curb appeal and attract both buyers and renters. ↑
ⓘ Cost ranges are severity-bucket heuristics (US national rule-of-thumb). Get contractor quotes + a written scope before underwriting a rehab budget.
Schools (NCES district)
- District
- South-Western City
- NCES district ID
- 3904480
- Math proficiency
- 40% ▼ -18.00%
- Reading proficiency
- 48% ▼ -10.00%
- Median HH income
- $51,689
- Composite
- 37.95/100
- National rank
- #4305
- State rank
- #500 of 656 in OH
Livability — Columbus
- Score
- 81/100
- State rank
- #97
- US rank
- #1491
Category grades
Schools grade is shown separately in the Schools card above.
Census & demographics
- Census place
- Columbus, OH
- County
- Franklin County · 1,351,780 people
- City population
- 612,189
- Metro
- Columbus, OH
- Population (ZIP)
- 67,626
- Household income
- $91,008
- Rent vs Own
- Severe rent burden
- 1087.0
Population outlook (Franklin County) Hauer SSP2
- Today (2025)
- 1,456,139 people
- By 2030
- 1,556,890 · +6.9%
- By 2040
- 1,757,349 · +20.7%
- By 2050
- 1,950,539 · +34.0%
- By 2075
- 2,376,171 · +63.2%
- By 2100
- 2,636,796 · +81.1%
Race, ethnicity, and origin ACS 2023
- Neighborhood character
- Predominantly White (84%)
- Race & ethnicity
- White 84% Two or more races 6% Hispanic / Latino 5% Black 5% Asian 2%
- Common ancestry
- Romanian 2% Slovak 2% Italian 2%
- Foreign-born
- 4% · Canada, Vietnam, China
- Languages at home
- 93% English-only · Spanish 3% Russian/Polish/Slavic 1% Other Indo-European 1%
Political lean MEDSL · Franklin
- 2024 margin
- Strong D (+28.4) · D 63.7% · R 35.3% · Other 1.0%
- 2008→2024 swing
- +7.7pp toward D · 2008: 20.7pp · 2024: 28.4pp
- All cycles
- 2024: D+28.4 2020: D+31.4 2016: D+25.9 2012: D+21.7 2008: D+20.7
Not yet ingested
- Civics
- —
Market trends
- HPI YoY
- ▼ -241.42%
- Current HPI
- 238.709
- Rent YoY
- ▲ 3.68%
- Metro
- Columbus, OH
- State GDP YoY
- ▲ 1.98%
- F500 in state
- 48
Industry mix (Fortune 500 HQ in OH)
| Industry | F500 HQs | Revenue |
|---|---|---|
| Insurance | 3 | $145B |
|
||
| Industrial Machinery | 3 | $49B |
|
||
| Financial Services | 3 | $24B |
|
||
| Consumer Goods | 2 | $93B |
|
||
| Aerospace / Defense | 2 | $47B |
|
||
| Utilities | 2 | $33B |
|
||
Price history
+0.0% since first listed2 events — show timeline
- 2026-06-12 Listed $124,900 CBRMLS
- 2026-06-11 Coming Soon $124,900 CBRMLS
Cash-flow waterfall
monthlySold comps — $/sqft
last 12 mo · ≤1 miLoading sold comps…