 Multi-family
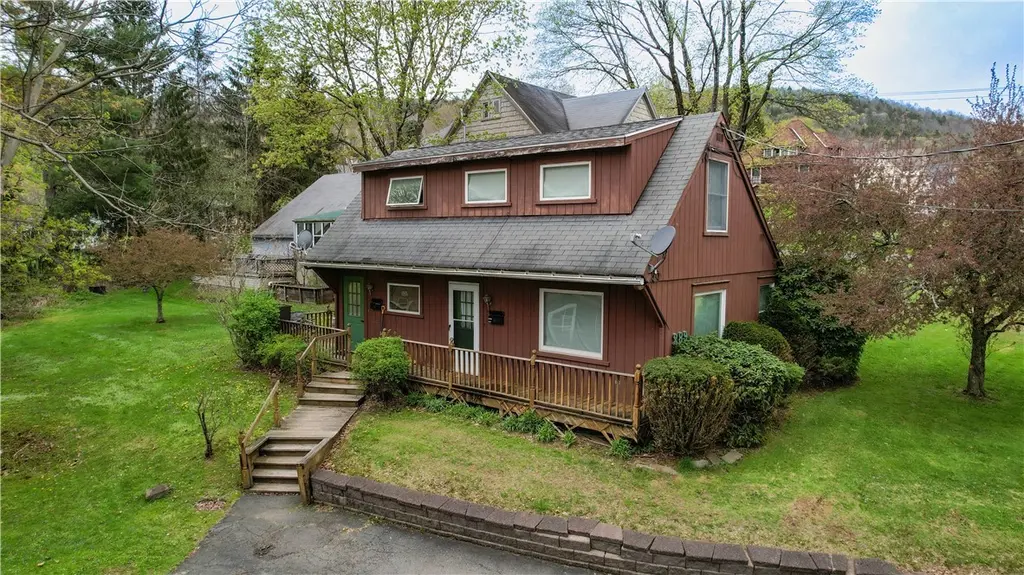
1 Hudson St · Walton, NY
Flood risk 1/10 · Minimal
- FEMA flood zone
- X (unshaded)
- Chance of flooding over 30 yrs
- 0.0%
- Est. flood insurance / yr
- $473 – $860
Fire risk 1/10 · Minimal
- Est. fire insurance / yr
- $691 – $1,283
Heat risk 3/10 · Minor
- Hot days now (above 90°F)
- 8 days/yr
- Hot days in 30 yrs
- 19 days/yr
Wind risk 2/10 · Minimal
- Chance of severe wind over 30 yrs
- 1.0%
Air-quality risk 2/10 · Minimal
- Unhealthy air days now
- 0 days/yr
- Unhealthy air days in 30 yrs
- 1 days/yr
Risk factors via First Street. Map © Google.
Why this score? — see what drove the B- grade
The composite is a weighted blend of 9 inputs, each scored 0–100. Each bar is that input's sub-score; the figure is the points it added to the 100-point composite (weight × sub-score).
- Cash flow +30.0/30.0
- 1% rule +10.0/10.0
- DSCR +10.0/10.0
- Appreciation +7.9/10.0
- Schools +3.5/10.0
- Livability +3.5/5.0
- Rent growth +2.5/5.0
- Condition / age +1.0/5.0
- ARV discount +0.0/15.0
$300,000
🖨 Deal sheet (PDF) 📄 Offer letter ✓ Due diligence
Multi-family units
County records classify this as Multi-Family (2-4 Unit). Listing-text estimate: 1 unit. estimate disagrees with records
Listing remarks
2 for 1 deal! Don’t miss this opportunity to own this 2 unit investment property at 1 Hudson St. that sits right next door to 293 Delaware St. which is being sold as a package deal. This 2 unit property offers a fully rented investment opportunity. With a 2 bedroom unit and a studio apartment upstairs, large yard with shed. Newer hot water heater and onsite laundry for the convenience of the tenants. At 293 Delaware spacious single family home offers comfort and functionality on a corner lot, 4 bedrooms and 2 full baths, one bedroom is currently used as a second floor laundry room. Bedrooms upstairs have gorgeous windows in the closets, offering natural light and unique charm. The mai
Key facts
- Onsite laundry
- Screened-in porch
- Large yard
Tags
Property features AI
Finance
- Other: Owner pays hot water and water for tenants per listing notes; Meters: 1 separate gas meter, 3 separate electric meters
- Financial info: Property is a 2-unit building with separate rent for each unit (unit rents shown as $500 and $400); Operating expenses may include fuel, maintenance, water/sewer and other items as noted
Exterior
- Parking: Common parking
- Utilities: Electricity connected; Public water connected; Sewer connected
- Home design: Two-story multi-family building; Resale property; Wood siding exterior; Shingle roof
- Construction: Wood siding construction; Shingle roof; Built (existing structure)
- Exterior features: Open porch
Interior
- Kitchen: Oven/range and refrigerator in units; Eat-in kitchen in one unit
- Bedrooms: Two 2-bedroom units (each unit description includes bedrooms)
- Flooring: Carpet; Vinyl; Varies by area/unit
- Bathrooms: Two full bathrooms total across units (each unit has 1 full bathroom)
- Heating & cooling: Gas heating; Hot water heating
- Interior features: Carpet, vinyl, and varying floor materials; Crawl space with dirt floor basement
- Laundry & utility: Common area laundry; Gas water heater
Neighborhood map
What this means for you Summary
Snapshot
- This is a 2-bed/2.0-bath multifamily listed at $300k. Condition is rated poor.
Deal economics
- At list price, monthly cash flow is $1k ($18k/yr) — positive.
- The deal already cash-flows at list — no discount required.
- Meets the 1% rule at list price ($5k rent vs $300k).
- Recommended offer: $291k (3.0% below list) — sets the bar for market timing.
- Cap rate 12.3% vs local median 7.8% in Walton — top-decile yield for the area; either an underpriced asset or a hidden risk that comps aren't pricing in. Stress-test before assuming the spread holds.
Location & tenants
- Location reads 70/100 on livability (#443 in NY) — a middle-class / working-renter tenant base. Strengths: cost of living A+, health & safety A+; Watch: amenities F, commute F, employment F.
- Walton Central School District (town): math 36% / reading 47% proficiency, ranked #510 of 590 in NY (top 86%) — families likely to look elsewhere, expect single-tenant / working-renter base with shorter leases.
- Zoned schools: Townsend Elementary School (math 32% / reading 42%, grade F, #1,519 of 2,108 statewide, top 74%, 367 students, 47% FRL); Walton Middle School (math 17% / reading 42%, grade F, #550 of 729 statewide, top 77%, 189 students, 54% FRL); Walton High School (math 84% / reading 90%, grade A, #308 of 1,100 statewide, top 28%, 283 students, 50% FRL) — zoned schools at 51% FRL track the district average.
- Market conditions: 56 active listings in the ZIP; 66 units permitted in Delaware County in 2024 (0 in 5+ unit buildings).
Forward outlook
- In year one you build about $19k of equity ($2k loan paydown + $17k appreciation (5.8% local appreciation)).
- Delaware County population projected at -27% by 2050 — secular population decline; favor cash flow + early exit over multi-decade hold.
- At projected returns (5.8% appreciation + 3.0% rent growth), your $84k cash investment doubles in ~3 years — after that, you're playing with house money.
- By year 2, paydown + projected appreciation supports a ~$31k cash-out refi (75% LTV) — recoverable capital for the next deal without selling this one.
Negotiation context
- It's been on market 52 days — a 3% lower offer ($291k) is reasonable based on typical stale-listing flexibility.
Risks & watch-outs
- Watch-outs: built in 1945 — expect roof / HVAC / electrical / plumbing capex.
Questions for the listing agent
- It's been on market 52 days. Have you received any prior offers? Is the seller open to a 3% concession, seller financing, or rate buy-down credit?
- Have any recent inspections been done? Can we get a copy of the seller's disclosures and any deferred-maintenance estimates?
- Built in 1945 — when were the roof, HVAC, electrical panel, plumbing, and water heater last replaced?
- Is there a deadline driving the sale (1031 exchange, divorce, estate, relocation)? That informs how much negotiation room exists.
- Schools are D-rated, which usually means shorter tenancies and higher turnover. Who's the typical renter profile here, and what's been the actual vacancy rate?
- What's the average days-on-market for RENTAL listings here right now (not sales)? A rising rental-DOM trend means longer vacancies and softer asking-rent achievability than the comps imply.
- What's the recent tenant-quality profile in this submarket — average credit score on applications, eviction rate, late-payment / NSF rate, and stable-employment percentage? A property-management company in the area should have these aggregated.
- How much new apartment / multifamily construction is in the pipeline within 1–3 miles? Heavy new supply (>2% of stock underway) typically softens rents 12–24 months out; light construction supports rent growth.
Investment metrics
- 1% rule
- 1.51% ✓
- Cap rate
- 12.27%
- Cash-on-cash
- 21.35%
- DSCR
- 1.95
- GRM
- 5.5
CMA / ARV
- ARV (median comp)
- $229,364
- List price
- $300,000
- Delta
- 30.80%
- Verdict
- OVERPRICED
- Comps
- 9 within 1.0 mi
Projected returns pro-forma
5.79% appreciation · 3.0% rent growth · sell at horizon
- IRR
- 32.9%
- Equity multiple
- 3.12×
- Total profit
- $178,208
- Equity at exit
- $184,702
- IRR
- 30.8%
- Equity multiple
- 6.37×
- Total profit
- $450,804
- Equity at exit
- $331,640
Cash invested: $84,000 (down + closing). Projections, not guarantees.
Landlord ↔ Tenant lean methodology
- Overall (STATE)
- 15 Strongly Tenant-Friendly
- State New York
- 15 Strongly Tenant-Friendly · D+10
- County
- — inherits STATE
- City
- — inherits STATE
ZIP-level market 13856
- Home prices YoY
- 1.8%
- Active inventory
- 56
- Price-to-rent
- 10.9×
Monthly cashflow live
- Estimated rent
- $4,516 medium interval (Pro) →
- Mortgage (P&I)
- −$1,573
- Tax est. 1.5%
- −$375 /mo · $4,500/yr
- Insurance
- −$125
- HOA
- −$0
- Vacancy / Maint / Mgmt
- −$948
- Net cashflow
- $1,494
Break-even live
Sensitivity live
| Price | -10% $1,702 | -5% $1,598 | +0% $1,494 | +5% $1,391 | +10% $1,287 |
|---|---|---|---|---|---|
| Rent | -10% $1,138 | -5% $1,316 | +0% $1,494 | +5% $1,673 | +10% $1,851 |
| Rate | -1.0pp $1,645 | -0.5pp $1,571 | base $1,494 | +0.5pp $1,417 | +1.0pp $1,338 |
2-unit breakdown (identical units grouped — click to expand)
| Units | Beds | Baths | Est. rent |
|---|---|---|---|
| 1× unit | 2 | 1 | $2,284 |
| 1× unit | 1 | 1 | $2,233 |
| Total (2 units) | $4,516 | ||
UW: 25.0% down · 7.5% · 30yr · 1.5% tax · 5.0% vac · 8.0% maint · 8.0% mgmt
Financing live
Cash to close
- Down payment
- $75,000
- Closing costs
- $9,000
- Reserves months
- —
- Total cash needed
- —
Loan-product check · same deal, 3 products live
Conventional
25% down · 7.5% · 30yr
- Down + closing
- —
- Monthly P&I
- —
- Monthly cashflow
- —
- DSCR
- —
- Eligible?
- —
Personal DTI + credit; lowest rate.
DSCR
20% down · 8.5% · 30yr
- Down + closing
- —
- Monthly P&I
- —
- Monthly cashflow
- —
- DSCR
- —
- Eligible?
- —
No personal income docs; deal must DSCR.
Hard money
10% down · 12.0% · 12mo
- Down + closing
- —
- Monthly P&I
- —
- Monthly cashflow
- —
- DSCR
- —
- Eligible?
- —
Short-term bridge; refi at stabilization.
Listing history 17 events
-
2026-06-21days on market $300,000 Active 52 DOM
-
2026-06-21days on market $300,000 Active 51 DOM
-
2026-06-18days on market $300,000 Active 49 DOM
-
2026-06-17days on market $300,000 Active 48 DOM
-
2026-06-16days on market $300,000 Active 47 DOM
-
2026-06-15days on market $300,000 Active 46 DOM
-
2026-06-13days on market $300,000 Active 44 DOM
-
2026-06-12days on market $300,000 Active 43 DOM
-
2026-06-09days on market $300,000 Active 40 DOM
-
2026-06-08days on market $300,000 Active 39 DOM
-
2026-06-07days on market $300,000 Active 38 DOM
-
2026-06-07days on market $300,000 Active 37 DOM
-
2026-06-04days on market $300,000 Active 34 DOM
-
2026-06-02days on market $300,000 Active 33 DOM
-
2026-06-01days on market $300,000 Active 32 DOM
-
2026-05-31days on market $300,000 Active 31 DOM
-
2026-04-29$300,000 Active 1006-char remark
ⓘ Source: listings_history table (triggers on properties + properties_extension) + one-shot
backfill from property_details.listing_events for pre-trigger history.
Climate risk First Street
- Flood 1/10 Low FEMA zone X (unshaded) · 0% chance over 30 yrs
- Wildfire 1/10 Low
- Heat 3/10 Moderate 8 d/yr ≥90°F today · 19 d/yr by 30 yrs out
- Wind 2/10 Low 100% chance of damaging wind over 30 yrs
- Air quality 2/10 Low 0 unhealthy d/yr today · 1 by 30 yrs out
Nearby sold comps map
Loading sold comps map…
Walkable amenities ~0.75 mi
Loading nearby amenities…
Taxation est. · year 1
- Rental income
- $54,192
- − Mortgage interest
- −$16,805
- − Property taxes
- −$4,500
- − Insurance
- −$1,500
- − Repairs & maintenance
- −$4,335
- − Management
- −$4,335
- − Depreciation
- −$8,727
- Taxable income
- $13,989
- Est. tax owed @ 24.0%
- −$3,357
- After-tax cash flow
- $14,575/yr
For passive investors: Depreciation is non-cash, so a rental often shows a tax loss while cash-flowing — sheltering income. Rental losses are passive: they offset passive income freely, and up to $25,000/yr can offset ordinary (W-2) income if you actively participate and your MAGI is under $100k (phasing out to $0 by $150k); unused losses carry forward. On sale, claimed depreciation is recaptured at up to 25%, and gains may owe capital-gains tax (a 1031 exchange can defer both). Figures are a year-1 estimate at your 24.0% rate — not tax advice; consult a CPA.
Condition & rehab AI · 1 photo
This multi-family property requires extensive repairs and updates to its exterior, interior, and HVAC systems, significantly impacting its current condition and value.
Repairs flagged
- Major roof — No photos of roof
- Major exterior siding — No photos of exterior
- Major interior walls/paint — No photos of interior walls/paint
- Major windows — No photos of windows
- Major HVAC/mechanicals — No photos of HVAC/mechanicals
- Major landscaping — No photos of landscaping/curb appeal
Value-add opportunities
- Both exterior painting — Fresh paint can improve curb appeal and property value
- Both HVAC replacement — A new HVAC system can improve comfort and energy efficiency
- Both landscaping — A well-maintained yard can enhance curb appeal and property value
Renovation cost estimate screening
| Repair item | Severity | Est. cost |
|---|---|---|
| roof · No photos of roof | Major | $15,000–50,000 |
| exterior siding · No photos of exterior | Major | $15,000–50,000 |
| interior walls/paint · No photos of interior walls/paint | Major | $15,000–50,000 |
| windows · No photos of windows | Major | $15,000–50,000 |
| HVAC/mechanicals · No photos of HVAC/mechanicals | Major | $15,000–50,000 |
| landscaping · No photos of landscaping/curb appeal | Major | $15,000–50,000 |
| Total estimated repair cost · 6 items | $90,000–300,000 |
Value-add ROI direction
- Both exterior painting — Fresh paint can improve curb appeal and property value ↑
- Both HVAC replacement — A new HVAC system can improve comfort and energy efficiency ↑
- Both landscaping — A well-maintained yard can enhance curb appeal and property value ↑
ⓘ Cost ranges are severity-bucket heuristics (US national rule-of-thumb). Get contractor quotes + a written scope before underwriting a rehab budget.
Schools (NCES district)
- District
- Walton Central School District
- NCES district ID
- 3629820
- Math proficiency
- 36% ▬ 0.00%
- Reading proficiency
- 47% ▲ 3.00%
- Median HH income
- $41,231
- Composite
- 34.86/100
- National rank
- #5088
- State rank
- #510 of 590 in NY
Livability — Walton
- Score
- 70/100
- State rank
- #443
- US rank
- #7789
Category grades
Schools grade is shown separately in the Schools card above.
Census & demographics
- Census place
- Walton, NY
- Population (ZIP)
- 5,915
Population outlook (Delaware County) Hauer SSP2
- Today (2025)
- 42,668 people
- By 2030
- 40,337 · -5.5%
- By 2040
- 35,514 · -16.8%
- By 2050
- 31,265 · -26.7%
- By 2075
- 24,455 · -42.7%
- By 2100
- 19,529 · -54.2%
Race, ethnicity, and origin ACS 2023
- Neighborhood character
- Predominantly White (90%)
- Race & ethnicity
- White 90% Black 5% Two or more races 5% Hispanic / Latino 2%
- Common ancestry
- Iranian 7% Slovak 3% Lithuanian 3%
- Foreign-born
- 3% · Canada, Philippines
- Languages at home
- 94% English-only · Spanish 2% Other Indo-European 1% French/Haitian/Cajun 1%
Political lean MEDSL · Delaware
- 2024 margin
- R (+19.8) · D 40.1% · R 59.9%
- 2008→2024 swing
- -14.6pp toward R · 2008: -5.2pp · 2024: -19.8pp
- All cycles
- 2024: R+19.8 2020: R+18.4 2016: R+29.2 2012: R+9.6 2008: R+5.2
Not yet ingested
- Civics
- —
Market trends
- HPI YoY
- ▲ 5.79%
- Current HPI
- 331.9799
- Rent YoY
- —
- Metro
- —
- State GDP YoY
- ▲ 2.60%
- F500 in state
- 92
Industry mix (Fortune 500 HQ in NY)
| Industry | F500 HQs | Revenue |
|---|---|---|
| Financial Services | 10 | $950B |
|
||
| Consumer Goods | 9 | $162B |
|
||
| Insurance | 4 | $225B |
|
||
| Telecommunications | 2 | $144B |
|
||
| Pharmaceuticals | 2 | $112B |
|
||
| Media / Entertainment | 2 | $69B |
|
||
Price history
1 event — show timeline
- 2026-04-29 Listed $300,000 UNYREIS
Cash-flow waterfall
monthlySold comps — $/sqft
last 12 mo · ≤1 miLoading sold comps…